Windkessel effect

Last updated
The Windkessel analogy illustrated. Windkessel effect.svg
The Windkessel analogy illustrated.

Windkessel effect is a term used in medicine to account for the shape of the arterial blood pressure waveform in terms of the interaction between the stroke volume and the compliance of the aorta and large elastic arteries (Windkessel vessels) and the resistance of the smaller arteries and arterioles. Windkessel when loosely translated from German to English means 'air chamber', [1] [2] but is generally taken to imply an elastic reservoir. [3] The walls of large elastic arteries (e.g. aorta, common carotid, subclavian, and pulmonary arteries and their larger branches) contain elastic fibers, formed of elastin. These arteries distend when the blood pressure rises during systole and recoil when the blood pressure falls during diastole. Since the rate of blood entering these elastic arteries exceeds that leaving them via the peripheral resistance, there is a net storage of blood in the aorta and large arteries during systole, which discharges during diastole. The compliance (or distensibility) of the aorta and large elastic arteries is therefore analogous to a capacitor (employing the hydraulic analogy); to put it another way, these arteries collectively act as a hydraulic accumulator.

Contents

The Windkessel effect helps in damping the fluctuation in blood pressure (pulse pressure) over the cardiac cycle and assists in the maintenance of organ perfusion during diastole when cardiac ejection ceases. The idea of the Windkessel was alluded to by Giovanni Borelli, although Stephen Hales articulated the concept more clearly and drew the analogy with an air chamber used in fire engines in the 18th century. [4] Otto Frank, an influential German physiologist, developed the concept and provided a firm mathematical foundation. [2] Frank's model is sometimes called a two-element Windkessel to distinguish it from more recent and more elaborate Windkessel models (e.g. three- or four-element and non-linear Windkessel models). [5] [6]

Model types

Modeling of a Windkessel

Windkessel physiology remains a relevant yet dated description of important clinical interest. The historic mathematical definition of systole and diastole in the model are obviously not novel but are here elementally staged to four degrees. Reaching five would be original work.[ citation needed ]

Two-element

2-Element Windkessel Circuit Analogy Illustrated 2-Element Windkessel model.svg
2-Element Windkessel Circuit Analogy Illustrated

It is assumed that the ratio of pressure to volume is constant and that outflow from the Windkessel is proportional to the fluid pressure. Volumetric inflow must equal the sum of the volume stored in the capacitive element and volumetric outflow through the resistive element. This relationship is described by a differential equation:[ citation needed ]

I(t) is volumetric inflow due to the pump (heart) and is measured in volume per unit time, while P(t) is the pressure with respect to time measured in force per unit area, C is the ratio of volume to pressure for the Windkessel, and R is the resistance relating outflow to fluid pressure. This model is identical to the relationship between current, I(t), and electrical potential, P(t), in an electrical circuit equivalent of the two-element Windkessel model.[ citation needed ]

In the blood circulation, the passive elements in the circuit are assumed to represent elements in the cardiovascular system. The resistor, R, represents the total peripheral resistance and the capacitor, C, represents total arterial compliance. [7]

During diastole there is no blood inflow since the aortic (or pulmonary valve) is closed, so the Windkessel can be solved for P(t) since I(t) = 0:

where td is the time of the start of diastole and P(td) is the blood pressure at the start of diastole. This model is only a rough approximation of the arterial circulation; more realistic models incorporate more elements, provide more realistic estimates of the blood pressure waveform and are discussed below.

Three-element

The three-element Windkessel improves on the two-element model by incorporating another resistive element to simulate resistance to blood flow due to the characteristic resistance of the aorta (or pulmonary artery). The differential equation for the 3-element model is:[ citation needed ]

3-Element 3-Element Windkessel Model.svg
3-Element

where R1 is the characteristic resistance (this is assumed to be equivalent to the characteristic impedance), [7] while R2 represents the peripheral resistance. This model is widely used as an acceptable model of the circulation. [5] For example it has been employed to evaluate blood pressure and flow in the aorta of a chick embryo [8] and the pulmonary artery in a pig [8] as well as providing the basis for construction of physical models of the circulation providing realistic loads for experimental studies of isolated hearts. [9]

Four-element

4-Element compared to the 2- and 3-Element Windkessel models 2-element, 3-element and 4 element Windkessel models.svg
4-Element compared to the 2- and 3-Element Windkessel models

The three-element model overestimates the compliance and underestimates the characteristic impedance of the circulation. [7] The four-element model includes an inductor, L, which has units of mass per length, (), into the proximal component of the circuit to account for the inertia of blood flow. This is neglected in the two- and three- element models. The relevant equation is:

Applications

These models relate blood flow to blood pressure through parameters of R, C (and, in the case of the four-element model, L). These equations can be easily solved (e.g. by employing MATLAB and its supplement SIMULINK) to either find the values of pressure given flow and R, C, L parameters, or find values of R, C, L given flow and pressure. An example for the two-element model is shown below, where I(t) is depicted as an input signal during systole and diastole. Systole is represented by the sin function, while flow during diastole is zero. s represents the duration of the cardiac cycle, while Ts represents the duration of systole, and Td represents the duration of diastole (e.g. in seconds).[ citation needed ]

Graph Evaluating Systole and Diastole Pressure Aortic and ventricular pressure over two cardiac cycles.svg
Graph Evaluating Systole and Diastole Pressure

In physiology and disease

The 'Windkessel effect' becomes diminished with age as the elastic arteries become less compliant, termed hardening of the arteries or arteriosclerosis, probably secondary to fragmentation and loss of elastin. [10] The reduction in the Windkessel effect results in increased pulse pressure for a given stroke volume. The increased pulse pressure results in elevated systolic pressure (hypertension) which increases the risk of myocardial infarction, stroke, heart failure and a variety of other cardiovascular diseases. [11]

Limitations

Although the Windkessel is a simple and convenient concept, it has been largely superseded by more modern approaches that interpret arterial pressure and flow waveforms in terms of wave propagation and reflection. [12] Recent attempts to integrate wave propagation and Windkessel approaches through a reservoir concept, [13] have been criticized [14] [15] and a recent consensus document highlighted the wave-like nature of the reservoir. [16]

See also

Related Research Articles

<span class="mw-page-title-main">Aorta</span> Largest artery in the human body

The aorta is the main and largest artery in the human body, originating from the left ventricle of the heart, branching upwards immediately after, and extending down to the abdomen, where it splits at the aortic bifurcation into two smaller arteries. The aorta distributes oxygenated blood to all parts of the body through the systemic circulation.

In medicine, a pulse represents the tactile arterial palpation of the cardiac cycle (heartbeat) by trained fingertips. The pulse may be palpated in any place that allows an artery to be compressed near the surface of the body, such as at the neck, wrist, at the groin, behind the knee, near the ankle joint, and on foot. Pulse is equivalent to measuring the heart rate. The heart rate can also be measured by listening to the heart beat by auscultation, traditionally using a stethoscope and counting it for a minute. The radial pulse is commonly measured using three fingers. This has a reason: the finger closest to the heart is used to occlude the pulse pressure, the middle finger is used get a crude estimate of the blood pressure, and the finger most distal to the heart is used to nullify the effect of the ulnar pulse as the two arteries are connected via the palmar arches. The study of the pulse is known as sphygmology.

<span class="mw-page-title-main">Heart valve</span> A flap of tissue that prevent backflow of blood around the heart

A heart valve is a biological one-way valve that allows blood to flow in one direction through the chambers of the heart. Four valves are usually present in a mammalian heart and together they determine the pathway of blood flow through the heart. A heart valve opens or closes according to differential blood pressure on each side.

<span class="mw-page-title-main">Cardiac output</span> Measurement of blood pumped by the heart

In cardiac physiology, cardiac output (CO), also known as heart output and often denoted by the symbols , , or , is the volumetric flow rate of the heart's pumping output: that is, the volume of blood being pumped by a single ventricle of the heart, per unit time. Cardiac output (CO) is the product of the heart rate (HR), i.e. the number of heartbeats per minute (bpm), and the stroke volume (SV), which is the volume of blood pumped from the left ventricle per beat; thus giving the formula:

<span class="mw-page-title-main">Systole</span> Part of the cardiac cycle when a heart chamber contracts

Systole is the part of the cardiac cycle during which some chambers of the heart contract after refilling with blood.

Hemodynamics or haemodynamics are the dynamics of blood flow. The circulatory system is controlled by homeostatic mechanisms of autoregulation, just as hydraulic circuits are controlled by control systems. The hemodynamic response continuously monitors and adjusts to conditions in the body and its environment. Hemodynamics explains the physical laws that govern the flow of blood in the blood vessels.

Hemorheology, also spelled haemorheology, or blood rheology, is the study of flow properties of blood and its elements of plasma and cells. Proper tissue perfusion can occur only when blood's rheological properties are within certain levels. Alterations of these properties play significant roles in disease processes. Blood viscosity is determined by plasma viscosity, hematocrit and mechanical properties of red blood cells. Red blood cells have unique mechanical behavior, which can be discussed under the terms erythrocyte deformability and erythrocyte aggregation. Because of that, blood behaves as a non-Newtonian fluid. As such, the viscosity of blood varies with shear rate. Blood becomes less viscous at high shear rates like those experienced with increased flow such as during exercise or in peak-systole. Therefore, blood is a shear-thinning fluid. Contrarily, blood viscosity increases when shear rate goes down with increased vessel diameters or with low flow, such as downstream from an obstruction or in diastole. Blood viscosity also increases with increases in red cell aggregability.

<span class="mw-page-title-main">Diastole</span> Part of the cardiac cycle

Diastole is the relaxed phase of the cardiac cycle when the chambers of the heart are refilling with blood. The contrasting phase is systole when the heart chambers are contracting. Atrial diastole is the relaxing of the atria, and ventricular diastole the relaxing of the ventricles.

Vascular resistance is the resistance that must be overcome to push blood through the circulatory system and create blood flow. The resistance offered by the systemic circulation is known as the systemic vascular resistance (SVR) or may sometimes be called by the older term total peripheral resistance (TPR), while the resistance offered by the pulmonary circulation is known as the pulmonary vascular resistance (PVR). Systemic vascular resistance is used in calculations of blood pressure, blood flow, and cardiac function. Vasoconstriction increases SVR, whereas vasodilation decreases SVR.

Compliance is the ability of a hollow organ (vessel) to distend and increase volume with increasing transmural pressure or the tendency of a hollow organ to resist recoil toward its original dimensions on application of a distending or compressing force. It is the reciprocal of "elastance", hence elastance is a measure of the tendency of a hollow organ to recoil toward its original dimensions upon removal of a distending or compressing force.

<span class="mw-page-title-main">Cardiac cycle</span> Performance of the human heart

The cardiac cycle is the performance of the human heart from the beginning of one heartbeat to the beginning of the next. It consists of two periods: one during which the heart muscle relaxes and refills with blood, called diastole, following a period of robust contraction and pumping of blood, called systole. After emptying, the heart relaxes and expands to receive another influx of blood returning from the lungs and other systems of the body, before again contracting to pump blood to the lungs and those systems. A normally performing heart must be fully expanded before it can efficiently pump again. Assuming a healthy heart and a typical rate of 70 to 75 beats per minute, each cardiac cycle, or heartbeat, takes about 0.8 second to complete the cycle.

Pulsus bisferiens, also known as biphasic pulse, is an aortic waveform with two peaks per cardiac cycle, a small one followed by a strong and broad one. It is a sign of problems with the aorta, including aortic stenosis and aortic regurgitation, as well as hypertrophic cardiomyopathy causing subaortic stenosis.

Arterial stiffness occurs as a consequence of biological aging and arteriosclerosis. Inflammation plays a major role in arteriosclerosis development, and consequently it is a major contributor in large arteries stiffening. Increased arterial stiffness is associated with an increased risk of cardiovascular events such as myocardial infarction, hypertension, heart failure and stroke, the two leading causes of death in the developed world. The World Health Organization predicts that in 2010, cardiovascular disease will also be the leading killer in the developing world and represents a major global health problem.

Pulse wave velocity (PWV) is the velocity at which the blood pressure pulse propagates through the circulatory system, usually an artery or a combined length of arteries. PWV is used clinically as a measure of arterial stiffness and can be readily measured non-invasively in humans, with measurement of carotid to femoral PWV (cfPWV) being the recommended method. cfPWV is highly reproducible, and predicts future cardiovascular events and all-cause mortality independent of conventional cardiovascular risk factors. It has been recognized by the European Society of Hypertension as an indicator of target organ damage and a useful additional test in the investigation of hypertension.

A plot of a system's pressure versus volume has long been used to measure the work done by the system and its efficiency. This analysis can be applied to heat engines and pumps, including the heart. A considerable amount of information on cardiac performance can be determined from the pressure vs. volume plot. A number of methods have been determined for measuring PV-loop values experimentally.

<span class="mw-page-title-main">Arterial resistivity index</span>

The arterial resistivity index, developed by Léandre Pourcelot, is a measure of pulsatile blood flow that reflects the resistance to blood flow caused by microvascular bed distal to the site of measurement.

Continuous noninvasive arterial pressure (CNAP) is the method of measuring beat-to-beat arterial blood pressure in real-time without any interruptions (continuously) and without cannulating the human body (noninvasive).

<span class="mw-page-title-main">Hemodynamics of the aorta</span> Study of the flow patterns and forces in the thoracic aorta

The hemodynamics of the aorta is an ongoing field of research in which the goal is to identify what flow patterns and subsequent forces occur within the thoracic aorta. These patterns and forces are used to identify the presence and severity of cardiovascular diseases such as aortic aneurysm and atherosclerosis. Some of the methods used to study the hemodynamics of aortic flow are patient scans, computational fluid dynamics models, and particle tracking velocimetry (PTV). The information gathered through these studies can be used for surgery planning and the development of implants. Greater understanding of this topic reduces mortality rates associated with cardiovascular disease.

<span class="mw-page-title-main">Lumped parameter model for the cardiovascular system</span>

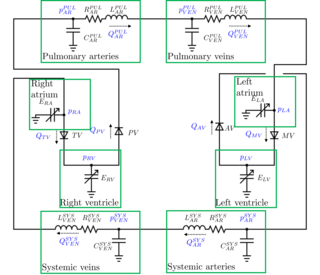
A lumped parameter cardiovascular model is a zero-dimensional mathematical model used to describe the hemodynamics of the cardiovascular system. Given a set of parameters that have a physical meaning, it allows to study the changes in blood pressures or flow rates throughout the cardiovascular system. Modifying the parameters, it is possible to study the effects of a specific disease. For example, arterial hypertension is modeled increasing the arterial resistances of the model.

<span class="mw-page-title-main">Wave intensity analysis</span> Method in the dynamics of blood flow

Wave intensity analysis provides a method to calculate the properties of arterial waves that give rise to arterial blood pressure, based on measurements of pressure, P, and velocity, U, waveforms. Wave intensity analysis is applicable to the evaluation of circulatory physiology and quantifying the pathophysiology of disorders such as coronary artery disease.

References

  1. Sagawa K, Lie RK, Schaefer J (March 1990). "Translation of Otto Frank's paper "Die Grundform des Arteriellen Pulses" Zeitschrift für Biologie 37: 483-526 (1899)". Journal of Molecular and Cellular Cardiology. 22 (3): 253–4. doi:10.1016/0022-2828(90)91459-K. PMID   2192068.
  2. 1 2 Frank O (March 1990). "The basic shape of the arterial pulse. First treatise: mathematical analysis. 1899". Journal of Molecular and Cellular Cardiology. 22 (3): 255–77. doi:10.1016/0022-2828(90)91460-O. PMID   21438422.
  3. Ganong MD, William F (2005). Review of Medical Physiology (Twenty-Second ed.). The McGraw-Hill Companies, Inc. p. 587. ISBN   9780071440400.
  4. Hales S (1733). Statical Essays: Haemastaticks.
  5. 1 2 Westerhof N, Lankhaar JW, Westerhof BE (February 2009). "The arterial Windkessel". Medical & Biological Engineering & Computing. 47 (2): 131–41. doi: 10.1007/s11517-008-0359-2 . PMID   18543011.
  6. Cappello A, Gnudi G, Lamberti C (March 1995). "Identification of the three-element windkessel model incorporating a pressure-dependent compliance". Annals of Biomedical Engineering. 23 (2): 164–77. doi:10.1007/bf02368323. PMID   7605053.
  7. 1 2 3 Westerhof N, Stergiopulos N, Noble MI (2010). Snapshots of hemodynamics : an aid for clinical research and graduate education (2nd ed.). New York: Springer. ISBN   9781441963635. OCLC   676701119.
  8. 1 2 Kerner DR. "Solving Windkessel Models with MLAB". Civilized Software, Inc. Retrieved 2018-11-14.
  9. Westerhof N, Elzinga G, Sipkema P (November 1971). "An artificial arterial system for pumping hearts". Journal of Applied Physiology. 31 (5): 776–81. doi:10.1152/jappl.1971.31.5.776. PMID   5117196.
  10. Greenwald SE (January 2007). "Ageing of the conduit arteries". The Journal of Pathology. 211 (2): 157–72. doi: 10.1002/path.2101 . PMID   17200940.
  11. Lewington S, Clarke R, Qizilbash N, Peto R, Collins R (December 2002). "Age-specific relevance of usual blood pressure to vascular mortality: a meta-analysis of individual data for one million adults in 61 prospective studies". Lancet. 360 (9349): 1903–13. doi:10.1016/S0140-6736(02)11911-8. PMID   12493255.
  12. Nichols WW, O'Rourke MF (2005). McDonald's Blood Flow in Arteries: Theoretical, Experimental and Clinical Principles (5th ed.). Hodder Arnold Publication. ISBN   9780340809419.
  13. Tyberg JV, Davies JE, Wang Z, Whitelaw WA, Flewitt JA, Shrive NG, Francis DP, Hughes AD, Parker KH, Wang JJ (February 2009). "Wave intensity analysis and the development of the reservoir-wave approach". Medical & Biological Engineering & Computing. 47 (2): 221–32. doi:10.1007/s11517-008-0430-z. PMID   19189147.
  14. Segers P, Swillens A, Vermeersch S (April 2012). "Reservations on the reservoir". Journal of Hypertension. 30 (4): 676–8. doi: 10.1097/HJH.0b013e32835077be . PMID   22418902.
  15. Westerhof N, Segers P, Westerhof BE (July 2015). "Wave Separation, Wave Intensity, the Reservoir-Wave Concept, and the Instantaneous Wave-Free Ratio: Presumptions and Principles". Hypertension. 66 (1): 93–8. doi: 10.1161/HYPERTENSIONAHA.115.05567 . PMID   26015448.
  16. Segers P, O'Rourke MF, Parker K, Westerhof N, Hughes A (June 2017). "Towards a consensus on the understanding and analysis of the pulse waveform: Results from the 2016 Workshop on Arterial Hemodynamics: Past, present and future". Artery Research. 18: 75–80. doi:10.1016/j.artres.2017.03.004. PMC   5470638 . PMID   28626494.