1976 United States presidential election in Virginia

Last updated

1976 United States presidential election in Virginia
Flag of Virginia.svg
  1972 November 2, 1976 1980  
  Gerald Ford presidential portrait (cropped 2).jpg Jimmy Carter 1977 cropped.jpg
Nominee Gerald Ford Jimmy Carter
Party Republican Democratic
Home state Michigan Georgia
Running mate Bob Dole Walter Mondale
Electoral vote120
Popular vote836,554813,896
Percentage49.29%47.96%

Virginia Presidential Election Results 1976.svg
County and Independent City Results

President before election

Gerald Ford
Republican

Elected President

Jimmy Carter
Democratic

The 1976 United States presidential election in Virginia took place on November 2, 1976. All 50 states and the District of Columbia were part of the 1976 United States presidential election. Virginia voters chose twelve electors to the Electoral College, which selected the president and vice president of the United States.

Contents

Virginia had voted Republican at all but one of the previous six presidential elections, largely due to its large white Washington and Richmond suburbs that received large-scale in-migration from the Northeast, [1] alongside the Shenandoah Valley, [2] being amongst the first traditionally Democratic areas of the former Confederacy to turn Republican at both the presidential level and in federal congressional elections. [3] After the collapse of the Byrd Organization and the expansion of the state's formerly small electorate via the Voting Rights Act, these trends intensified except in the heavily unionised coalfields of Southwest Virginia, where unlike elsewhere in the Confederacy, many newly registered poor whites voted Democratic. The statewide Democratic party was severely divided into conservative, moderate and liberal factions, [4] so that in addition to voting Republican in five of six presidential elections, Virginia's Congressional delegation would gain a Republican majority as early as the 91st Congress, although it was 1970 before significant GOP gains occurred in the state legislature.

It was generally acknowledged that President Nixon offered no support to down-ballot Republican candidates, [5] but the division in the state Democrats was so bad that they did not nominate a candidate for governor in 1973 — with most of the party supporting populist Henry Howell. [6] However, the Democrats did regain a dozen seats in the state legislature in 1975.

Carter did do relatively well in many rural sections of Virginia – for instance he is the solitary Democratic presidential nominee to top forty percent in traditionally arch-Republican Floyd County since Grover Cleveland in 1892. As of the 2020 presidential election , this is the last occasion a Democratic presidential nominee has carried Amelia County, Bedford County, Botetourt County, Charlotte County, Cumberland County, Fluvanna County, Gloucester County, Goochland County, Grayson County, Halifax County, King George County, New Kent County, Nottoway County, Patrick County, Prince George County, Rappahannock County, Rockbridge County, Scott County, Spotsylvania County, Warren County, Bristol City and Salem City, while Stafford County would not vote for the Democratic nominee again until 2020. [7] It is also the last occasion Virginia voted to the left of California, Connecticut, Illinois, Vermont or Washington state.

Campaign

During the fall campaign, Virginia was the scene of debates between Carter and Ford in the third week of October. They would have their final debate of the whole campaign at the College of William and Mary. [8]

56% of white voters supported Ford while 40% supported Carter. [9] [10] Virginia was the only southern state to support Ford. [11]

Predictions

SourceRankingAs of
Simpson's Leader-Times [12] TossupOctober 16, 1976
The Sentinel [8] TossupOctober 18, 1976
Daily Press [13] Lean ROctober 24, 1976
Kansas City Times [14] Lean ROctober 24, 1976
Daily News [15] Likely ROctober 27, 1976
Austin American-Statesman [16] TossupOctober 31, 1976
New York Times [17] Lean RNovember 1, 1976

Results

1976 United States presidential election in Virginia [18]
PartyCandidateVotesPercentageElectoral votes
Republican Gerald Ford (inc.)836,55449.29%12
Democratic Jimmy Carter 813,89647.96%0
Socialist Workers Peter Camejo 17,8021.05%0
American Thomas J. Anderson 16,6860.98%0
U.S. Labor Lyndon LaRouche 7,5080.44%0
Libertarian Roger MacBride 4,6480.27%0
Totals1,697,094100.00%12

Results by county or independent city

1976 United States presidential election in Virginia by county or independent city [19]
Gerald Rudolph Ford
Republican
James Earl Carter
Democratic
Peter Camejo Guanche
Socialist Workers
Thomas Jefferson Anderson
American
Lyndon Hermyle LaRouche
U.S. Labor
Roger Lea MacBride
Libertarian
MarginTotal votes cast
#%#%#%#%#%#%#%
Accomack County 4,49447.13%4,80750.41%870.91%900.94%400.42%180.19%-313-3.28%9,536
Albemarle County 9,08454.62%7,31043.95%220.13%580.35%490.29%1090.66%1,77410.67%16,632
Alleghany County 1,75641.17%2,46257.73%140.33%190.45%90.21%50.12%-706-16.55%4,265
Amelia County 1,63447.25%1,71549.60%90.26%561.62%361.04%80.23%-81-2.34%3,458
Amherst County 3,95650.87%3,67547.26%230.30%440.57%490.63%290.37%2813.61%7,776
Appomattox County 1,96450.84%1,70244.06%792.05%802.07%290.75%90.23%2626.78%3,863
Arlington County 30,97247.95%32,53650.37%3530.55%3870.60%1210.19%2300.36%-1,564-2.42%64,599
Augusta County 8,45257.53%5,62638.29%2071.41%3152.14%590.40%330.22%2,82619.23%14,692
Bath County 88845.96%1,02953.26%20.10%80.41%30.16%20.10%-141-7.30%1,932
Bedford County 4,18945.31%4,76651.55%1211.31%1351.46%240.26%110.12%-577-6.24%9,246
Bland County 1,04751.91%96147.65%10.05%50.25%20.10%10.05%864.26%2,017
Botetourt County 3,34344.14%4,02153.10%831.10%700.92%380.50%180.24%-678-8.95%7,573
Brunswick County 2,38742.11%3,07154.18%560.99%410.72%591.04%540.95%-684-12.07%5,668
Buchanan County 3,85035.89%5,79153.98%5925.52%3673.42%1040.97%240.22%-1,941-18.09%10,728
Buckingham County 1,48739.57%2,17957.98%200.53%270.72%300.80%150.40%-692-18.41%3,758
Campbell County 7,44260.78%4,35435.56%1561.27%1991.63%650.53%290.24%3,08825.22%12,245
Caroline County 1,64834.36%3,06463.89%230.48%210.44%270.56%130.27%-1,416-29.52%4,796
Carroll County 4,82053.75%4,01044.71%150.17%480.54%580.65%170.19%8109.03%8,968
Charles City County 43922.50%1,45574.58%180.92%120.62%190.97%80.41%-1,016-52.08%1,951
Charlotte County 2,02346.04%2,31252.62%120.27%340.77%100.23%30.07%-289-6.58%4,394
Chesterfield County 27,81265.54%14,12633.29%670.16%1680.40%1530.36%1100.26%13,68632.25%42,436
Clarke County 1,44051.54%1,27645.67%140.50%190.68%341.22%110.39%1645.87%2,794
Craig County 54632.75%1,10366.17%110.66%10.06%60.36%00.00%-557-33.41%1,667
Culpeper County 3,65954.64%2,89243.19%460.69%560.84%220.33%210.31%76711.45%6,696
Cumberland County 1,28446.57%1,30247.23%782.83%551.99%160.58%220.80%-18-0.65%2,757
Dickenson County 3,47142.28%4,58355.83%210.26%510.62%730.89%100.12%-1,112-13.55%8,209
Dinwiddie County 2,41337.28%3,87359.83%520.80%320.49%761.17%270.42%-1,460-22.56%6,473
Essex County 1,38050.55%1,30647.84%100.37%190.70%120.44%30.11%742.71%2,730
Fairfax County 110,42453.62%92,03744.69%1,2690.62%1,2580.61%3230.16%6460.31%18,3878.93%205,957
Fauquier County 4,71551.75%4,00243.92%1791.96%1621.78%310.34%220.24%7137.83%9,111
Floyd County 2,07152.76%1,72844.03%220.56%441.12%471.20%130.33%3438.74%3,925
Fluvanna County 1,29646.79%1,41551.08%110.40%100.36%230.83%150.54%-119-4.30%2,770
Franklin County 3,53234.63%6,43963.13%660.65%50.05%700.69%370.36%-2,907-28.50%10,199
Frederick County 5,16259.52%3,38939.08%150.17%540.62%300.35%220.25%1,77320.45%8,672
Giles County 2,73140.53%3,77956.08%811.20%711.05%550.82%220.33%-1,048-15.55%6,739
Gloucester County 3,02547.24%3,15649.28%1041.62%610.95%390.61%190.30%-131-2.05%6,404
Goochland County 2,10447.23%2,25950.71%330.74%200.45%220.49%170.38%-155-3.48%4,455
Grayson County 3,02148.33%3,14650.33%170.27%50.08%360.58%60.10%-125-2.00%6,251
Greene County 1,09551.41%89542.02%552.58%582.72%130.61%140.66%2009.39%2,130
Greensville County 1,13731.18%2,41366.18%250.69%260.71%360.99%90.25%-1,276-35.00%3,646
Halifax County 4,04546.51%4,35250.04%1081.24%1031.18%700.80%190.22%-307-3.53%8,697
Hanover County 11,55964.72%6,06933.98%250.14%920.52%770.43%370.21%5,49030.74%17,859
Henrico County 45,40565.82%21,72931.50%6270.91%9091.32%1620.23%1490.22%23,67634.32%68,981
Henry County 5,61235.02%9,68060.41%3792.37%2331.45%950.59%250.16%-4,068-25.39%16,024
Highland County 62955.57%49343.55%10.09%70.62%10.09%10.09%13612.01%1,132
Isle of Wight County 2,71838.78%4,14559.14%400.57%400.57%500.71%160.23%-1,427-20.36%7,009
James City County 3,18649.36%3,00046.48%1592.46%671.04%230.36%190.29%1862.88%6,454
King and Queen County 77839.06%1,11155.77%271.36%190.95%391.96%180.90%-333-16.72%1,992
King George County 1,38346.75%1,51351.15%90.30%240.81%160.54%130.44%-130-4.39%2,958
King William County 1,59750.60%1,50147.56%60.19%110.35%220.70%190.60%963.04%3,156
Lancaster County 2,38158.44%1,58138.81%400.98%400.98%260.64%60.15%80019.64%4,074
Lee County 4,67945.50%5,41552.65%340.33%380.37%970.94%210.20%-736-7.16%10,284
Loudoun County 9,19251.79%7,99545.05%2051.16%2621.48%470.26%470.26%1,1976.74%17,748
Louisa County 2,15141.89%2,85755.64%190.37%210.41%691.34%180.35%-706-13.75%5,135
Lunenburg County 1,81649.73%1,73947.62%300.82%541.48%80.22%50.14%772.11%3,652
Madison County 1,71052.97%1,46645.42%190.59%210.65%60.19%60.19%2647.56%3,228
Mathews County 1,90857.77%1,30939.63%210.64%310.94%260.79%80.24%59918.14%3,303
Mecklenburg County 4,42350.44%4,07646.48%770.88%850.97%780.89%300.34%3473.96%8,769
Middlesex County 1,60852.91%1,31243.17%381.25%501.65%180.59%130.43%2969.74%3,039
Montgomery County 7,97150.64%7,53947.89%430.27%530.34%640.41%720.46%4322.74%15,742
Nelson County 1,51637.65%2,42660.24%120.30%200.50%340.84%190.47%-910-22.60%4,027
New Kent County 1,25947.62%1,33850.61%90.34%140.53%170.64%70.26%-79-2.99%2,644
Northampton County 2,04343.15%2,45951.93%1162.45%671.41%310.65%190.40%-416-8.79%4,735
Northumberland County 2,16752.52%1,81443.97%591.43%410.99%320.78%130.32%3538.56%4,126
Nottoway County 2,48647.61%2,55848.99%771.47%621.19%290.56%100.19%-72-1.38%5,222
Orange County 2,54949.39%2,30944.74%1272.46%1001.94%490.95%270.52%2404.65%5,161
Page County 3,78051.52%3,40146.35%290.40%490.67%470.64%310.42%3795.17%7,337
Patrick County 2,34943.69%2,74050.96%1041.93%1312.44%470.87%60.11%-391-7.27%5,377
Pittsylvania County 9,17351.21%7,92944.26%3331.86%3151.76%1290.72%340.19%1,2446.94%17,913
Powhatan County 2,01055.28%1,52842.02%90.25%461.27%310.85%120.33%48213.26%3,636
Prince Edward County 2,73450.36%2,44845.09%861.58%711.31%621.14%280.52%2865.27%5,429
Prince George County 2,25445.44%2,63053.02%190.38%180.36%270.54%120.24%-376-7.58%4,960
Prince William County 15,44649.00%15,21548.26%3231.02%4051.28%540.17%810.26%2310.73%31,524
Pulaski County 4,76444.84%5,54652.20%870.82%1061.00%960.90%250.24%-782-7.36%10,624
Rappahannock County 88144.47%1,07154.06%80.40%110.56%50.25%50.25%-190-9.59%1,981
Richmond County 1,39160.80%86437.76%80.35%110.48%110.48%30.13%52723.03%2,288
Roanoke County 13,58750.42%13,12048.69%250.09%1000.37%570.21%590.22%4671.73%26,948
Rockbridge County 2,15743.66%2,52551.11%1162.35%1002.02%310.63%110.22%-368-7.45%4,940
Rockingham County 9,76861.87%5,34933.88%1951.24%3442.18%770.49%560.35%4,41927.99%15,789
Russell County 4,28740.19%6,01456.38%1851.73%1241.16%480.45%90.08%-1,727-16.19%10,667
Scott County 4,31345.43%4,49647.36%3193.36%2792.94%740.78%130.14%-183-1.93%9,494
Shenandoah County 6,29664.05%3,36434.22%270.27%620.63%540.55%270.27%2,93229.83%9,830
Smyth County 5,03247.29%5,24649.30%1441.35%1641.54%390.37%160.15%-214-2.01%10,641
Southampton County 2,36640.18%3,39957.72%170.29%330.56%611.04%130.22%-1,033-17.54%5,889
Spotsylvania County 3,21042.46%4,21055.69%160.21%380.50%730.97%130.17%-1,000-13.23%7,560
Stafford County 4,45146.84%4,90051.57%190.20%540.57%550.58%230.24%-449-4.73%9,502
Surry County 92932.79%1,82964.56%260.92%140.49%190.67%160.56%-900-31.77%2,833
Sussex County 1,36033.22%2,49760.99%1122.74%731.78%451.10%70.17%-1,137-27.77%4,094
Tazewell County 5,56541.41%7,56556.29%940.70%1050.78%920.68%180.13%-2,000-14.88%13,439
Warren County 2,98545.80%3,22149.42%1392.13%1091.67%450.69%180.28%-236-3.62%6,517
Washington County 6,86548.98%6,54746.71%2872.05%1991.42%950.68%220.16%3182.27%14,015
Westmoreland County 1,90941.79%2,35551.55%1523.33%1112.43%320.70%90.20%-446-9.76%4,568
Wise County 5,69142.63%7,13453.43%2331.75%1811.36%900.67%220.16%-1,443-10.81%13,351
Wythe County 4,23151.34%3,57843.42%1852.24%1591.93%790.96%90.11%6537.92%8,241
York County 5,60353.61%4,73645.32%160.15%370.35%330.32%260.25%8678.30%10,451
Alexandria City 16,88044.53%19,85852.38%5681.50%3710.98%1090.29%1240.33%-2,978-7.86%37,910
Bedford City 1,04345.47%1,12248.91%672.92%512.22%60.26%50.22%-79-3.44%2,294
Bristol City 2,94346.27%3,34352.55%100.16%230.36%250.39%170.27%-400-6.29%6,361
Buena Vista City 77141.61%99353.59%613.22%532.80%130.69%30.16%-222-11.98%1,853
Charlottesville City 6,67348.11%6,84649.36%1100.79%1050.76%540.39%810.58%-173-1.25%13,869
Chesapeake City 12,85139.96%17,65154.89%8702.71%5761.79%1430.44%660.21%-4,800-14.93%32,157
Clifton Forge City 77040.68%99352.46%613.22%532.80%130.69%30.16%-223-11.78%1,893
Colonial Heights City 4,29161.88%2,40934.74%460.66%1331.92%390.56%160.23%1,88227.14%6,934
Covington City 1,17337.06%1,82057.50%1033.25%471.48%180.57%40.13%-647-20.44%3,165
Danville City 10,23559.46%6,42537.33%1981.15%2311.34%950.55%280.16%3,81022.14%17,212
Emporia City 1,05552.23%89944.50%130.64%130.64%301.49%100.50%1567.72%2,020
Fairfax City 4,17453.36%3,46444.28%680.87%841.07%90.12%240.31%7109.08%7,823
Falls Church City 2,32350.63%2,20247.99%90.20%270.59%90.20%180.39%1212.64%4,588
Franklin City 1,12749.21%1,11648.73%70.31%100.44%190.83%110.48%110.48%2,290
Fredericksburg City 2,52749.07%2,55049.51%100.19%110.21%330.64%190.37%-23-0.45%5,150
Galax City 1,12847.59%1,21851.39%50.21%80.34%60.25%50.21%-90-3.80%2,370
Hampton City 15,02141.67%19,20253.27%1,0332.85%5831.61%1170.32%920.25%-4,001-11.60%36,048
Harrisonburg City 3,37663.01%1,80333.65%530.99%861.61%190.35%210.39%1,57329.36%5,358
Hopewell City 3,76448.21%3,69147.28%1792.29%991.27%530.68%210.27%730.94%7,807
Lexington City 1,02750.47%94546.44%321.57%221.08%40.20%50.25%824.03%2,035
Lynchburg City 14,56461.18%8,22734.56%4121.73%4551.91%940.39%520.22%6,33726.62%23,804
Manassas City 1,99253.30%1,64644.05%501.34%370.99%50.13%70.19%3469.26%3,737
Manassas Park City 44437.34%70959.63%70.59%191.60%100.84%00.00%-265-22.29%1,189
Martinsville City 3,14745.38%3,49150.34%1442.08%1011.46%340.49%180.26%-344-4.96%6,935
Newport News City 20,91447.01%23,05851.83%760.17%1730.39%1860.42%850.19%-2,144-4.82%44,492
Norfolk City 28,09939.91%39,29555.82%1,5432.19%9861.40%3080.44%1710.24%-11,196-15.90%70,402
Norton City 57740.35%81156.71%171.19%140.98%60.42%50.35%-234-16.36%1,430
Petersburg City 5,04138.53%7,85260.02%310.24%590.45%700.54%290.22%-2,811-21.49%13,082
Poquoson City 1,46155.34%1,14043.18%50.19%140.53%130.49%70.27%32112.16%2,640
Portsmouth City 12,87235.51%22,83763.01%800.22%1690.47%2160.60%720.20%-9,965-27.49%36,246
Radford City 1,84444.74%2,24054.34%120.29%60.15%140.34%60.15%-396-9.61%4,122
Richmond City 37,17644.73%44,68753.77%2530.30%2550.31%4300.52%3090.37%-7,511-9.04%83,110
Roanoke City 14,73841.00%20,69657.57%1410.39%1620.45%1370.38%750.21%-5,958-16.57%35,949
Salem City 4,19648.29%4,40450.68%110.13%470.54%190.22%130.15%-208-2.39%8,690
South Boston City 1,38956.97%1,00141.06%40.16%100.41%220.90%120.49%38815.91%2,438
Staunton City 4,68159.53%2,95137.53%891.13%951.21%280.36%190.24%1,73022.00%7,863
Suffolk City 6,06638.86%9,24659.24%490.31%680.44%1470.94%330.21%-3,180-20.37%15,609
Virginia Beach City 34,59354.46%25,82440.66%1,6072.53%1,1431.80%1750.28%1760.28%8,76913.81%63,518
Waynesboro City 3,52859.64%2,20937.35%751.27%801.35%140.24%90.15%1,31922.30%5,915
Williamsburg City 1,65451.77%1,46845.95%200.63%270.85%70.22%190.59%1865.82%3,195
Winchester City 4,07562.85%2,34636.18%90.14%280.43%170.26%90.14%1,72926.67%6,484
Totals836,55449.29%813,89647.96%17,8021.05%16,6860.98%7,5080.44%4,6480.27%22,6581.34%1,697,094

Results by congressional district

Ford won 6 of 10 congressional districts. Ford won four districts held by Democrats, whilst three of Carter's four districts were held by Republicans, and another was gained by a Republican after the incumbent Democrat retired. [20]

DistrictFordCarterRepresentative
1st 47%50% Thomas N. Downing
Paul Trible
2nd 47%49% G. William Whitehurst
3rd 56%42% David E. Satterfield III
4th 40%57% Robert Daniel
5th 51%46% Dan Daniel
6th 49%48% M. Caldwell Butler
7th 54%44% J. Kenneth Robinson
8th 51%47% Herbert Harris
9th 45%51% William C. Wampler Jr.
10th 51%47% Joseph L. Fisher

Related Research Articles

<span class="mw-page-title-main">1976 United States presidential election</span> 48th quadrennial U.S. presidential election

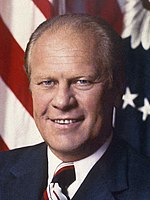
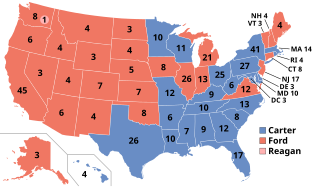
The 1976 United States presidential election was the 48th quadrennial presidential election, held on Tuesday, November 2, 1976. Democrat Jimmy Carter, former Governor of Georgia, defeated incumbent Republican president Gerald Ford in a narrow victory. This was the first presidential election since 1932 in which the incumbent was defeated, as well as the only Democratic victory of the six presidential elections between 1968 and 1988.

<span class="mw-page-title-main">1976 United States presidential election in North Carolina</span>

The 1976 United States presidential election in North Carolina took place on November 2, 1976, and was part of the 1976 United States presidential election. Voters chose 13 representatives, or electors to the Electoral College, who voted for president and vice president.

<span class="mw-page-title-main">1960 United States presidential election in Virginia</span> Election in Virginia

The 1960 United States presidential election in Virginia took place on November 8, 1960. Voters chose 12 representatives, or electors to the Electoral College, who voted for president and vice president.

<span class="mw-page-title-main">1976 United States presidential election in Alabama</span> Election in Alabama

The 1976 United States presidential election in Alabama took place on November 2, 1976, as part of the 1976 presidential election. Voters chose nine representatives, or electors, to the Electoral College, who voted for president and vice president.

<span class="mw-page-title-main">1988 United States presidential election in Virginia</span> Election in Virginia

The 1988 United States presidential election in Virginia took place on November 8, 1988. All 50 states and the District of Columbia, were part of the 1988 United States presidential election. Virginia voters chose 12 electors to the Electoral College, which selected the president and vice president.

<span class="mw-page-title-main">1984 United States presidential election in Virginia</span> Election in Virginia

The 1984 United States presidential election in Virginia took place on November 6, 1984. All 50 states and the District of Columbia, were part of the 1984 United States presidential election. Virginia voters chose 12 electors to the Electoral College, which selected the president and vice president of the United States.

<span class="mw-page-title-main">1980 United States presidential election in Virginia</span> Election in Virginia

The 1980 United States presidential election in Virginia took place on November 4, 1980. All 50 states and the District of Columbia, were part of the 1980 United States presidential election. Virginia voters chose twelve electors to the Electoral College, which selected the president and vice president of the United States.

<span class="mw-page-title-main">1972 United States presidential election in Virginia</span> Election in Virginia

The 1972 United States presidential election in Virginia took place on November 7, 1972. All 50 states and the District of Columbia were part of the 1972 United States presidential election. Virginia voters chose 12 electors to the Electoral College, which selected the president and vice president of the United States. This was also the first presidential election after the passage of the Twenty-sixth Amendment, which decreased the voting age from 21 to 18.

<span class="mw-page-title-main">1964 United States presidential election in Virginia</span> Election in Virginia

The 1964 United States presidential election in Virginia took place on November 3, 1964. All 50 states and the District of Columbia were part of the 1964 United States presidential election. Virginia voters chose 12 electors to the Electoral College, which selected the president and vice president of the United States.

<span class="mw-page-title-main">1956 United States presidential election in Virginia</span> Election in Virginia

The 1956 United States presidential election in Virginia took place on November 6, 1956. Voters chose twelve representatives, or electors to the Electoral College, who voted for president and vice president. For the previous five decades Virginia had almost completely disenfranchised its black and poor white populations through the use of a cumulative poll tax and literacy tests. So restricted was suffrage in this period that it has been calculated that a third of Virginia’s electorate during the first half of the twentieth century comprised state employees and officeholders.

<span class="mw-page-title-main">1952 United States presidential election in Virginia</span> Election in Virginia

The 1952 United States presidential election in Virginia took place on November 4, 1952. Voters chose twelve representatives, or electors to the Electoral College, who voted for president and vice president.

<span class="mw-page-title-main">1948 United States presidential election in Virginia</span> Election in Virginia

The 1948 United States presidential election in Virginia took place on November 2, 1948, throughout the 48 contiguous states. Voters chose 11 representatives, or electors to the Electoral College, who voted for president and vice president.

<span class="mw-page-title-main">1980 United States presidential election in Mississippi</span> Election in Mississippi

The 1980 United States presidential election in Mississippi took place on November 4, 1980. All fifty states and The District of Columbia were part of the 1980 United States presidential election. Mississippi voters chose seven electors to the Electoral College, who voted for president and vice president.

<span class="mw-page-title-main">1976 United States presidential election in Illinois</span>

The 1976 United States presidential election in Illinois was held on November 2, 1976. All 50 states and The District of Columbia, were part of the 1976 United States presidential election. State voters chose 26 electors to the Electoral College, who voted for president and vice president.

<span class="mw-page-title-main">1968 United States presidential election in Texas</span> Election in Texas

The 1968 United States presidential election in Texas was held on November 5, 1968. All 50 states and the District of Columbia, were part of the 1968 United States presidential election. The state chose 25 electors to represent them in the Electoral College, who voted for president and vice president.

<span class="mw-page-title-main">1976 United States presidential election in Georgia</span> Election in Georgia

The 1976 United States presidential election in Georgia was held on November 2, 1976. The Democratic candidate, former Governor of Georgia Jimmy Carter, overwhelmingly won his home state with 66.74% of the vote ahead of the Republican Party candidate, incumbent President Gerald Ford, giving him the state’s 12 electoral votes. Carter carried all of Georgia’s 159 counties and 10 congressional districts by wide margins.

<span class="mw-page-title-main">1976 United States presidential election in Tennessee</span> Election in Tennessee

The 1976 United States presidential election in Tennessee was held on November 2, 1976. The Democratic Party candidate, former Georgia governor Jimmy Carter won the state of Tennessee with 56% of the vote against Republican Party candidate, President Gerald Ford, carrying the state's 10 electoral votes. This was the last time a Democratic presidential candidate won more than 50% of the vote in Tennessee or carried the state by a double-digit margin.

<span class="mw-page-title-main">1976 United States presidential election in South Carolina</span> Election in South Carolina

The 1976 United States presidential election in South Carolina took place on November 2, 1976. All 50 states and the District of Columbia were part of the 1976 United States presidential election. South Carolina voters chose eight electors to the Electoral College, who voted for president and vice president.

<span class="mw-page-title-main">1976 United States presidential election in Nevada</span> Election in Nevada

The 1976 United States presidential election in Nevada took place on November 2, 1976, as part of the 1976 United States presidential election. Voters chose three representatives, or electors, to the Electoral College, who voted for president and vice president.

<span class="mw-page-title-main">1948 United States presidential election in Arkansas</span> Election in Arkansas

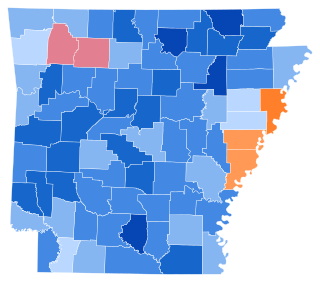
The 1948 United States presidential election in Arkansas took place on November 2, 1948, as part of the 1948 United States presidential election. State voters chose nine representatives, or electors, to the Electoral College, who voted for president and vice president. This would be the last presidential election where Arkansas had nine electoral votes: the Great Migration would see the state lose three congressional districts in the next decade-and-a-half.

References

  1. Heinemann, Ronald L. (2008). Old Dominion, New Commonwealth: A History of Virginia, 1607-2007. Charlottesville: University of Virginia Press. p. 357. ISBN   0813927692.
  2. Phillips, Kevin P. (1969). The Emerging Republican Majority. pp. 260–266. ISBN   0870000586.
  3. Atkinson, Frank B. (2006). The Dynamic Dominion: Realignment and the Rise of Two-party Competition in Virginia, 1945-1980. Rowman & Littlefield. ISBN   9780742552098.
  4. Bass, Jack; De Vries, Walter (1995). The Transformation of Southern Politics: Social Change and Political Consequence Since 1945. pp. 347–353.
  5. Evans, Rowland; Novak, Robert (October 16, 1972). "Consider Virginia: McGovern, Nixon Creating a No-Party System in South". The Miami Herald . pp. 7-A.
  6. Bass; De Vries. The Transformation of Southern Politics, p. 360
  7. Sullivan, Robert David; ‘How the Red and Blue Map Evolved Over the Past Century’; America Magazine in The National Catholic Review; June 29, 2016
  8. 1 2 "Scene of Final Debate: In Virginia, Ford and Carter Even". The Sentinel . Carlisle, Pennsylvania. October 18, 1976. p. 5.
  9. Black & Black 1992, p. 295.
  10. Black & Black 1992, p. 335.
  11. Black & Black 1992, p. 334.
  12. Lambert, Robert (October 16, 1976). "Opinion Divided on Result of Old Dominion Balloting". Simpson's Leader-Times. Kittanning, Pennsylvania. p. 4.
  13. "Ford Pads Lead in Virginia Poll". Daily Press. Newport News, Virginia. October 24, 1976. p. 1.
  14. Lastelic, Joseph A. (October 26, 1976). "Mid-South Favours Carter". Kansas City Times . Kansas City, Missouri. p. 10.
  15. "Convention Wounds Remain". Daily News . New York City. October 27, 1976. p. C 23.
  16. "Electoral Votes: A Photo Finish — Polls". Austin American-Statesman . October 31, 1976. pp. A1, A6.
  17. Apple Jr., R.W. (November 1, 1976). "Presidential Race Called Very Close On Eve Of The Vote". The New York Times. ProQuest   122965968.
  18. "Statistics of the Presidential and Congressional Election of November 2, 1976" (PDF). Clerk of the House of Representatives. p. 49.
  19. "VA US President Race, November 02, 1976". Our Campaigns.
  20. Politics in America (Report). Congressional Quarterly, inc. 1981. pp. 1234–1251.

Works cited