1964 United States presidential election in Virginia

Last updated

1964 United States presidential election in Virginia
Flag of Virginia.svg
  1960 November 3, 1964 1968  
  37 Lyndon Johnson 3x4 (cropped).jpg Goldwater and Miller (cropped).jpg
Nominee Lyndon B. Johnson Barry Goldwater
Party Democratic Republican
Home state Texas Arizona
Running mate Hubert Humphrey William E. Miller
Electoral vote120
Popular vote558,038481,334
Percentage53.53%46.17%

Virginia Presidential Election Results 1964.svg
County and Independent City Results

President before election

Lyndon B. Johnson
Democratic

Elected President

Lyndon B. Johnson
Democratic

The 1964 United States presidential election in Virginia took place on November 3, 1964. All 50 states and the District of Columbia were part of the 1964 United States presidential election. Virginia voters chose 12 electors to the Electoral College, which selected the president and vice president of the United States.

Contents

For the previous six decades Virginia had almost completely disenfranchised its black and poor white populations through the use of a cumulative poll tax and literacy tests. [1] So restricted was suffrage in this period that it has been calculated that a third of Virginia’s electorate during the first half of the twentieth century comprised state employees and officeholders. [1]

This limited electorate allowed Virginian politics to be controlled for four decades by the Byrd Organization, as progressive “antiorganization” factions were rendered impotent by the inability of almost all their potential electorate to vote. [2] Historical fusion with the “Readjuster” Democrats, [3] defection of substantial proportions of the Northeast-aligned white electorate of the Shenandoah Valley and Southwest Virginia over free silver, [4] and an early move towards a “lily white” Jim Crow party [3] meant Republicans retained a small but permanent number of legislative seats and local offices in the western part of the state. [5]

In 1928, the GOP did carry the state’s presidential electoral votes due to anti-Catholicism against Al Smith, but it was 1952 before any real changes occurred, as in-migration from the traditionally Republican Northeast [6] meant that growing Washington, D.C., and Richmond suburbs would turn Republican not just in presidential elections but in Congressional ones as well, [7] although the Republicans would not make significant gains in the state legislature. Opposition to the black civil rights legislation of Harry S. Truman meant that the Byrd Organization did not support Adlai Stevenson II or John F. Kennedy. [8] Although the Organization viewed the national Republican party as no better on civil rights—it opposed the “massive resistance” orchestrated by Senator Byrd after Brown v. Board of Education —Byrd’s silence helped Eisenhower and Nixon win the state three consecutive times between 1952 and 1960.

For 1964, it was evident that Virginia’s electorate would be substantially increased by the Twenty-fourth Amendment, which banned the poll tax in federal elections and allowed major increases in voter registration during the preceding year. [9] Efforts by civil rights groups to register black voters would help black voter registration double vis-à-vis 1960. [10] At the same time, Republican nominee Arizona Senator Barry Goldwater voted against the Civil Rights Act and targeted the South as critical to winning the election against incumbent President Lyndon B. Johnson who signed that Act in August 1964, whilst most Byrd Democrats endorsed Johnson—this being the first time since 1936 the Organization had done so. [10]

Predictions

SourceRankingAs of
The Wall Street Journal [11] Likely RSeptember 29, 1964
Honolulu Advertiser [12] Lean D (flip)October 18, 1964
The Progress-Index [13] Tilt D (flip)October 25, 1964
The Chicago Tribune [14] TossupOctober 29, 1964
Fort Lauderdale News [15] Tilt RNovember 1, 1964
The Charlotte Observer [16] Lean D (flip)November 1, 1964
Los Angeles Times [17] TossupNovember 1, 1964

Results

1964 United States presidential election in Virginia [18]
PartyCandidateVotesPercentageElectoral votes
Democratic Lyndon B. Johnson (inc.)558,03853.53%12
Republican Barry Goldwater 481,33446.17%0
Socialist Labor Eric Hass 2,8950.28%0
American Nazi George Lincoln Rockwell (Write-in)2120.02%0
Totals1,042,479100.00%12

Results by county or independent city

1964 United States presidential election in Virginia by counties and independent cities [19]
Lyndon Baines Johnson
Democratic
Barry Morris Goldwater
Republican
Eric Hass
Socialist Labor
MarginTotal votes cast
# %# %# %# %
Accomack County 3,52852.79%3,14547.06%100.15%3835.73%6,683
Albemarle County 3,06248.49%3,25151.48%20.03%-189-2.99%6,315
Alleghany County 1,58058.85%1,10441.12%10.04%47617.73%2,685
Amelia County 88439.48%1,34860.21%70.31%-464-20.72%2,239
Amherst County 2,73050.46%2,67549.45%50.09%551.02%5,410
Appomattox County 1,33935.32%2,44464.47%80.21%-1,105-29.15%3,791
Arlington County 33,56761.75%20,48537.68%3110.57%13,08224.06%54,363
Augusta County 4,03948.24%4,32751.68%60.07%-288-3.44%8,372
Bath County 77059.88%51640.12%00.00%25419.75%1,286
Bedford County 4,07651.50%3,80648.09%320.40%2703.41%7,914
Bland County 85154.20%71745.67%20.13%1348.54%1,570
Botetourt County 2,37753.11%2,09846.87%10.02%2796.23%4,476
Brunswick County 1,88342.35%2,56057.58%30.07%-677-15.23%4,446
Buchanan County 4,75666.76%2,34932.97%190.27%2,40733.79%7,124
Buckingham County 1,18243.25%1,54756.60%40.15%-365-13.36%2,733
Campbell County 3,40137.19%5,71362.47%310.34%-2,312-25.28%9,145
Caroline County 2,06463.64%1,16635.95%130.40%89827.69%3,243
Carroll County 2,51740.95%3,61758.85%120.20%-1,100-17.90%6,146
Charles City County 1,02375.89%32323.96%20.15%70051.93%1,348
Charlotte County 1,19137.48%1,97462.11%130.41%-783-24.64%3,178
Chesterfield County 8,37632.38%17,48667.59%90.03%-9,110-35.21%25,871
Clarke County 1,13651.50%1,06848.41%20.09%683.08%2,206
Craig County 76761.66%47738.34%00.00%29023.31%1,244
Culpeper County 1,88651.46%1,77548.43%40.11%1113.03%3,665
Cumberland County 87144.06%1,09955.59%70.35%-228-11.53%1,977
Dickenson County 3,48561.80%2,14338.00%110.20%1,34223.80%5,639
Dinwiddie County 2,18250.92%2,09648.91%70.16%862.01%4,285
Essex County 76049.03%78950.90%10.06%-29-1.87%1,550
Fairfax County 48,68061.22%30,75538.68%820.10%17,92522.54%79,517
Fauquier County 3,50662.46%2,10137.43%60.11%1,40525.03%5,613
Floyd County 1,14438.32%1,83661.51%50.17%-692-23.18%2,985
Fluvanna County 1,00854.96%82344.87%30.16%18510.09%1,834
Franklin County 3,44760.08%2,27939.72%110.19%1,16820.36%5,737
Frederick County 2,88052.61%2,58547.22%90.16%2955.39%5,474
Giles County 3,13360.63%1,95237.78%821.59%1,18122.86%5,167
Gloucester County 1,94954.40%1,63145.52%30.08%3188.88%3,583
Goochland County 1,45253.84%1,24146.01%40.15%2117.82%2,697
Grayson County 3,23850.98%3,10548.88%90.14%1332.09%6,352
Greene County 46041.67%64158.06%30.27%-181-16.39%1,104
Greensville County 2,26250.06%2,24549.68%120.27%170.38%4,519
Halifax County 2,19835.77%3,92863.93%180.29%-1,730-28.16%6,144
Hanover County 2,86436.95%4,87962.95%80.10%-2,015-26.00%7,751
Henrico County 12,77930.37%29,28669.59%170.04%-16,507-39.23%42,082
Henry County 5,29564.70%2,84434.75%450.55%2,45129.95%8,184
Highland County 47648.13%51151.67%20.20%-35-3.54%989
Isle of Wight County 2,65660.38%1,73739.49%60.14%91920.89%4,399
James City County 1,74461.43%1,09238.46%30.11%65222.97%2,839
King and Queen County 78652.79%69946.94%40.27%875.84%1,489
King George County 1,08562.75%64437.25%00.00%44125.51%1,729
King William County 90445.77%1,06553.92%60.30%-161-8.15%1,975
Lancaster County 1,24542.77%1,66357.13%30.10%-418-14.36%2,911
Lee County 5,15159.71%3,46340.15%120.14%1,68819.57%8,626
Loudoun County 4,27862.21%2,59437.72%50.07%1,68424.49%6,877
Louisa County 1,73155.78%1,36944.12%30.10%36211.67%3,103
Lunenburg County 1,12837.89%1,84762.04%20.07%-719-24.15%2,977
Madison County 86244.83%1,06055.12%10.05%-198-10.30%1,923
Mathews County 1,13749.74%1,14950.26%00.00%-12-0.52%2,286
Mecklenburg County 3,23839.36%4,97660.48%130.16%-1,738-21.13%8,227
Middlesex County 97348.77%1,01951.08%30.15%-46-2.31%1,995
Montgomery County 3,87245.61%4,60454.23%130.15%-732-8.62%8,489
Nansemond County 4,80464.79%2,59034.93%210.28%2,21429.86%7,415
Nelson County 1,63564.52%89335.24%60.24%74229.28%2,534
New Kent County 68450.11%67749.60%40.29%70.51%1,365
Northampton County 1,51648.86%1,58651.11%10.03%-70-2.26%3,103
Northumberland County 98840.86%1,42358.85%70.29%-435-17.99%2,418
Nottoway County 2,13847.52%2,35352.30%80.18%-215-4.78%4,499
Orange County 1,50848.54%1,59551.34%40.13%-87-2.80%3,107
Page County 2,60648.09%2,80451.74%90.17%-198-3.65%5,419
Patrick County 2,30661.07%1,46838.88%20.05%83822.19%3,776
Pittsylvania County 5,22842.25%7,12057.54%250.20%-1,892-15.29%12,373
Powhatan County 96945.03%1,18254.93%10.05%-213-9.90%2,152
Prince Edward County 1,51237.20%2,54562.62%70.17%-1,033-25.42%4,064
Prince George County 1,50245.58%1,79054.32%30.09%-288-8.74%3,295
Prince William County 5,61162.60%3,34337.30%90.10%2,26825.30%8,963
Pulaski County 3,62053.82%3,10146.10%50.07%5197.72%6,726
Rappahannock County 67559.89%44939.84%30.27%22620.05%1,127
Richmond County 63641.30%90158.51%30.19%-265-17.21%1,540
Roanoke County 8,80845.09%10,71454.84%140.07%-1,906-9.76%19,536
Rockbridge County 2,59954.08%2,20045.78%70.15%3998.30%4,806
Rockingham County 4,20550.28%4,15549.68%30.04%500.60%8,363
Russell County 4,33058.78%3,01240.89%250.34%1,31817.89%7,367
Scott County 4,72050.92%4,53348.90%160.17%1872.02%9,269
Shenandoah County 3,18444.42%3,98155.54%30.04%-797-11.12%7,168
Smyth County 4,11351.72%3,83048.16%90.11%2833.56%7,952
Southampton County 2,56662.74%1,52037.16%40.10%1,04625.57%4,090
Spotsylvania County 2,09762.28%1,26137.45%90.27%83624.83%3,367
Stafford County 2,46956.58%1,88843.26%70.16%58113.31%4,364
Surry County 1,13152.85%1,00446.92%50.23%1275.93%2,140
Sussex County 1,23444.47%1,53755.39%40.14%-303-10.92%2,775
Tazewell County 6,08164.57%3,23134.31%1051.12%2,85030.26%9,417
Warren County 2,49456.81%1,88642.96%100.23%60813.85%4,390
Washington County 5,07054.95%4,14644.94%100.11%92410.02%9,226
Westmoreland County 1,31252.50%1,18147.26%60.24%1315.24%2,499
Wise County 7,22068.51%3,30931.40%100.09%3,91137.11%10,539
Wythe County 2,87949.10%2,95850.45%260.44%-79-1.35%5,863
York County 3,38552.98%2,99246.83%120.19%3936.15%6,389
Alexandria City 16,82865.52%8,82534.36%300.12%8,00331.16%25,683
Bristol City 2,42965.24%1,28934.62%50.13%1,14030.62%3,723
Buena Vista City 69159.93%45939.81%30.26%23220.12%1,153
Charlottesville City 5,20553.64%4,41545.50%840.87%7908.14%9,704
Chesapeake City 9,53251.19%9,03848.54%510.27%4942.65%18,621
Clifton Forge City 1,25259.56%85040.44%00.00%40219.12%2,102
Colonial Heights City 1,19833.09%2,42066.85%20.06%-1,222-33.76%3,620
Covington City 2,05564.10%1,14935.84%20.06%90628.26%3,206
Danville City 4,53935.67%7,90062.09%2852.24%-3,361-26.41%12,724
Fairfax City 2,83559.48%1,92440.37%70.15%91119.11%4,766
Falls Church City 2,37163.96%1,32935.85%70.19%1,04228.11%3,707
Franklin City 1,25761.59%78338.36%10.05%47423.22%2,041
Fredericksburg City 2,41061.35%1,51138.47%70.18%89922.89%3,928
Galax City 71750.64%69749.22%20.14%201.41%1,416
Hampton City 13,54260.76%8,73139.17%150.07%4,81121.59%22,288
Harrisonburg City 1,76549.16%1,82050.70%50.14%-55-1.53%3,590
Hopewell City 2,49843.89%3,18355.93%100.18%-685-12.04%5,691
Lynchburg City 6,75840.14%10,04459.66%320.19%-3,286-19.52%16,834
Martinsville City 2,94361.01%1,80537.42%761.58%1,13823.59%4,824
Newport News City 15,29659.07%10,58440.87%140.05%4,71218.20%25,894
Norfolk City 32,38862.83%18,42935.75%7291.41%13,95927.08%51,546
Norton City 82468.90%37231.10%00.00%45237.79%1,196
Petersburg City 4,52158.15%3,25341.84%10.01%1,26816.31%7,775
Portsmouth City 16,07365.49%8,42034.31%510.21%7,65331.18%24,544
Radford City 1,85055.09%1,50544.82%30.09%34510.27%3,358
Richmond City 35,66256.71%27,19643.24%320.05%8,46613.46%62,890
Roanoke City 15,31453.74%13,16446.20%180.06%2,1507.54%28,496
South Boston City 63634.51%1,20665.44%10.05%-570-30.93%1,843
Staunton City 2,70547.62%2,96952.27%60.11%-264-4.65%5,680
Suffolk City 1,57951.87%1,46348.06%20.07%1163.81%3,044
Virginia Beach City 12,89255.00%10,52944.92%210.09%2,36310.08%23,442
Waynesboro City 2,36952.28%2,10746.50%551.21%2625.78%4,531
Williamsburg City 1,17155.95%90643.29%160.76%26512.66%2,093
Winchester City 2,25450.80%2,18049.13%30.07%741.67%4,437
Totals558,03853.54%481,33446.18%2,8950.28%76,7047.36%1,042,267

Analysis

Virginia would be won by Johnson with 53.54 percent of the vote, making this the first time since 1948 that Virginia backed a Democratic presidential candidate. Johnson won the national election in a landslide with 61.05 percent of the vote, which actually made Virginia Goldwater’s tenth-best state nationally, 15.22 percentage points more Republican than the nation at large. The state would not vote for another Democratic candidate until Barack Obama won the state in 2008. Johnson’s victory saw major changes in Virginia voting patterns compared to previous presidential elections. Despite the state shifting from Richard Nixon to Johnson, nine counties in the Southside region, which had been the stronghold of the Byrd Organization, would shift from Kennedy to Goldwater due to opposition to Johnson’s civil rights proposals by an almost exclusively white electorate. [20] In Charlotte County, Johnson lost 29 points from John F. Kennedy’s 1960 vote percentage. [19] At the same time, the Shenandoah Valley, where pietistic Protestant sects supportive of civil rights were influential, [9] alongside the heavily unionized southwestern coalfields and Northeastern-aligned Northern Virginia, would see a strong swing towards Johnson, aided by growth in poor white voter registration from the Twenty-Fourth Amendment. [10] Despite this, a majority of white Virginians undoubtedly backed Goldwater, [21] and a doubling of a black presidential vote that almost unanimously supported Johnson was critical for his win. [10] Goldwater became the first Republican to win Pittsylvania County since 1928, Mecklenburg County and Brunswick County since 1900, Appomattox County since 1888, Lunenburg County since 1884, Charlotte County since 1880, Sussex County since 1892, and Halifax County since 1876. [20]

As of the 2020 presidential election , this remains the last occasion when Amherst County, Bland County, Clarke County, Culpeper County, Fauquier County, Frederick County, Rockingham County, Washington County and York County have voted for a Democratic presidential candidate. [22] It is also the only time since 1948 Waynesboro City has voted for a Democrat for president, while Prince William County and Winchester City would not vote Democratic again until 2008. [20] Fairfax County, Virginia's most populous county, would not vote Democratic again until 2004, having previously voted Democratic in 1940. [20] The independent city of Virginia Beach would not vote Democratic again until 2020. This also remains the last time that Virginia and neighboring West Virginia would simultaneously vote Democratic in a presidential election.

Related Research Articles

<span class="mw-page-title-main">1964 United States presidential election</span> 45th quadrennial U.S. presidential election

The 1964 United States presidential election was the 45th quadrennial presidential election. It was held on Tuesday, November 3, 1964. Incumbent Democratic President Lyndon B. Johnson defeated Republican Senator Barry Goldwater in a landslide victory. Johnson was the fourth and most recent vice president to succeed the presidency following the death of his predecessor and win a full term in his own right. Johnson won the largest share of the popular vote for the Democratic Party in history, 61.1%, and the highest for any candidate since the advent of widespread popular elections in 1824.

<span class="mw-page-title-main">Southern strategy</span> 20th century Republican electoral strategy for the Southern US

In American politics, the Southern strategy was a Republican Party electoral strategy to increase political support among white voters in the South by appealing to racism against African Americans. As the civil rights movement and dismantling of Jim Crow laws in the 1950s and 1960s visibly deepened existing racial tensions in much of the Southern United States, Republican politicians such as presidential candidate Richard Nixon and Senator Barry Goldwater developed strategies that successfully contributed to the political realignment of many white, conservative voters in the South who had traditionally supported the Democratic Party. It also helped to push the Republican Party much more to the right relative to the 1950s. By winning all of the South a presidential candidate could obtain the presidency with minimal support elsewhere.

<span class="mw-page-title-main">Solid South</span> 1877–1964 U.S. Democratic voting bloc

The Solid South or the Southern bloc was the electoral voting bloc of the states of the Southern United States for issues that were regarded as particularly important to the interests of Democrats in those states. The Southern bloc existed between the end of the Reconstruction era in 1877 and the passage of the Civil Rights Act of 1964. During this period, the Democratic Party overwhelmingly controlled southern state legislatures, and most local, state and federal officeholders in the South were Democrats. During the late 1800s and early 1900s, Southern Democrats disenfranchised blacks in all Southern states, along with a few non-Southern states doing the same as well. This resulted essentially in a one-party system, in which a candidate's victory in Democratic primary elections was tantamount to election to the office itself. White primaries were another means that the Democrats used to consolidate their political power, excluding blacks from voting in primaries.

<span class="mw-page-title-main">Byrd machine</span> Political machine headed by Harry F. Byrd (1887–1966)

The Byrd machine, or Byrd organization, was a political machine of the Democratic Party led by former Governor and U.S. Senator Harry F. Byrd (1887–1966) that dominated Virginia politics for much of the 20th century. From the 1890s until the late 1960s, the Byrd organization effectively controlled the politics of the state through a network of courthouse cliques of local constitutional officers in most of the state's counties.

<span class="mw-page-title-main">Politics of the Southern United States</span>

The politics of the Southern United States generally refers to the political landscape of the Southern United States. The institution of slavery had a profound impact on the politics of the Southern United States, causing the American Civil War and continued subjugation of African-Americans from the Reconstruction era to the Civil Rights Act of 1964. Scholars have linked slavery to contemporary political attitudes, including racial resentment. From the Reconstruction era to the Civil Rights Act of 1964, pockets of the Southern United States were characterized as being "authoritarian enclaves".

<span class="mw-page-title-main">1964 United States presidential election in Alabama</span> Election in Alabama

The 1964 United States presidential election in Alabama was held on November 3, 1964. Alabama voters chose ten representatives, or electors, to the Electoral College, who voted for President and Vice-President. In Alabama, voters voted for electors individually instead of as a slate, as in the other states.

<span class="mw-page-title-main">1964 United States presidential election in Georgia</span> Election in Georgia

The 1964 United States presidential election in Georgia took place on November 3, 1964, as part of the 1964 United States presidential election, which was held on that day throughout all 50 states and The District of Columbia. Voters chose 12 representatives, or electors to the Electoral College, who voted for president and vice president.

<span class="mw-page-title-main">1960 United States presidential election in Virginia</span> Election in Virginia

The 1960 United States presidential election in Virginia took place on November 8, 1960. Voters chose 12 representatives, or electors to the Electoral College, who voted for president and vice president.

<span class="mw-page-title-main">1972 United States presidential election in Virginia</span> Election in Virginia

The 1972 United States presidential election in Virginia took place on November 7, 1972. All 50 states and the District of Columbia were part of the 1972 United States presidential election. Virginia voters chose 12 electors to the Electoral College, which selected the president and vice president of the United States. This was also the first presidential election after the passage of the Twenty-sixth Amendment, which decreased the voting age from 21 to 18.

<span class="mw-page-title-main">1968 United States presidential election in Virginia</span> Election in Virginia

The 1968 United States presidential election in Virginia took place on November 5, 1968. All 50 states and the District of Columbia were part of the 1968 United States presidential election. Virginia voters chose twelve electors to the Electoral College, which selected the president and vice president of the United States.

<span class="mw-page-title-main">1952 United States presidential election in Virginia</span> Election in Virginia

The 1952 United States presidential election in Virginia took place on November 4, 1952. Voters chose twelve representatives, or electors to the Electoral College, who voted for president and vice president.

<span class="mw-page-title-main">1948 United States presidential election in Virginia</span> Election in Virginia

The 1948 United States presidential election in Virginia took place on November 2, 1948, throughout the 48 contiguous states. Voters chose 11 representatives, or electors to the Electoral College, who voted for president and vice president.

<span class="mw-page-title-main">1932 United States presidential election in Virginia</span> Election in Virginia

The 1932 United States presidential election in Virginia took place on November 8, 1932. Voters chose eleven representatives, or electors to the Electoral College, who voted for president and vice president.

<span class="mw-page-title-main">1964 United States presidential election in Mississippi</span> Election in Mississippi

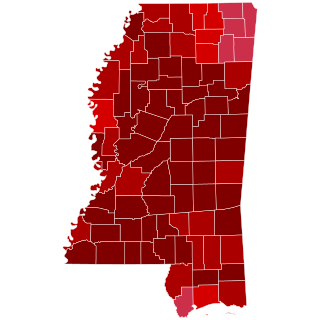
The 1964 United States presidential election in Mississippi was held on November 3, 1964, as part of the 1964 United States presidential election, which was held on that day throughout all fifty states and the District of Columbia. Voters chose seven electors, or representatives to the Electoral College, who voted for president and vice president.

<span class="mw-page-title-main">1964 United States presidential election in Arkansas</span> Election in Arkansas

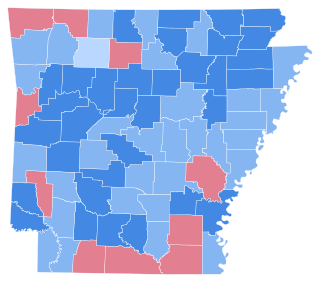
The 1964 presidential election in Arkansas was held on November 3, 1964 as part of the 1964 United States presidential election. State voters chose six electors, or representatives to the Electoral College, who voted for president and vice president. Incumbent President Lyndon B. Johnson won the state of Arkansas with 56.06% of the popular vote, which was a substantial increase upon John F. Kennedy's 50.19% from the preceding election, although the Republican vote remained virtually unchanged at 43.41%. Johnson won all but ten of Arkansas' seventy-five counties, and all four congressional districts. As of the 2020 presidential election, this is the last election in which Arkansas voted for a different candidate than neighboring Louisiana. Furthermore, with Mississippi, Alabama, Georgia, and South Carolina voting for Goldwater, Arkansas became the last Southern state to have never voted for a Republican candidate since the end of Reconstruction.

<span class="mw-page-title-main">1968 United States presidential election in Mississippi</span> Election in Mississippi

The 1968 United States presidential election in Mississippi was held on November 5, 1968. Mississippi voters chose seven electors, or representatives to the Electoral College, who voted for President and Vice-President. During the 1960s, the Civil Rights Movement dictated Mississippi's politics, with effectively the entire white population vehemently opposed to federal policies of racial desegregation and black voting rights. In 1960, the state had been narrowly captured by a slate of unpledged Democratic electors, but in 1964 universal white opposition to the Civil Rights Act and negligible black voter registration meant that white Mississippians turned almost unanimously to Republican Barry Goldwater. Goldwater's support for "constitutional government and local self-rule" meant that the absence from the ballot of "states' rights" parties or unpledged electors was unimportant. The Arizona Senator was one of only six Republicans to vote against the Civil Rights Act, and so the small electorate of Mississippi supported him almost unanimously.

<span class="mw-page-title-main">1956 United States presidential election in Mississippi</span> Election in Mississippi

The 1956 United States presidential election in Mississippi was held on November 6, 1956. Mississippi voters chose eight representatives, or electors to the Electoral College, who voted for president and vice president.

<span class="mw-page-title-main">1964 United States presidential election in South Carolina</span> Election in South Carolina

The 1964 United States presidential election in South Carolina took place on November 3, 1964, as part of the 1964 United States presidential election. South Carolina voters chose 8 representatives, or electors, to the Electoral College, who voted for president and vice president.

<span class="mw-page-title-main">1964 United States presidential election in Maine</span> Election in Maine

The 1964 United States presidential election in Maine took place on November 3, 1964, as part of the 1964 United States presidential election, which was held throughout all fifty states and D.C. Voters chose four representatives, or electors to the Electoral College, who voted for president and vice president.

<span class="mw-page-title-main">1964 United States presidential election in West Virginia</span> Election in West Virginia

The 1964 United States presidential election in West Virginia took place on November 3, 1964, as part of the 1964 United States presidential election. West Virginia voters chose seven representatives, or electors, to the Electoral College, who voted for president and vice president.

References

  1. 1 2 Kousser, J. Morgan. The Shaping of Southern Politics: Suffrage Restriction and the Establishment of the One-Party South, 1880-1910. Yale University Press. pp. 178–181. ISBN   0-300-01696-4.
  2. Key, Valdimer Orlando (1949). Southern Politics in State and Nation. pp. 20–25.
  3. 1 2 Heersink, Boris; Jenkins, Jeffrey A. Republican Party Politics and the American South, 1865-1968. pp. 217–221. ISBN   1107158435.
  4. Moger, Allen. "The Rift in Virginia Democracy in 1896". The Journal of Southern History . 4 (3): 295–317.
  5. Phillips, Kevin P.; The Emerging Republican Majority, pp. 210, 242 ISBN   978-0-691-16324-6
  6. Heinemann, Ronald L. (2008). Old Dominion, New Commonwealth: A History of Virginia, 1607-2007. Charlottesville: University of Virginia Press. p. 357. ISBN   0813927692.
  7. Atkinson, Frank B. (2006). The Dynamic Dominion: Realignment and the Rise of Two-party Competition in Virginia, 1945-1980. Rowman & Littlefield. ISBN   9780742552098.
  8. Ely, James W. (1976). The Crisis of Conservative Virginia: the Byrd Organization and the Politics of Massive Resistance. Knoxville, Tennessee: University of Tennessee Press. p. 16. ISBN   0870491881.
  9. 1 2 Sweeney, James R. (1994). "A New Day in the Old Dominion". Virginia Magazine of History and Biography. 102 (3): 307–348.
  10. 1 2 3 4 Davidson, Chandler; Grofman, Bernard (1994). Quiet revolution in the South: the impact of the Voting rights act, 1965-1990. pp. 275–276. ISBN   0691032475.
  11. Sullivan, Joseph W. (September 19, 1964). "The GOP in Dixie: Civil Rights Stand Gives Goldwater a Wide Lead In Most of the South Survey Finds Senator Ahead Everywhere but in Texas; Other Republicans Benefit But Margin Has Narrowed". The Wall Street Journal . p. 1.
  12. Carpenter, Leslie (October 18, 1964). "Somebody's Going To Be Jobless — "What Next" Is Question for the Losing Candidate". The Sunday Star-Bulletin and Advertiser . Honolulu. p. A16.
  13. Daffron, John F. (October 25, 1964). "State Return to Democrats Very Likely". The Progress-Index . Petersburg, Virginia. pp. 1, 6.
  14. Manly, Chely (October 29, 1964). "Johnson Gains in South but Dixie Is Still Strong for Barry: Goldwater Keeps Loyal Army of Backers". The Chicago Tribune . p. 5.
  15. "How Survey by United Press International Sees Presidential Race: State-by-State Outlooks for Elections Outcomes". Fort Lauderdale News. Fort Lauderdale, Florida. November 1, 1964. pp. C1.
  16. "A State-by-State Report on How All Major Races Look". The Charlotte Observer . November 1, 1964. pp. 18A.
  17. Kraslow, David (November 1, 1964). "How South Will Vote Remains Big Question: Goldwater "Fairly Safe" in Three States, Johnson in One, Rest Considered Toss-ups". Los Angeles Times . Los Angeles, California. p. 17.
  18. "Statistics of the Presidential and Congressional Election of November 3, 1964" (PDF). Clerk of the House of Representatives. p. 46.
  19. 1 2 "VA US President Race, November 03, 1964". Our Campaigns.
  20. 1 2 3 4 Menendez, Albert J. (2005). The Geography of Presidential Elections in the United States, 1868-2004. pp. 326–331. ISBN   0786422173.
  21. Black, Earl (2021). "Competing Responses to the New Southern Politics: Republican and Democratic Southern Strategies, 1964-76". In Reed, John Shelton; Black, Merle (eds.). Perspectives on the American South: An Annual Review of Society, Politics, and Culture. ISBN   9781136764882.
  22. Sullivan, Robert David; ‘How the Red and Blue Map Evolved Over the Past Century’; America Magazine in The National Catholic Review; June 29, 2016