| Demographics of England | |
|---|---|
 Population pyramid of England in 2021 | |
| Population | 56,489,800 |
| Density | 434/km2 (1,120/sq mi) [1] |
| Fertility rate | 1.61 (2021) |
| Age structure | |
| 0–14 years | 17.4% (2021) [2] |
| 15–64 years | 64.1% |
| 65 and over | 18.6% |
| Nationality | |
| Nationality | English (2021) |
| Major ethnic |
|
| Minor ethnic |
|
| Language | |
| Spoken | British English |


The demographics of England have been measured by the decennial national census since 1801, and are marked by centuries of population growth and urbanization. Due to the lack of authoritative contemporary sources, estimates of the population of England for dates prior to the first census in 1801 vary considerably. The population of England at the 2021 census was about 56,489,800. [4]
Contents
- Population
- Historical population
- Domesday Population
- Vital statistics
- Current vital statistics
- Historical per cent distribution of the total population by age
- Country of birth
- Age
- Ethnicity
- Population distribution
- Ethnicity of school pupils
- Languages
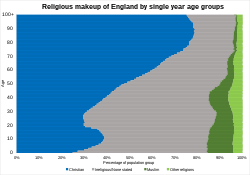
- Religion
- See also
- Notes
- References
- External links