Related Research Articles

In economics, the Gini coefficient, also known as the Gini index or Gini ratio, is a measure of statistical dispersion intended to represent the income inequality, the wealth inequality, or the consumption inequality within a nation or a social group. It was developed by Italian statistician and sociologist Corrado Gini.
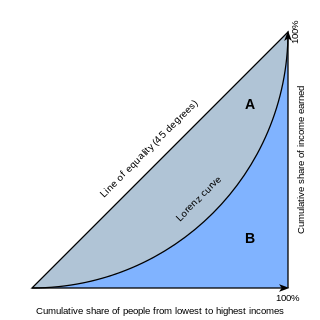
In economics, the Lorenz curve is a graphical representation of the distribution of income or of wealth. It was developed by Max O. Lorenz in 1905 for representing inequality of the wealth distribution.

The Pareto principle states that for many outcomes, roughly 80% of consequences come from 20% of causes. Other names for the principle are the 80/20 rule, the law of the vital few and the principle of factor sparsity.

Economic inequality is an umbrella term for a) income inequality or distribution of income, b) wealth inequality or distribution of wealth, and c) consumption inequality. Each of these can be measured between two or more nations, within a single nation, or between and within sub-populations.
In economics, income distribution covers how a country's total GDP is distributed amongst its population. Economic theory and economic policy have long seen income and its distribution as a central concern. Unequal distribution of income causes economic inequality which is a concern in almost all countries around the world.
Income inequality metrics or income distribution metrics are used by social scientists to measure the distribution of income and economic inequality among the participants in a particular economy, such as that of a specific country or of the world in general. While different theories may try to explain how income inequality comes about, income inequality metrics simply provide a system of measurement used to determine the dispersion of incomes. The concept of inequality is distinct from poverty and fairness.

The distribution of wealth is a comparison of the wealth of various members or groups in a society. It shows one aspect of economic inequality or economic heterogeneity.
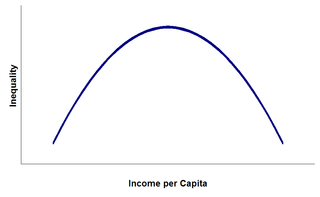
The Kuznets curve expresses a hypothesis advanced by economist Simon Kuznets in the 1950s and 1960s. According to this hypothesis, as an economy develops, market forces first increase and then decrease economic inequality. The Kuznets curve appeared to be consistent with experience at the time it was proposed. However, since the 1970s, inequality has risen in the US and other developed countries, which invalidates the hypothesis.

In the context of network theory, a complex network is a graph (network) with non-trivial topological features—features that do not occur in simple networks such as lattices or random graphs but often occur in networks representing real systems. The study of complex networks is a young and active area of scientific research inspired largely by empirical findings of real-world networks such as computer networks, biological networks, technological networks, brain networks, climate networks and social networks.
The Hoover index, also known as the Robin Hood index or the Schutz index, is a measure of income inequality. It is equal to the percentage of the total population's income that would have to be redistributed to make all the incomes equal.
In economics, personal income refers to the total earnings of an individual from various sources such as wages, investment ventures, and other sources of income. It encompasses all the products and money received by an individual.
Income inequality has fluctuated considerably in the United States since measurements began around 1915, moving in an arc between peaks in the 1920s and 2000s, with a 30-year period of relatively lower inequality between 1950 and 1980.
Income segregation is the separation of various classes of people based on their income. For example, certain people cannot get into country clubs because of insufficient funds. Another example of income segregation in a neighborhood would be the schools, facilities and the characteristics of a population. Income segregation can be illustrated in countries such as the United States, where racial segregation is a major cause of income inequality.

Social inequality occurs when resources within a society are distributed unevenly, often as a result of inequitable allocation practices that create distinct unequal patterns based on socially defined categories of people. Differences in accessing social goods within society are influenced by factors like power, religion, kinship, prestige, race, ethnicity, gender, age, sexual orientation, and class. Social inequality usually implies the lack of equality of outcome, but may alternatively be conceptualized as a lack of equality in access to opportunity.
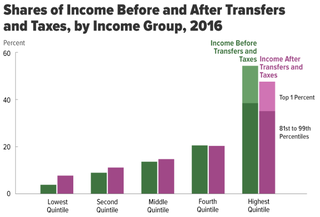
Redistribution of income and wealth is the transfer of income and wealth from some individuals to others through a social mechanism such as taxation, welfare, public services, land reform, monetary policies, confiscation, divorce or tort law. The term typically refers to redistribution on an economy-wide basis rather than between selected individuals.
China's current mainly market economy features a high degree of income inequality. According to the Asian Development Bank Institute, “before China implemented reform and opening-up policies in 1978, its income distribution pattern was characterized as egalitarian in all aspects.”
Income inequality in India refers to the unequal distribution of wealth and income among its citizens. According to the CIA World Factbook, the Gini coefficient of India, which is a measure of income distribution inequality, was 35.2 in 2011, ranking 95th out of 157. Wealth distribution is also uneven, with one report estimating that 54% of the country's wealth is controlled by millionaires, the second highest after Russia, as of November 2016. The richest 1% of Indians own 58% of wealth, while the richest 10% of Indians own 80% of the wealth. This trend has consistently increased, meaning the rich are getting richer much faster than the poor, widening the income gap. Inequality worsened since the establishment of income tax in 1922, overtaking the British Raj's record of the share of the top 1% in national income, which was 20.7% in 1939–40.According to Oxfam India's report of 2023, "Survival of the Richest: India Story," just 5 per cent of Indians own more than 60 per cent of the country’s wealth, while the bottom 50 per cent of the population possess only 3 per cent of the wealth. It also says that between 2012 and 2021, 40% of wealth generated in India has gone to just 1% of the total population and 3% of the wealth has gone to bottom 50%. The number of hungry Indians increased to 350 million in 2022 from 190 million in 2018, while the number of billionaires has increased from 102 in 2020 to 166 in 2022. The covid pandemic reduced the income of the poor, but the wealthy did well. The combined wealth of India's 100 richest is now above $600 billion, which is equivalent to India's Union Budget for 18 months. According to Union Government 's own submission to Supreme Court of India, widespread hunger has caused 65% of deaths of children under the age of 5 in 2022.Saurabh Mukherjee, the founder and CIO of Marcellus Investment Managers, along with his colleague Nandita Rajhansa, has coined the term "Octopus Class" to depict 2 lakh families or around 1 million people in India who control 80% of India's wealth. This class has consolidated financial, social and political power and has continuously pushed its 'tentacles' in every profitable activity they are interested in, aided by liberalisation and consequent growth of globalised economy since 1991.

The Kaniadakis Weibull distribution is a probability distribution arising as a generalization of the Weibull distribution. It is one example of a Kaniadakis κ-distribution. The κ-Weibull distribution has been adopted successfully for describing a wide variety of complex systems in seismology, economy, epidemiology, among many others.
References
- 1 2 Zhu, Linhong; Lerman, Kristina (26 January 2016). "Attention Inequality in Social Media". arXiv: 1601.07200 [cs.SI].
- 1 2 "A New Wealth Gap is Growing—Attention Inequality". Worth. 12 November 2019.
- ↑ Allison, Paul D. (29 June 2016). "Inequality and Scientific Productivity". Social Studies of Science. 10 (2): 163–179. doi:10.1177/030631278001000203. S2CID 145125194.
- ↑ Parolo, Pietro Della Briotta; Pan, Raj Kumar; Ghosh, Rumi; Huberman, Bernardo A.; Kaski, Kimmo; Fortunato, Santo (October 2015). "Attention decay in science". Journal of Informetrics. 9 (4): 734–745. arXiv: 1503.01881 . Bibcode:2015arXiv150301881D. doi:10.1016/j.joi.2015.07.006. S2CID 10949754.
- ↑ GmbH, finanzen net. "The Yun Family Foundation Introduces 'Attention Inequality Coefficient' as a Measure of Attention Inequality in the Attention Economy | Markets Insider". markets.businessinsider.com.
- 1 2 McCurley, Kevin S. (2008). "Income Inequality in the Attention Economy" (PDF). Google Reaserch.
- 1 2 Li, Guangrui(Kayla); Mithas, Sunil; Zhang, Zhixing; Tam, Kar Yan (2019). "How does Algorithmic Filtering Influence Attention Inequality on Social Media?". AIS ELibrary.
- ↑ Farzan, Rosta; López, Claudia (2018). "Assessing Competition for Social Media Attention Among Non-profits". Social Informatics. Lecture Notes in Computer Science. Springer International Publishing. 11185: 196–211. doi:10.1007/978-3-030-01129-1_12. ISBN 978-3-030-01128-4.
- ↑ Adler, Moshe (1985). "Stardom and Talent". The American Economic Review. 75 (1): 208–212. ISSN 0002-8282. JSTOR 1812714.
- ↑ Salganik, M. J. (10 February 2006). "Experimental Study of Inequality and Unpredictability in an Artificial Cultural Market". Science. 311 (5762): 854–856. Bibcode:2006Sci...311..854S. doi:10.1126/science.1121066. PMID 16469928. S2CID 7310490.
- ↑ Larivière, Vincent; Gingras, Yves (2010). "The impact factor's Matthew Effect: A natural experiment in bibliometrics". Journal of the Association for Information Science and Technology. 61 (2): 424–427. arXiv: 0908.3177 . Bibcode:2009arXiv0908.3177L.
- ↑ Tagiew, Rustam (13 July 2020). "Roadmap to Algocracy - A Feasibility Study". Social Science Research Network. SSRN 3650010 . Retrieved 20 May 2022.
{{cite journal}}: Cite journal requires|journal=(help)