Environmental effects of transport

Last updated

Global greenhouse gas emissions from transportation: [1]

Contents

   Cars (40%)
   Trucks (34%)
   Planes (11%)
   Boats (11%)
   Trains (4%)

The environmental effects of transport are significant because transport is a major user of energy, and burns most of the world's petroleum. This creates air pollution, including nitrous oxides and particulates, and is a significant contributor to global warming through emission of carbon dioxide. [2] [3] Within the transport sector, road transport is the largest contributor to global warming. [2]

Environmental regulations in developed countries have reduced the individual vehicle's emission. However, this has been offset by an increase in the number of vehicles, and increased use of each vehicle (an effect known as the Jevons paradox). [2] Some pathways to reduce the carbon emissions of road vehicles have been considerably studied. [4] Energy use and emissions vary largely between modes, causing environmentalists to call for a transition from air and road to rail and human-powered transport, and increase transport electrification and energy efficiency.

Other environmental impacts of transport systems include traffic congestion and automobile-oriented urban sprawl, which can consume natural habitat and agricultural lands. By reducing transport emissions globally, it is predicted that there will be significant positive effects on Earth's air quality, acid rain, smog, and climate change. [5] Health effects of transport include noise pollution and carbon monoxide emissions.

While electric cars are being built to cut down CO2 emission at the point of use, an approach that is becoming popular among cities worldwide is to prioritize public transport, bicycles, and pedestrian movement. Redirecting vehicle movement to create 20-minute neighbourhoods [6] that promotes exercise while greatly reducing vehicle dependency and pollution. Some policies are levying a congestion charge [7] to cars for travelling within congested areas during peak time.

Types of effects

Emissions

The transportation sector is a major source of greenhouse gas emissions (GHGs) in the United States. An estimated 30 percent of national GHGs are directly attributable to transportation—and in some regions, the proportion is even higher. Transportation methods are the greatest contributing source of GHGs in the U.S., accounting for 47 percent of the net increase in total U.S. emissions since 1990. [8]

Land

Other environmental effects of transport systems include traffic congestion and automobile-oriented urban sprawl, which can consume natural habitat and agricultural lands. By reducing transportation emissions globally, it is predicted that there will be significant positive effects on Earth's air quality, acid rain, smog and climate change. [9]

Health

The health effects of transport emissions are also of concern. A recent survey of the studies on the effect of traffic emissions on pregnancy outcomes has linked exposure to emissions to adverse effects on gestational duration and possibly also intrauterine growth. [10]

As listed above direct effects such as noise pollution and carbon monoxide emissions create direct and harmful effects on the environment, along with indirect effects. The indirect effects are often of higher consequence which leads to the misconception that it's the opposite since it is frequently understood that initial effects cause the most damage. For example, particulates which are the outcome of incomplete combustion done by an internal combustion engine, are not linked with respiratory and cardiovascular problems since they contribute to other factors not only to that specific condition. Even though the environmental effects are usually listed individually there are also cumulative effects. The synergetic consequences of transport activities. They take into account the varied direct and indirect effects on an ecosystem. Climate change is the sum total result of several natural and human-made factors. 15% of global CO2 emissions are attributed to the transport sector. [11]

Mode

Overall GHG from transport in the European Union Overall GHG from Transport.png
Overall GHG from transport in the European Union
Carbon emissions per passenger in the European Union Carbon Emissions Per Passenger.png
Carbon emissions per passenger in the European Union

The following table compares the emissions of the different transport means for passenger transport in Europe: [12]

Transport meansPassengers
average
Emissions
(g CO2/(km*pax))
Train15614
Small car442
Big car455
Bus12.768
Motorbike1.272
Small car1.5104
Big car1.5158
Plane88285

Aviation

Aviation emissions vary based on length of flight. For covering long distances, longer flights are a better investment of the high energy costs of take-off and landing than very short flights, yet by nature of their length inevitably use much more energy. CO2 emissions from air travel range from 0.24 kg CO2 per passenger mile (0.15 kg/km per passenger) for short flights down to 0.18 kg CO2 per passenger mile (0.11 kg/km per passenger) for long flights. [13] [14] Researchers have been raising concern about the globally increasing hypermobility of society, involving frequent and often long-distance air travel and the resulting environmental and climate effects. This threatens to overcome gains made in the efficiency of aircraft and their operations. [15] Climate scientist Kevin Anderson raised concern about the growing effect of air transport on the climate in a paper[13] and a presentation[14] in 2008. He has pointed out that even at a reduced annual rate of increase in UK passenger air travel and with the government's targeted emissions reductions in other energy use sectors, by 2030 aviation would be causing 70% of the UK's allowable CO2 emissions.

Worse, aircraft emissions at stratospheric altitudes have a greater contribution to radiative forcing than do emissions at sea level, due to the effects of several greenhouses gases in the emissions, apart from CO2. [16] The other GHGs include methane (CH4), NOx which leads to ozone [O3], and water vapor. Overall, in 2005 the radiative forcing caused by aviation amounted to 4.9% of all human-caused radiative forcing on Earth's heat balance. [17]

Road transport

Energy Efficiency of different Transport Modes.png

Cycling

Cycling has a low carbon-emission and low environmental footprint. A European study of thousands of urban dwellers found that daily mobility-related CO2 emissions were 3.2 kg (7.1 lb) of CO2 per person, with car travel contributing 70% and cycling 1% (including the entire lifecycle of vehicles and fuels). 'Cyclists' had 84% lower lifecycle CO2 emissions from all daily travel than 'non-cyclists', and the more people cycled on a daily basis, the lower was their mobility-related carbon footprint. Motorists who shifted travel modes from cars to bikes as their 'main method of travel' emitted 7.1 kg (16 lb) less CO2 per day. [18] Regular cycling was most strongly associated with reduced life cycle CO2 emissions for commuting and social trips. [18]

Changing from motorised to non-motorised travel behaviour can also have significant effects. A European study of nearly 2000 participants showed that an average person cycling 1 trip/day more and driving 1 trip/day less for 200 days a year would decrease mobility-related lifecycle CO2 emissions by about 0.5 tonnes over a year, representing a substantial share of average per capita CO2 emissions from transport (which are about 1.5 to 2.5 tonnes per year, depending on where you live). [19]

Cars

Trucks' share of US vehicles produced, has tripled since 1975. Though vehicle fuel efficiency has increased within each category, the overall trend toward less efficient types of vehicles has offset some of the benefits of greater fuel economy and reduction of pollution and carbon dioxide emissions. Without the shift towards SUVs, energy use per unit distance could have fallen 30% more than it did from 2010 to 2022. 1975- US vehicle production share, by vehicle type.svg
Trucks' share of US vehicles produced, has tripled since 1975. Though vehicle fuel efficiency has increased within each category, the overall trend toward less efficient types of vehicles has offset some of the benefits of greater fuel economy and reduction of pollution and carbon dioxide emissions. Without the shift towards SUVs, energy use per unit distance could have fallen 30% more than it did from 2010 to 2022.

When burned, unleaded gasoline produces 8.91 kg (19.6 lb) of CO2 per gallon, while diesel produces 10.15 kg (22.4 lb). [22] CO2 emissions originating from ethanol are disregarded by international agreements however so gasoline containing 10% ethanol would only be considered to produce 8.02 kg (17.7 lb) of CO2 per gallon. [23] The average fuel economy for new light-duty vehicles sold in the US of the 2017 model year was about 24.9 MPG giving around 0.36 kg (0.79 lb) of CO2 per mile. [24] The Department of Transportation's MOBILE 6.2 model, used by regional governments to model air quality, uses a fleet average (all cars, old and new) of 20.3 mpg giving around 0.44 kg (0.97 lb) of CO2 per mile. [25]

In Europe, the European Commission enforced that from 2015 all new cars registered shall not emit more than an average of 0.13 kg (0.29 lb) of CO2 per kilometre (kg CO2/km). The target is that by 2021 the average emissions for all new cars is 0.095 kg (0.21 lb) of CO2 per kilometre. [26]

Buses

On average, inner city commuting buses emit 0.3 kg (0.66 lb) of CO2 per passenger mile (0.18 kg/km per passenger), and long distance (>20 mi, >32 km) bus trips emit 0.08 kg of CO2 per passenger mile (0.05 kg/km per passenger). [27] Road and transportation conditions vary, so some carbon calculations add 10% to the total distance of the trip to account for potential traffic jams, detours, and pit-stops that may arise. [13]

Rail

Green tramway track in Belgrade, Serbia Tramvaj br. 2.jpg
Green tramway track in Belgrade, Serbia

On average, commuter rail and subway trains emit 0.17 kg (0.37 lb) of CO2 per passenger mile (0.11 kg/km per passenger), and long distance (>20 mi, >32 km) trains emit 0.19 kg (0.42 lb) of CO2 per passenger mile (0.12 kg/km per passenger). [27] Some carbon calculations add 10% to the total trip distance to account for detours, stop-overs, and other issues that may arise. [13]

Electric trains contributes relatively less to the pollution as pollution happens in the power plants which are lot more efficient than diesel driven engines. [28] Generally electric motors even when accounting for transmission losses are more efficient than internal combustion engines with efficiency further improving through recuperative braking.

Trains contain many different parts that have the potential to create noise. Wheels, engines and non-aerodynamic cargo are prone to vibrate at certain speeds. Noise caused from directly neighboring railways has the potential to lessen value to nearby property. In order to combat unbearable volumes resulting from railways, US diesel locomotives are required to be quieter than 90 decibels at 25 meters away since 1979. This noise, however, has been shown to be harmless to animals, except for horses who will become skittish. [29]

Railway cargo can be a cause of pollution. [29] Air pollution can occur from boxcars carrying materials such as iron ore, coal, soil, or aggregates and exposing these materials to the air. This can release nitrogen oxide, carbon monoxide, sulphur dioxide, or hydrocarbons into the air. Liquid pollution can come from railways contributing to a runoff into water sources, like groundwater or rivers and can result from spillage of fuels like oil into water supplies or onto land or discharge of human waste. [29]

Royal Gorge Bridge, Canon City, Colorado Royal-Gorge Aerial-Tram 2012-10-28.JPG
Royal Gorge Bridge, Canon City, Colorado

When railways are built in wilderness areas, the environment is visually altered by cuttings, embankments, dikes, and stilts. [29]

Shipping

The fleet emission average for delivery vans, trucks and big rigs is 10.17 kg (22.4 lb)CO2 per gallon of diesel consumed. Delivery vans and trucks average about 7.8 mpg (or 1.3 kg of CO2 per mile) while big rigs average about 5.3 mpg (or 1.92 kg of CO2 per mile). [30]

Ballast water discharge from other sides of the world cause a certain type of pollution different from an emission type pollution as it introduces invasive species that can cause domestic species to go extinct. Ballast water en.svg
Ballast water discharge from other sides of the world cause a certain type of pollution different from an emission type pollution as it introduces invasive species that can cause domestic species to go extinct.

Discharges of sewage into water bodies can come from many sources, including wastewater treatment facilities, runoff from livestock operations, and vessels. These discharges have the potential to impair water quality, adversely affecting aquatic environments and increasing the risks to human health. While sewage discharges have potentially wide-ranging effects on all aquatic environments, the effects may be especially problematic in marinas, slow-moving rivers, lakes and other bodies of water with low flushing rates. Environmentally this creates invasive species that often drive other species to their extinction and cause harm to the environment and local businesses. [31]

Emissions from ships have much more significant environmental effects; many ships go internationally from port to port and are not seen for weeks, contributing to air and water pollution on its voyage. Emission of greenhouse gases displaces the amount of gas that allows for UV-rays through the ozone. Sulfur and nitrogen compounds emitted from ship will oxidize in the atmosphere to form sulfate and nitrate. Emissions of nitrogen oxides, carbon monoxide, and volatile organic compounds (VOC) will lead to enhanced surface ozone formation and methane oxidation, depleting the ozone. The effect of the international ship emission on the distribution of chemical compounds such as NOx, CO, O3, OH, SO2, HNO3, and sulfate is studied using a global chemical transport model (CTM), the Oslo CTM2. In particular, the large-scale distribution and diurnal variation of the oxidants and sulfur compounds are studied interactively. Meteorological data (winds, temperature, precipitation, clouds, etc.) used as input for the CTM calculations are provided by a weather prediction model. [32]

Shipping Emissions Factors: [33]

Mode of Transportkg of CO2 per Ton-Mile
Air cargo0.8063
Truck0.1693
Train0.1048
Sea freight0.0403

The road haulage industry is contributing around 20% of the UK's total carbon emissions a year, with only the energy industry having a larger contribution, at around 39%. Road haulage is a significant consumer of fossil fuels and associated carbon emissions – HGV vehicles account for almost 20 percent of total emissions. [34]

Mitigation of environmental effects

European Investment Bank Climate survey result on countries that want to make public transport more efficient and ban high-emissions vehicles Within cities, make public transport more efficient and ban high-emission vehicles..svg
European Investment Bank Climate survey result on countries that want to make public transport more efficient and ban high-emissions vehicles

Sustainable transport

Sustainable transport is transport with either lower environmental footprint per passenger, per distance or higher capacity. Typically sustainable transport modes are rail, bicycle and walking.

Road-rail parallel layout

Construction of the route through the Kosching forest, north of Ingolstadt, Germany, had a large environmental footprint but with Road-Rail Parallel Layout this would be less than using multiple routes. NIM Baustelle2001 Leidorf Koeschinger Forst.jpg
Construction of the route through the Kösching forest, north of Ingolstadt, Germany, had a large environmental footprint but with Road-Rail Parallel Layout this would be less than using multiple routes.

Road-Rail Parallel Layout is a design option to reduce the environmental effects of new transportation routes by locating railway tracks alongside a highway. In 1984 the ParisLyon high-speed rail route in France had about 14% parallel layout with the highway, and in 2002, 70% parallel layout was achieved with the Cologne–Frankfurt high-speed rail line.

Following the COVID-19 pandemic, the European Investment Bank Climate survey found that if travel restrictions were lifted, flying less frequently would become the norm. If travel restrictions are lifted, flying less frequently would become popular..svg
Following the COVID-19 pandemic, the European Investment Bank Climate survey found that if travel restrictions were lifted, flying less frequently would become the norm.

Involvement

Mitigation does not entirely involve large-scale changes such as road construction, but everyday people can contribute. Walking, cycling trips, short or non-commute trips, can be an alternate mode of transportation when travelling short or even long distances. A multi-modal trip involving walking, a bus ride, and bicycling may be counted solely as a transit trip. Economic evaluations of transportation investments often ignore the true effects of increased vehicular traffic—incremental parking, traffic accidents, and consumer costs—and the real benefits of alternative modes of transport. Most travel models do not account for the negative effects of additional vehicular traffic that result from roadway capacity expansion and overestimate the economic benefits of urban highway projects. Transportation planning indicators, such as average traffic speeds, congestion delays, and roadway level of service, measure mobility rather than accessibility. [36]

Climate change is a factor that 67% of Europeans consider when choosing where to go on holiday. Specifically, people under the age of 30 are more likely to consider climate implications of travelling to vacation spots. [37] [38] 52% of young Europeans, 37% of people ages 30–64 and 25% of people aged above 65, state that in 2022 they will choose to travel by plane. 27% of young people claim they will travel to a faraway destination. [39] [40]

Europeans expect lifestyle changes to experience great transformation in the next 20 years. 31% of respondents to a climate survey conducted in 2021 believe that most people will no longer own their own vehicle, while 63% believe that teleworking will become the norm to reduce emissions and mitigate the effects of climate change. 48% predict that energy quotas will be individually assigned. [41]

The European Investment Bank's Climate survey found that two-thirds of Europeans plan to sacrifice the trip of their dreams to reduce emissions and combat climate change. Two-thirds of Europeans plan to sacrifice the trip of their dreams..svg
The European Investment Bank's Climate survey found that two-thirds of Europeans plan to sacrifice the trip of their dreams to reduce emissions and combat climate change.

Influence of e-commerce

As large retail corporations in recent years have focused attention on eCommerce, many have begun to offer fast (e.g. 2-day) shipping[ citation needed ]. These fast shipping options get products and services to the hands of buyers faster than ever before, but have they are negative externalities on public roads and climate change [ citation needed ]. A survey in 2016 by UPS shows that 46% of online shoppers abandoned an unused shopping cart due to a shipping time that was way too long and that 1 and 3 online shoppers look at the speed of delivery from the marketplaces they buy from. [42] Consumers are demanding the fast delivery of goods and services. AlixPartners LLP found that consumers expect to wait an average of 4.8 days for delivery, down from 5.5 days in 2012. And the share of those who are willing to wait more than five days has declined to 60% from 74% in four years. [43]

E-commerce shopping can be seen as the best way to reduce one's carbon footprint. Yet, this is only true to some extent. Shopping online is less energy intensive than driving to a physical store location and then driving back home. This is because shipping can take advantage of economies of scale. However, these benefits are diminished when e-commerce stores package items separately or when customers buy items separately and do not take the time to one stop shop . [44] For large stores with a large online presence, they can have millions of customers opting for these shipping benefits. As a result, they are unintentionally increasing carbon emissions from not consolidating their purchases. Josué Velázquez-Martínez, a sustainable logistics professor at MIT notes that "if you are willing to wait a week for shipping, you just kill 20 trees instead of 100 trees." [45] The only time shipping works in being less energy intensive is when customer do not choose rush delivery, which includes 2-day shipping. M. Sanjayan, the CEO of Conservation International, explains that getting your online purchase delivered at home in just two days puts more polluting vehicles on the road. [46] In addition to standard shipping, consumers must be satisfied with their purchases so that they do not constantly returns items. By returning shipments on standard shipping, the positive contribution to environment is being taken back. In research done by Vox, they found in 2016 transportation overtook power plants as the top prouder of carbon dioxide emissions in the US for the first time since 1979. [47] These environmental issues came from nearly a quarter of transportation trucks that either carry medium and heavy duty loads of merchandise; these trucks are often the ones doing e-commerce shipping.

This is the market for shipping pollution. The optimal quantity and the optimal tax per unit of pollution can be found at the intersection of MAC and MD. As the quantity of pollution decreases (emissions), the cost to decrease each marginal unit of pollution increases. Markert for Shipping Pollution.png
This is the market for shipping pollution. The optimal quantity and the optimal tax per unit of pollution can be found at the intersection of MAC and MD. As the quantity of pollution decreases (emissions), the cost to decrease each marginal unit of pollution increases.

Since 2009, UPS deliveries have increased by 65%. [48] With the increase in deliveries, there is a demand for trucks on the road, resulting in more carbon emissions in our atmosphere. More recently, there has been research to help combat greenhouse gas emission to the atmosphere with better traffic signals. These WiFi signals cut down on wait time at stop lights and reduce wasting fuel. These signals help automobiles adjust their velocity so that they can  increase their chances of getting through the light, smoothing travel patterns and obtaining fuel-economy benefits. These small adjustments result in big changes in fuel savings. The cities that have started implementing smart light technology such as San Jose, CA and Las Vegas, NV. Light technology has shown to save 15-20% in fuel savings. [44] According to the United States Environmental Protection Agency, transportation is the second leading source of GHG emission behind electricity and project that by 2050 freight transportation emissions will pass passenger vehicle emissions. [48] Another technological advancements is truck platooning, trucks are able to send signals to neighboring trucks about their speed. This communication between vehicles reduces congestion on the roads and reduce drag, increasing fuel savings by 10 to 20%. [44]

With these tech implementations in major cities and towns, there is the ability to reach an optimal level of pollution given the rise of e-commerce shipments. The figure above illustrates that decreasing emissions would result in the equilibrium for the market of shipping population, which can be done by consolidating packages, light technology, or truck platooning.

See also

Related Research Articles

<span class="mw-page-title-main">Fuel efficiency</span> Form of thermal efficiency

Fuel efficiency is a form of thermal efficiency, meaning the ratio of effort to result of a process that converts chemical potential energy contained in a carrier (fuel) into kinetic energy or work. Overall fuel efficiency may vary per device, which in turn may vary per application, and this spectrum of variance is often illustrated as a continuous energy profile. Non-transportation applications, such as industry, benefit from increased fuel efficiency, especially fossil fuel power plants or industries dealing with combustion, such as ammonia production during the Haber process.

The California Air Resources Board is an agency of the government of California that aims to reduce air pollution. Established in 1967 when then-governor Ronald Reagan signed the Mulford-Carrell Act, combining the Bureau of Air Sanitation and the Motor Vehicle Pollution Control Board, CARB is a department within the cabinet-level California Environmental Protection Agency.

<span class="mw-page-title-main">Vehicle emission standard</span> Legal requirements governing air pollutants released into the atmosphere

Emission standards are the legal requirements governing air pollutants released into the atmosphere. Emission standards set quantitative limits on the permissible amount of specific air pollutants that may be released from specific sources over specific timeframes. They are generally designed to achieve air quality standards and to protect human life. Different regions and countries have different standards for vehicle emissions.

<span class="mw-page-title-main">Zero-emissions vehicle</span> Class of motor vehicle

A zero-emission vehicle, or ZEV, is a vehicle that does not emit exhaust gas or other pollutants from the onboard source of power. The California definition also adds that this includes under any and all possible operational modes and conditions. This is because under cold-start conditions for example, internal combustion engines tend to produce the maximum amount of pollutants. In a number of countries and states, transport is cited as the main source of greenhouse gases (GHG) and other pollutants. The desire to reduce this is thus politically strong.

<span class="mw-page-title-main">Exhaust gas</span> Gases emitted as a result of fuel reactions in combustion engines

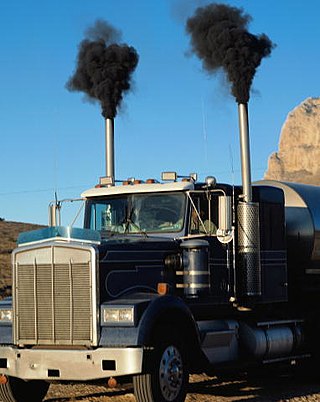
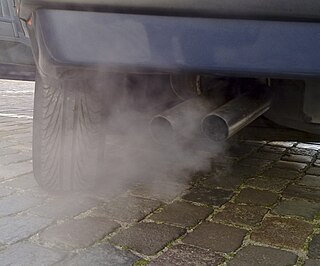
Exhaust gas or flue gas is emitted as a result of the combustion of fuels such as natural gas, gasoline (petrol), diesel fuel, fuel oil, biodiesel blends, or coal. According to the type of engine, it is discharged into the atmosphere through an exhaust pipe, flue gas stack, or propelling nozzle. It often disperses downwind in a pattern called an exhaust plume.

<span class="mw-page-title-main">Sustainable transport</span> Sustainable transport in the senses of social, environmental and climate impacts

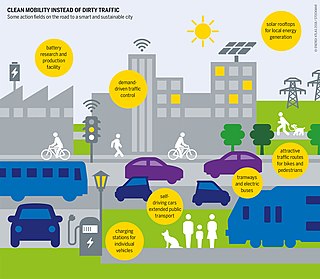
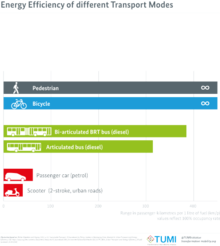
Sustainable transport refers to ways of transportation that are sustainable in terms of their social and environmental impacts. Components for evaluating sustainability include the particular vehicles used for road, water or air transport; the source of energy; and the infrastructure used to accommodate the transport. Transport operations and logistics as well as transit-oriented development are also involved in evaluation. Transportation sustainability is largely being measured by transportation system effectiveness and efficiency as well as the environmental and climate impacts of the system. Transport systems have significant impacts on the environment, accounting for between 20% and 25% of world energy consumption and carbon dioxide emissions. The majority of the emissions, almost 97%, came from direct burning of fossil fuels. In 2019, about 95% of the fuel came from fossil sources. The main source of greenhouse gas emissions in the European Union is transportation. In 2019 it contributes to about 31% of global emissions and 24% of emissions in the EU. In addition, up to the COVID-19 pandemic, emissions have only increased in this one sector. Greenhouse gas emissions from transport are increasing at a faster rate than any other energy using sector. Road transport is also a major contributor to local air pollution and smog.

<span class="mw-page-title-main">Green vehicle</span> Environmentally friendly vehicles

A green vehicle, clean vehicle, eco-friendly vehicle or environmentally friendly vehicle is a road motor vehicle that produces less harmful impacts to the environment than comparable conventional internal combustion engine vehicles running on gasoline or diesel, or one that uses certain alternative fuels. Presently, in some countries the term is used for any vehicle complying or surpassing the more stringent European emission standards, or California's zero-emissions vehicle standards, or the low-carbon fuel standards enacted in several countries.

<span class="mw-page-title-main">Emission intensity</span> Emission rate of a pollutant

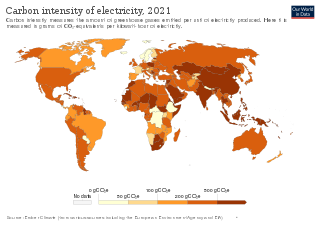
An emission intensity is the emission rate of a given pollutant relative to the intensity of a specific activity, or an industrial production process; for example grams of carbon dioxide released per megajoule of energy produced, or the ratio of greenhouse gas emissions produced to gross domestic product (GDP). Emission intensities are used to derive estimates of air pollutant or greenhouse gas emissions based on the amount of fuel combusted, the number of animals in animal husbandry, on industrial production levels, distances traveled or similar activity data. Emission intensities may also be used to compare the environmental impact of different fuels or activities. In some case the related terms emission factor and carbon intensity are used interchangeably. The jargon used can be different, for different fields/industrial sectors; normally the term "carbon" excludes other pollutants, such as particulate emissions. One commonly used figure is carbon intensity per kilowatt-hour (CIPK), which is used to compare emissions from different sources of electrical power.

<span class="mw-page-title-main">Climate change mitigation</span> Actions to reduce net greenhouse gas emissions to limit climate change

Climate change mitigation is action to limit climate change. This action either reduces emissions of greenhouse gases or removes those gases from the atmosphere. The recent rise in global temperature is mostly due to emissions from burning fossil fuels such as coal, oil, and natural gas. There are various ways how mitigation can reduce emissions. One important way is to switch to sustainable energy sources. Other ways are to conserve energy and to increase efficiency. It is possible to remove carbon dioxide from the atmosphere. This can be done by enlarging forests, restoring wetlands and using other natural and technical processes. The name for these processes is carbon sequestration. Governments and companies have pledged to reduce emissions to prevent dangerous climate change. These pledges are in line with international negotiations to limit warming.

<span class="mw-page-title-main">Fuel economy in automobiles</span> Distance traveled by a vehicle compared to volume of fuel consumed

The fuel economy of an automobile relates to the distance traveled by a vehicle and the amount of fuel consumed. Consumption can be expressed in terms of the volume of fuel to travel a distance, or the distance traveled per unit volume of fuel consumed. Since fuel consumption of vehicles is a significant factor in air pollution, and since the importation of motor fuel can be a large part of a nation's foreign trade, many countries impose requirements for fuel economy. Different methods are used to approximate the actual performance of the vehicle. The energy in fuel is required to overcome various losses encountered while propelling the vehicle, and in providing power to vehicle systems such as ignition or air conditioning. Various strategies can be employed to reduce losses at each of the conversions between the chemical energy in the fuel and the kinetic energy of the vehicle. Driver behavior can affect fuel economy; maneuvers such as sudden acceleration and heavy braking waste energy.

Various energy conservation measures are taken in the United Kingdom.

<span class="mw-page-title-main">Environmental effects of aviation</span> Effect of emissions from aircraft engines

Aircraft engines produce gases, noise, and particulates from fossil fuel combustion, raising environmental concerns over their global effects and their effects on local air quality. Jet airliners contribute to climate change by emitting carbon dioxide, the best understood greenhouse gas, and, with less scientific understanding, nitrogen oxides, contrails and particulates. Their radiative forcing is estimated at 1.3–1.4 that of CO2 alone, excluding induced cirrus cloud with a very low level of scientific understanding. In 2018, global commercial operations generated 2.4% of all CO2 emissions.

<span class="mw-page-title-main">Greenhouse gas emissions</span> Sources and amounts of greenhouse gases emitted to the atmosphere from human activities

Greenhouse gas (GHG) emissions from human activities intensify the greenhouse effect. This contributes to climate change. Carbon dioxide, from burning fossil fuels such as coal, oil, and natural gas, is one of the most important factors in causing climate change. The largest emitters are China followed by the United States. The United States has higher emissions per capita. The main producers fueling the emissions globally are large oil and gas companies. Emissions from human activities have increased atmospheric carbon dioxide by about 50% over pre-industrial levels. The growing levels of emissions have varied, but have been consistent among all greenhouse gases. Emissions in the 2010s averaged 56 billion tons a year, higher than any decade before. Total cumulative emissions from 1870 to 2017 were 425±20 GtC from fossil fuels and industry, and 180±60 GtC from land use change. Land-use change, such as deforestation, caused about 31% of cumulative emissions over 1870–2017, coal 32%, oil 25%, and gas 10%.

<span class="mw-page-title-main">Greenhouse gas emissions by the United States</span> Climate changing gases from the North American country

The United States produced 5.2 billion metric tons of carbon dioxide equivalent greenhouse gas (GHG) emissions in 2020, the second largest in the world after greenhouse gas emissions by China and among the countries with the highest greenhouse gas emissions per person. In 2019 China is estimated to have emitted 27% of world GHG, followed by the United States with 11%, then India with 6.6%. In total the United States has emitted a quarter of world GHG, more than any other country. Annual emissions are over 15 tons per person and, amongst the top eight emitters, is the highest country by greenhouse gas emissions per person. However, the IEA estimates that the richest decile in the US emits over 55 tonnes of CO2 per capita each year. Because coal-fired power stations are gradually shutting down, in the 2010s emissions from electricity generation fell to second place behind transportation which is now the largest single source. In 2020, 27% of the GHG emissions of the United States were from transportation, 25% from electricity, 24% from industry, 13% from commercial and residential buildings and 11% from agriculture. In 2021, the electric power sector was the second largest source of U.S. greenhouse gas emissions, accounting for 25% of the U.S. total. These greenhouse gas emissions are contributing to climate change in the United States, as well as worldwide.

Transport or transportation is the intentional movement of humans, animals, and goods from one location to another. Modes of transport include air, land, water, cable, pipelines, and space. The field can be divided into infrastructure, vehicles, and operations. Transport enables human trade, which is essential for the development of civilizations.

<span class="mw-page-title-main">Individual action on climate change</span> What people can do individually to stop global warming

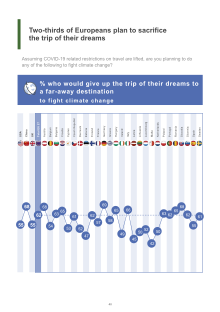
Individual action on climate change can include personal choices in many areas, such as diet, travel, household energy use, consumption of goods and services, and family size. Individuals can also engage in local and political advocacy around issues of climate change. People who wish to reduce their carbon footprint, can take "high-impact" actions, such as avoiding frequent flying and petrol fuelled cars, eating mainly a plant-based diet, having fewer children, using clothes and electrical products for longer, and electrifying homes. Avoiding meat and dairy foods has been called "the single biggest way" an individual can reduce their environmental impact. Excessive consumption is more to blame for climate change than population increase. High consumption lifestyles have a greater environmental impact, with the richest 10% of people emitting about half the total lifestyle emissions.

<span class="mw-page-title-main">Mobile source air pollution</span> Air pollution emitted by motor vehicles, airplanes, locomotives, and other engines

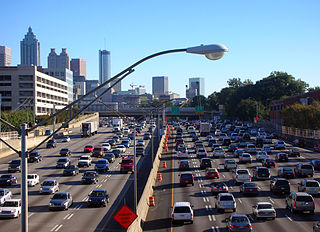
Mobile source air pollution includes any air pollution emitted by motor vehicles, airplanes, locomotives, and other engines and equipment that can be moved from one location to another. Many of these pollutants contribute to environmental degradation and have negative effects on human health. To prevent unnecessary damage to human health and the environment, environmental regulatory agencies such as the U.S. Environmental Protection Agency have established policies to minimize air pollution from mobile sources. Similar agencies exist at the state level. Due to the large number of mobile sources of air pollution, and their ability to move from one location to another, mobile sources are regulated differently from stationary sources, such as power plants. Instead of monitoring individual emitters, such as an individual vehicle, mobile sources are often regulated more broadly through design and fuel standards. Examples of this include corporate average fuel economy standards and laws that ban leaded gasoline in the United States. The increase in the number of motor vehicles driven in the U.S. has made efforts to limit mobile source pollution challenging. As a result, there have been a number of different regulatory instruments implemented to reach the desired emissions goals.

<span class="mw-page-title-main">Climate change in Europe</span> Emissions, impacts and responses of Europe related to climate change

Climate change has resulted in an increase in temperature of 2.3 °C (2022) in Europe compared to pre-industrial levels. Europe is the fastest warming continent in the world. Europe's climate is getting warmer due to anthropogenic activity. According to international climate experts, global temperature rise should not exceed 2 °C to prevent the most dangerous consequences of climate change; without reduction in greenhouse gas emissions, this could happen before 2050. Climate change has implications for all regions of Europe, with the extent and nature of impacts varying across the continent.

<span class="mw-page-title-main">Effects of cars</span> Impacts of car use

Cars affect many people, not just drivers and car passengers. The externalities of automobiles, similarly to other economic externalities, are the measurable difference in costs for other parties to those of the car proprietor, such costs not taken into account when the proprietor opts to drive their car. According to Harvard University, the main externalities of driving are local and global pollution, oil dependence, traffic congestion and traffic collisions; while according to a meta-study conducted by the Delft University these externalities are congestion and scarcity costs, accident costs, air pollution costs, noise costs, climate change costs, costs for nature and landscape, costs for water pollution, costs for soil pollution and costs of energy dependency.

<span class="mw-page-title-main">Health and environmental effects of battery electric cars</span>

Usage of electric cars damage people’s health and the environment less than similar sized internal combustion engine cars. While aspects of their production can induce similar, less or different environmental impacts, they produce little or no tailpipe emissions, and reduce dependence on petroleum, greenhouse gas emissions, and deaths from air pollution. Electric motors are significantly more efficient than internal combustion engines and thus, even accounting for typical power plant efficiencies and distribution losses, less energy is required to operate an electric vehicle. Manufacturing batteries for electric cars requires additional resources and energy, so they may have a larger environmental footprint in the production phase. Electric vehicles also generate different impacts in their operation and maintenance. Electric vehicles are typically heavier and could produce more tire and road dust air pollution, but their regenerative braking could reduce such particulate pollution from brakes. Electric vehicles are mechanically simpler, which reduces the use and disposal of engine oil.

References

  1. International Council on Clean Transportation, A world of thoughts on Phase 2, 16 September 2016 (page visited on 18 November 2018).
  2. 1 2 3 Fuglestvet et al., Center for International Climate and Environmental Research (2007). "Climate forcing from the transport sectors" (PDF).
  3. Worldwatch Institute (16 January 2008). "Analysis: Nano Hypocrisy?". Archived from the original on 13 October 2013. Retrieved 12 December 2009.
  4. "Carbon Pathways Analysis – Informing Development of a Carbon Reduction Strategy for the Transport Sector – Claverton Group". claverton-energy.com.
  5. Environment Canada. "Transportation". Archived from the original on July 13, 2007. Retrieved 30 July 2008.
  6. Planning (2020-09-09). "20-minute neighbourhoods". Planning. Retrieved 2020-09-26.
  7. "Congestion Charge (Official)". Transport for London. Retrieved 2020-09-26.
  8. "Climate and Energy Resources for State, Local, and Tribal Governments". US Environmental Protection Agency. Retrieved 2016-04-14.
  9. Environment Canada. "Transportation". Archived from the original on July 13, 2007. Retrieved 30 July 2008.
  10. Pereira, G. et al. (2010) "Residential exposure to traffic emissions and adverse pregnancy outcomes". S.A.P.I.EN.S.3 (1)
  11. Rodrigue, Dr. Jean-Paul. "The Environmental Impacts of Transportation". people.hofstra.edu. Archived from the original on 2018-01-31. Retrieved 2016-04-14.
  12. "CO2 emissions from passenger transport". eea.europa.eu.
  13. 1 2 3 "How We Calculate Your Carbon Footprint". Archived from the original on 2012-01-03. Retrieved 2011-12-29.
  14. "[SafeClimate] measuring and reporting | tools". Archived from the original on 2008-03-27. Retrieved 2010-04-23.
  15. Gössling S, Ceron JP, Dubois G, Hall CM, Gössling IS, Upham P, Earthscan L (2009). Hypermobile travelers and Implications for Carbon Dioxide Emissions Reduction. In: Climate Change and Aviation: Issues, Challenges, and Solutions, London. The chapter: (PDF) Archived June 19, 2010, at the Wayback Machine
  16. Schumann, Ulrich (2011). "American Institute of Aeronautics and Astronautics: Potential to reduce the climate impact of aviation by flight level changes" (PDF). Retrieved 2022-06-30.
  17. Lee D.S., Pitari G., Grewe V., Gierens K., Penner J.E., Petzold A., Prather M.J., Schumann U., Bais A., Berntsen T., Iachetti D., Lim L.L., Sausen R. (2010). Transport impacts on atmosphere and climate: Aviation. In – Atmospheric Environment Transport Impacts on Atmosphere and Climate: The ATTICA Assessment Report. 44:37:pp.4678-4734.
  18. 1 2 Brand, Christian; Dons, Evi; Anaya-Boig, Esther; Avila-Palencia, Ione; Clark, Anna; de Nazelle, Audrey; Gascon, Mireia; Gaupp-Berghausen, Mailin; Gerike, Regine; Götschi, Thomas; et, al. (2021-04-01). "The climate change mitigation effects of daily active travel in cities". Transportation Research Part D: Transport and Environment. 93: 102764. doi: 10.1016/j.trd.2021.102764 . hdl: 10230/53376 .
  19. Brand, Christian; Götschi, Thomas; Dons, Evi; Gerike, Regine; Anaya-Boig, Esther; Avila-Palencia, Ione; de Nazelle, Audrey; Gascon, Mireia; Gaupp-Berghausen, Mailin; Iacorossi, Francesco; Kahlmeier, Sonja (2021-03-01). "The climate change mitigation impacts of active travel: Evidence from a longitudinal panel study in seven European cities". Global Environmental Change. 67: 102224. doi:10.1016/j.gloenvcha.2021.102224. hdl: 10044/1/89043 . ISSN   0959-3780. S2CID   233814021.
  20. "Highlights of the Automotive Trends Report". EPA.gov. U.S. Environmental Protection Agency (EPA). 12 December 2022. Archived from the original on 2 September 2023.
  21. Cazzola, Pierpaolo; Paoli, Leonardo; Teter, Jacob (November 2023). "Trends in the Global Vehicle Fleet 2023 / Managing the SUV Shift and the EV Transition" (PDF). Global Fuel Economy Initiative (GFEI). p. 3. doi:10.7922/G2HM56SV. Archived (PDF) from the original on 26 November 2023.
  22. "U.S. Energy Information Administration (EIA)". Archived from the original on 2004-11-01. Retrieved 2009-08-21.
  23. "How much carbon dioxide is produced by burning gasoline and diesel fuel? – FAQ – U.S. Energy Information Administration (EIA)". eia.gov.
  24. Highlights of the Automotive Trends Report | US EPA
  25. "Vehicles and Engines" (PDF). US Environmental Protection Agency. 2016-08-16.
  26. "Reducing CO2 emissions from passenger cars". ec.europa.eu. 2016-11-23.
  27. 1 2 "Archived copy". Archived from the original on 2016-01-12. Retrieved 2010-04-23.{{cite web}}: CS1 maint: archived copy as title (link)
  28. "'Dramatically more powerful': world's first battery-electric freight train unveiled". the Guardian. 2021-09-16. Retrieved 2021-09-21.
  29. 1 2 3 4 Carpenter, T.G. (1994). The Environmental Impact of Railways. New York: John Wiley & Sons.
  30. "403 - Forbidden: Access is denied" (PDF).
  31. "Vessel Sewage Discharges: Homepage". US Environmental Protection Agency. 2015-09-15. Retrieved 2016-04-14.
  32. Endresen, Øyvind; Sørgård, Eirik; Sundet, Jostein K.; Dalsøren, Stig B.; Isaksen, Ivar S. A.; Berglen, Tore F.; Gravir, Gjermund (2003-09-16). "Emission from international sea transportation and environmental impact". Journal of Geophysical Research: Atmospheres. 108 (D17): 4560. Bibcode:2003JGRD..108.4560E. doi: 10.1029/2002JD002898 . ISSN   2156-2202.
  33. "Klimakiller Flugverkehr - zur Umweltrelevanz des Flughafens Hamburg- Eine Information der Notgemeinschaft der Flughafenanlieger Hamburg". fluglaerm.de. Archived from the original on 2010-03-07. Retrieved 2010-04-23.
  34. "Reducing your Road Haulage Carbon Emissions – Return Loads". returnloads.net.
  35. 1 2 Bank, European Investment (2021-05-31). The EIB Climate Survey 2020-2021 - The climate crisis in a COVID-19 world: calls for a green recovery. European Investment Bank. ISBN   978-92-861-5021-0.
  36. "Transportation Solutions | Reimagine!". www.reimaginerpe.org. Retrieved 2016-04-14.
  37. "2021-2022 EIB Climate Survey, part 2 of 3: Shopping for a new car? Most Europeans say they will opt for hybrid or electric". EIB.org. Retrieved 2022-04-04.
  38. "2021-2022 EIB Climate Survey, part 1 of 3: Europeans sceptical about successfully reducing carbon emissions by 2050, American and Chinese respondents more confident". EIB.org. Retrieved 2022-03-30.
  39. "2021-2022 EIB Climate Survey, part 2 of 3: Shopping for a new car? Most Europeans say they will opt for hybrid or electric". EIB.org. Retrieved 2022-04-04.
  40. "2021-2022 EIB Climate Survey, part 1 of 3: Europeans sceptical about successfully reducing carbon emissions by 2050, American and Chinese respondents more confident". EIB.org. Retrieved 2022-03-30.
  41. "2021-2022 EIB Climate Survey, part 3 of 3: The economic and social impact of the green transition". EIB.org. Retrieved 2022-03-30.
  42. "UPS Pulse of the Online Shopper | UPS - United States". www.ups.com. Archived from the original on 2019-05-15. Retrieved 2019-03-13.
  43. Chao, Loretta (2016-06-13). "Online Shoppers Want Delivery Faster, Cheaper, Survey Shows". Wall Street Journal. ISSN   0099-9660 . Retrieved 2019-03-13.
  44. 1 2 3 Murdock, Andy (2017-11-17). "The environmental cost of free 2-day shipping". Vox. Retrieved 2019-03-13.
  45. "Amazon's new environmental report will show how bad two-day shipping is". www.msn.com. Retrieved 2019-03-13.
  46. "Super-Fast Shipping Comes With High Environmental Costs". NPR.org. Retrieved 2019-03-13.
  47. Brad Plumer (2016-06-13). "Power plants are no longer America's biggest climate problem. Transportation is". Vox. Retrieved 2022-12-01.
  48. 1 2 "Learn about SmartWay". US Environmental Protection Agency. 2016-04-29. Retrieved 2019-03-13.