Electron paramagnetic resonance

Last updated

Electron paramagnetic resonance (EPR) or electron spin resonance (ESR) spectroscopy is a method for studying materials that have unpaired electrons. The basic concepts of EPR are analogous to those of nuclear magnetic resonance (NMR), but the spins excited are those of the electrons instead of the atomic nuclei. EPR spectroscopy is particularly useful for studying metal complexes and organic radicals. EPR was first observed in Kazan State University by Soviet physicist Yevgeny Zavoisky in 1944, [1] [2] and was developed independently at the same time by Brebis Bleaney at the University of Oxford.

Contents

Typical set-up for recording EPR spectra. The user would be seated next to the RF generator, magnet, and controls for sample temperature. EPR spectometer.JPG
Typical set-up for recording EPR spectra. The user would be seated next to the RF generator, magnet, and controls for sample temperature.

Theory

Origin of an EPR signal

Every electron has a magnetic moment and spin quantum number , with magnetic components or . In the presence of an external magnetic field with strength , the electron's magnetic moment aligns itself either antiparallel () or parallel () to the field, each alignment having a specific energy due to the Zeeman effect:

where

Therefore, the separation between the lower and the upper state is for unpaired free electrons. This equation implies (since both and are constant) that the splitting of the energy levels is directly proportional to the magnetic field's strength, as shown in the diagram below.

EPR splitting.svg

An unpaired electron can change its electron spin by either absorbing or emitting a photon of energy such that the resonance condition, , is obeyed. This leads to the fundamental equation of EPR spectroscopy: .

Experimentally, this equation permits a large combination of frequency and magnetic field values, but the great majority of EPR measurements are made with microwaves in the 9000–10000 MHz (9–10 GHz) region, with fields corresponding to about 3500 G (0.35 T). Furthermore, EPR spectra can be generated by either varying the photon frequency incident on a sample while holding the magnetic field constant or doing the reverse. In practice, it is usually the frequency that is kept fixed. A collection of paramagnetic centers, such as free radicals, is exposed to microwaves at a fixed frequency. By increasing an external magnetic field, the gap between the and energy states is widened until it matches the energy of the microwaves, as represented by the double arrow in the diagram above. At this point the unpaired electrons can move between their two spin states. Since there typically are more electrons in the lower state, due to the Maxwell–Boltzmann distribution (see below), there is a net absorption of energy, and it is this absorption that is monitored and converted into a spectrum. The upper spectrum below is the simulated absorption for a system of free electrons in a varying magnetic field. The lower spectrum is the first derivative of the absorption spectrum. The latter is the most common way to record and publish continuous wave EPR spectra.

EPR Signal Harmonics.svg

For the microwave frequency of 9388.4 MHz, the predicted resonance occurs at a magnetic field of about = 0.3350 T = 3350 G

Because of electron-nuclear mass differences, the magnetic moment of an electron is substantially larger than the corresponding quantity for any nucleus, so that a much higher electromagnetic frequency is needed to bring about a spin resonance with an electron than with a nucleus, at identical magnetic field strengths. For example, for the field of 3350 G shown above, spin resonance occurs near 9388.2 MHz for an electron compared to only about 14.3 MHz for 1H nuclei. (For NMR spectroscopy, the corresponding resonance equation is where and depend on the nucleus under study.)

Field modulation

The field oscillates between B1 and B2 due to the superimposed modulation field at 100 kHz. This causes the absorption intensity to oscillate between I1 and I2. The larger the difference the larger the intensity detected by the detector tuned to 100 kHz (note this can be negative or even 0). As the difference between the two intensities is detected the first derivative of the absorption is detected. EPR Field Modulation.svg
The field oscillates between B1 and B2 due to the superimposed modulation field at 100 kHz. This causes the absorption intensity to oscillate between I1 and I2. The larger the difference the larger the intensity detected by the detector tuned to 100 kHz (note this can be negative or even 0). As the difference between the two intensities is detected the first derivative of the absorption is detected.

As previously mentioned an EPR spectrum is usually directly measured as the first derivative of the absorption. This is accomplished by using field modulation. A small additional oscillating magnetic field is applied to the external magnetic field at a typical frequency of 100 kHz. [4] By detecting the peak to peak amplitude the first derivative of the absorption is measured. By using phase sensitive detection only signals with the same modulation (100 kHz) are detected. This results in higher signal to noise ratios. Note field modulation is unique to continuous wave EPR measurements and spectra resulting from pulsed experiments are presented as absorption profiles.

The same idea underlies the Pound-Drever-Hall technique for frequency locking of lasers to a high-finesse optical cavity.

Maxwell–Boltzmann distribution

In practice, EPR samples consist of collections of many paramagnetic species, and not single isolated paramagnetic centers. If the population of radicals is in thermodynamic equilibrium, its statistical distribution is described by the Boltzmann distribution:

where is the number of paramagnetic centers occupying the upper energy state, is the Boltzmann constant, and is the thermodynamic temperature. At 298 K, X-band microwave frequencies ( ≈ 9.75 GHz) give ≈ 0.998, meaning that the upper energy level has a slightly smaller population than the lower one. Therefore, transitions from the lower to the higher level are more probable than the reverse, which is why there is a net absorption of energy.

The sensitivity of the EPR method (i.e., the minimal number of detectable spins ) depends on the photon frequency according to

where is a constant, is the sample's volume, is the unloaded quality factor of the microwave cavity (sample chamber), is the cavity filling coefficient, and is the microwave power in the spectrometer cavity. With and being constants, ~ , i.e., ~ , where ≈ 1.5. In practice, can change varying from 0.5 to 4.5 depending on spectrometer characteristics, resonance conditions, and sample size.

A great sensitivity is therefore obtained with a low detection limit and a large number of spins. Therefore, the required parameters are:

Spectral parameters

In real systems, electrons are normally not solitary, but are associated with one or more atoms. There are several important consequences of this:

  1. An unpaired electron can gain or lose angular momentum, which can change the value of its g-factor, causing it to differ from . This is especially significant for chemical systems with transition-metal ions.
  2. Systems with multiple unpaired electrons experience electron–electron interactions that give rise to "fine" structure. This is realized as zero field splitting and exchange coupling, and can be large in magnitude.
  3. The magnetic moment of a nucleus with a non-zero nuclear spin will affect any unpaired electrons associated with that atom. This leads to the phenomenon of hyperfine coupling, analogous to J-coupling in NMR, splitting the EPR resonance signal into doublets, triplets and so forth. Additional smaller splittings from nearby nuclei is sometimes termed "superhyperfine" coupling.
  4. Interactions of an unpaired electron with its environment influence the shape of an EPR spectral line. Line shapes can yield information about, for example, rates of chemical reactions. [5]
  5. These effects (g-factor, hyperfine coupling, zero field splitting, exchange coupling) in an atom or molecule may not be the same for all orientations of an unpaired electron in an external magnetic field. This anisotropy depends upon the electronic structure of the atom or molecule (e.g., free radical) in question, and so can provide information about the atomic or molecular orbital containing the unpaired electron.

The g factor

Knowledge of the g-factor can give information about a paramagnetic center's electronic structure. An unpaired electron responds not only to a spectrometer's applied magnetic field but also to any local magnetic fields of atoms or molecules. The effective field experienced by an electron is thus written

where includes the effects of local fields ( can be positive or negative). Therefore, the resonance condition (above) is rewritten as follows:

The quantity is denoted and called simply the g-factor, so that the final resonance equation becomes

This last equation is used to determine in an EPR experiment by measuring the field and the frequency at which resonance occurs. If does not equal , the implication is that the ratio of the unpaired electron's spin magnetic moment to its angular momentum differs from the free-electron value. Since an electron's spin magnetic moment is constant (approximately the Bohr magneton), then the electron must have gained or lost angular momentum through spin–orbit coupling. Because the mechanisms of spin–orbit coupling are well understood, the magnitude of the change gives information about the nature of the atomic or molecular orbital containing the unpaired electron.

The shape of a powder-pattern EPR spectrum changes according to the distribution of the
g
{\displaystyle g}
matrix principal values EPR g Matrix Rhombicity.svg
The shape of a powder-pattern EPR spectrum changes according to the distribution of the matrix principal values

In general, the g factor is not a number but a 3×3 matrix. The principal axes of this tensor are determined by the local fields, for example, by the local atomic arrangement around the unpaired spin in a solid or in a molecule. Choosing an appropriate coordinate system (say, x,y,z) allows one to "diagonalize" this tensor, thereby reducing the maximal number of its components from 9 to 3: gxx, gyy and gzz. For a single spin experiencing only Zeeman interaction with an external magnetic field, the position of the EPR resonance is given by the expression gxxBx + gyyBy + gzzBz. Here Bx, By and Bz are the components of the magnetic field vector in the coordinate system (x,y,z); their magnitudes change as the field is rotated, so does the frequency of the resonance. For a large ensemble of randomly oriented spins (as in a fluid solution), the EPR spectrum consists of three peaks of characteristic shape at frequencies gxxB0, gyyB0 and gzzB0.

In first-derivative spectrum, the low-frequency peak is positive, the high-frequency peak is negative, and the central peak is bipolar. Such situations are commonly observed in powders, and the spectra are therefore called "powder-pattern spectra". In crystals, the number of EPR lines is determined by the number of crystallographically equivalent orientations of the EPR spin (called "EPR center").

At higher temperatures, the three peaks coalesce to a singlet, corresponding to giso, for isotropic. The relationship between giso and the components is:

One elementary step in analyzing an EPR spectrum is to compare giso with the g-factor for the free electron, ge. Metal-based radicals giso is typically well above ge whereas organic radicals, giso ~ ge.

The determination of the absolute value of the g factor is challenging due to the lack of a precise estimate of the local magnetic field at the sample location. Therefore, typically so-called g factor standards are measured together with the sample of interest. In the common spectrum, the spectral line of the g factor standard is then used as a reference point to determine the g factor of the sample. For the initial calibration of g factor standards, Herb et al. introduced a precise procedure by using double resonance techniques based on the Overhauser shift. [6]

Hyperfine coupling

Since the source of an EPR spectrum is a change in an electron's spin state, the EPR spectrum for a radical (S = 1/2 system) would consist of one line. Greater complexity arises because the spin couples with nearby nuclear spins. The magnitude of the coupling is proportional to the magnetic moment of the coupled nuclei and depends on the mechanism of the coupling. Coupling is mediated by two processes, dipolar (through space) and isotropic (through bond).

This coupling introduces additional energy states and, in turn, multi-lined spectra. In such cases, the spacing between the EPR spectral lines indicates the degree of interaction between the unpaired electron and the perturbing nuclei. The hyperfine coupling constant of a nucleus is directly related to the spectral line spacing and, in the simplest cases, is essentially the spacing itself. [7]

Two common mechanisms by which electrons and nuclei interact are the Fermi contact interaction and by dipolar interaction. The former applies largely to the case of isotropic interactions (independent of sample orientation in a magnetic field) and the latter to the case of anisotropic interactions (spectra dependent on sample orientation in a magnetic field). Spin polarization is a third mechanism for interactions between an unpaired electron and a nuclear spin, being especially important for -electron organic radicals, such as the benzene radical anion. The symbols "a" or "A" are used for isotropic hyperfine coupling constants, while "B" is usually employed for anisotropic hyperfine coupling constants. [8]

In many cases, the isotropic hyperfine splitting pattern for a radical freely tumbling in a solution (isotropic system) can be predicted.

Multiplicity

Simulated EPR spectra of the methyl and methoxymethyl radicals Methyl and Methoxymethyl Hyperfine Splitting.svg
Simulated EPR spectra of the methyl and methoxymethyl radicals
  • For a radical having M equivalent nuclei, each with a spin of I, the number of EPR lines expected is 2MI + 1. As an example, the methyl radical, CH3, has three 1H nuclei, each with I = 1/2, and so the number of lines expected is 2MI + 1 = 2(3)(1/2) + 1 = 4, which is as observed.
  • For a radical having M1 equivalent nuclei, each with a spin of I1, and a group of M2 equivalent nuclei, each with a spin of I2, the number of lines expected is (2M1I1 + 1) (2M2I2 + 1). As an example, the methoxymethyl radical, H
    2
    C(OCH
    3
    )
    has two equivalent 1H nuclei, each with I = 1/2 and three equivalent 1H nuclei each with I = 1/2, and so the number of lines expected is (2M1I1 + 1) (2M2I2 + 1) = [2(2)(1/2) + 1] [2(3)(1/2) + 1] = 3×4 = 12, again as observed.
  • The above can be extended to predict the number of lines for any number of nuclei.

While it is easy to predict the number of lines, the reverse problem, unraveling a complex multi-line EPR spectrum and assigning the various spacings to specific nuclei, is more difficult.

In the often encountered case of I = 1/2 nuclei (e.g., 1H, 19F, 31P), the line intensities produced by a population of radicals, each possessing M equivalent nuclei, will follow Pascal's triangle. For example, the spectrum at the right shows that the three 1H nuclei of the CH3 radical give rise to 2MI + 1 = 2(3)(1/2) + 1 = 4 lines with a 1:3:3:1 ratio. The line spacing gives a hyperfine coupling constant of aH = 23 G for each of the three 1H nuclei. Note again that the lines in this spectrum are first derivatives of absorptions.

As a second example, the methoxymethyl radical, H3COCH2. the OCH2 center will give an overall 1:2:1 EPR pattern, each component of which is further split by the three methoxy hydrogens into a 1:3:3:1 pattern to give a total of 3×4 = 12 lines, a triplet of quartets. A simulation of the observed EPR spectrum is shown and agrees with the 12-line prediction and the expected line intensities. Note that the smaller coupling constant (smaller line spacing) is due to the three methoxy hydrogens, while the larger coupling constant (line spacing) is from the two hydrogens bonded directly to the carbon atom bearing the unpaired electron. It is often the case that coupling constants decrease in size with distance from a radical's unpaired electron, but there are some notable exceptions, such as the ethyl radical (CH2CH3).

Resonance linewidth definition

Resonance linewidths are defined in terms of the magnetic induction B and its corresponding units, and are measured along the x axis of an EPR spectrum, from a line's center to a chosen reference point of the line. These defined widths are called halfwidths and possess some advantages: for asymmetric lines, values of left and right halfwidth can be given. The halfwidth is the distance measured from the line's center to the point in which absorption value has half of maximal absorption value in the center of resonance line. First inclination width is a distance from center of the line to the point of maximal absorption curve inclination. In practice, a full definition of linewidth is used. For symmetric lines, halfwidth , and full inclination width .

Applications

This low-temperature ESR-STM in the Center for Quantum Nanoscience is one of the first STMs globally to measure electron spin resonance on single atoms. ESR-STM at QNS in Ewha - front view.jpg
This low-temperature ESR-STM in the Center for Quantum Nanoscience is one of the first STMs globally to measure electron spin resonance on single atoms.

EPR/ESR spectroscopy is used in various branches of science, such as biology, chemistry and physics, for the detection and identification of free radicals in the solid, liquid, or gaseous state, [9] and in paramagnetic centers such as F-centers.

Chemical reactions

EPR is a sensitive, specific method for studying both radicals formed in chemical reactions and the reactions themselves. For example, when ice (solid H2O) is decomposed by exposure to high-energy radiation, radicals such as H, OH, and HO2 are produced. Such radicals can be identified and studied by EPR. Organic and inorganic radicals can be detected in electrochemical systems and in materials exposed to UV light. In many cases, the reactions to make the radicals and the subsequent reactions of the radicals are of interest, while in other cases EPR is used to provide information on a radical's geometry and the orbital of the unpaired electron.

EPR is useful in homogeneous catalysis research for characterization of paramagnetic complexes and reactive intermediates. [10] EPR spectroscopy is a particularly useful tool to investigate their electronic structures, which is fundamental to understand their reactivity.

EPR/ESR spectroscopy can be applied only to systems in which the balance between radical decay and radical formation keeps the free radicals concentration above the detection limit of the spectrometer used. This can be a particularly severe problem in studying reactions in liquids. An alternative approach is to slow down reactions by studying samples held at cryogenic temperatures, such as 77 K (liquid nitrogen) or 4.2 K (liquid helium). An example of this work is the study of radical reactions in single crystals of amino acids exposed to x-rays, work that sometimes leads to activation energies and rate constants for radical reactions.

Medical and biological

Medical and biological applications of EPR also exist. Although radicals are very reactive, so they do not normally occur in high concentrations in biology, special reagents have been developed to attach "spin labels", also called "spin probes", to molecules of interest. Specially-designed nonreactive radical molecules can attach to specific sites in a biological cell, and EPR spectra then give information on the environment of the spin labels. Spin-labeled fatty acids have been extensively used to study dynamic organisation of lipids in biological membranes, [11] lipid-protein interactions [12] and temperature of transition of gel to liquid crystalline phases. [13] Injection of spin-labeled molecules allows for electron resonance imaging of living organisms.

A type of dosimetry system has been designed for reference standards and routine use in medicine, based on EPR signals of radicals from irradiated polycrystalline α-alanine (the alanine deamination radical, the hydrogen abstraction radical, and the (CO(OH))=C(CH3)NH+2 radical). This method is suitable for measuring gamma and X-rays, electrons, protons, and high-linear energy transfer (LET) radiation of doses in the 1 Gy to 100 kGy range. [14]

EPR can be used to measure microviscosity and micropolarity within drug delivery systems as well as the characterization of colloidal drug carriers. [15]

The study of radiation-induced free radicals in biological substances (for cancer research) poses the additional problem that tissue contains water, and water (due to its electric dipole moment) has a strong absorption band in the microwave region used in EPR spectrometers.[ citation needed ]

Material characterization

EPR/ESR spectroscopy is used in geology and archaeology as a dating tool. It can be applied to a wide range of materials such as organic shales, carbonates, sulfates, phosphates, silica or other silicates. [16] When applied to shales, the EPR data correlates to the maturity of the kerogen in the shale. [17]

EPR spectroscopy has been used to measure properties of crude oil, such as determination of asphaltene and vanadium content. [18] The free-radical component of the EPR signal is proportional to the amount of asphaltene in the oil regardless of any solvents, or precipitants that may be present in that oil. [19] When the oil is subject to a precipitant such as hexane, heptane, pyridine however, then much of the asphaltene can be subsequently extracted from the oil by gravimetric techniques. The EPR measurement of that extract will then be function of the polarity of the precipitant that was used. [20] Consequently, it is preferable to apply the EPR measurement directly to the crude. In the case that the measurement is made upstream of a separator (oil production), then it may also be necessary determine the oil fraction within the crude (e.g., if a certain crude contains 80% oil and 20% water, then the EPR signature will be 80% of the signature of downstream of the separator).

EPR has been used by archaeologists for the dating of teeth. Radiation damage over long periods of time creates free radicals in tooth enamel, which can then be examined by EPR and, after proper calibration, dated. Similarly, material extracted from the teeth of people during dental procedures can be used to quantify their cumulative exposure to ionizing radiation. People (and other mammals [21] ) exposed to radiation from the atomic bombs, [22] from the Chernobyl disaster, [23] [24] and from the Fukushima accident have been examined by this method. [25]

Radiation-sterilized foods have been examined with EPR spectroscopy, aiming to develop methods to determine whether a food sample has been irradiated and to what dose. [26]

Other applications

In the field of quantum computing, pulsed EPR is used to control the state of electron spin qubits in materials such as diamond, silicon and gallium arsenide.[ citation needed ]

High-field high-frequency measurements

High-field high-frequency EPR measurements are sometimes needed to detect subtle spectroscopic details. However, for many years the use of electromagnets to produce the needed fields above 1.5 T was impossible, due principally to limitations of traditional magnet materials. The first multifunctional millimeter EPR spectrometer with a superconducting solenoid was described in the early 1970s by Prof. Y. S. Lebedev's group (Russian Institute of Chemical Physics, Moscow) in collaboration with L. G. Oranski's group (Ukrainian Physics and Technics Institute, Donetsk), which began working in the Institute of Problems of Chemical Physics, Chernogolovka around 1975. [27] Two decades later, a W-band EPR spectrometer was produced as a small commercial line by the German Bruker Company, initiating the expansion of W-band EPR techniques into medium-sized academic laboratories.

WavebandLSCXPKQUVEWFDJ
30010075302012.58.564.643.22.72.11.61.10.83
1341015243550657595111140190285360
0.030.110.140.330.540.861.251.82.32.73.53.94.96.810.212.8
Variation in the EPR spectrum of the TEMPO nitroxide radical as the microwave band (energy of excitation) changes. Note the improved resolution as frequency rises (neglecting the influence of g strain). EPR-bands.svg
Variation in the EPR spectrum of the TEMPO nitroxide radical as the microwave band (energy of excitation) changes. Note the improved resolution as frequency rises (neglecting the influence of g strain).

The EPR waveband is stipulated by the frequency or wavelength of a spectrometer's microwave source (see Table).

EPR experiments often are conducted at X and, less commonly, Q bands, mainly due to the ready availability of the necessary microwave components (which originally were developed for radar applications). A second reason for widespread X and Q band measurements is that electromagnets can reliably generate fields up to about 1 tesla. However, the low spectral resolution over g-factor at these wavebands limits the study of paramagnetic centers with comparatively low anisotropic magnetic parameters. Measurements at > 40 GHz, in the millimeter wavelength region, offer the following advantages:

  1. EPR spectra are simplified due to the reduction of second-order effects at high fields.
  2. Increase in orientation selectivity and sensitivity in the investigation of disordered systems.
  3. The informativity and precision of pulse methods, e.g., ENDOR also increase at high magnetic fields.
  4. Accessibility of spin systems with larger zero-field splitting due to the larger microwave quantum energy h.
  5. The higher spectral resolution over g-factor, which increases with irradiation frequency and external magnetic field B0. This is used to investigate the structure, polarity, and dynamics of radical microenvironments in spin-modified organic and biological systems through the spin label and probe method. The figure shows how spectral resolution improves with increasing frequency.
  6. Saturation of paramagnetic centers occurs at a comparatively low microwave polarizing field B1, due to the exponential dependence of the number of excited spins on the radiation frequency . This effect can be successfully used to study the relaxation and dynamics of paramagnetic centers as well as of superslow motion in the systems under study.
  7. The cross-relaxation of paramagnetic centers decreases dramatically at high magnetic fields, making it easier to obtain more-precise and more-complete information about the system under study. [27]

This was demonstrated experimentally in the study of various biological, polymeric and model systems at D-band EPR. [28]

Hardware components

3D model of a typical X-band CW-EPR spectrometer X-band CW EPR spectrometer model.png
3D model of a typical X-band CW-EPR spectrometer

Microwave bridge

The microwave bridge contains both the microwave source and the detector. [29] Older spectrometers used a vacuum tube called a klystron to generate microwaves, but modern spectrometers use a Gunn diode. Immediately after the microwave source there is an isolator which serves to attenuate any reflections back to the source which would result in fluctuations in the microwave frequency. [4] The microwave power from the source is then passed through a directional coupler which splits the microwave power into two paths, one directed towards the cavity and the other the reference arm. Along both paths there is a variable attenuator that facilitates the precise control of the flow of microwave power. This in turn allows for accurate control over the intensity of the microwaves subjected to the sample. On the reference arm, after the variable attenuator there is a phase shifter that sets a defined phase relationship between the reference and reflected signal which permits phase sensitive detection.

Most EPR spectrometers are reflection spectrometers, meaning that the detector should only be exposed to microwave radiation coming back from the cavity. This is achieved by the use of a device known as the circulator which directs the microwave radiation (from the branch that is heading towards the cavity) into the cavity. Reflected microwave radiation (after absorption by the sample) is then passed through the circulator towards the detector, ensuring it does not go back to the microwave source. The reference signal and reflected signal are combined and passed to the detector diode which converts the microwave power into an electrical current.

Reference arm

At low energies (less than 1 μW) the diode current is proportional to the microwave power and the detector is referred to as a square-law detector. At higher power levels (greater than 1 mW) the diode current is proportional to the square root of the microwave power and the detector is called a linear detector. In order to obtain optimal sensitivity as well as quantitative information the diode should be operating within the linear region. To ensure the detector is operating at that level the reference arm serves to provide a "bias".

Magnet

In an EPR spectrometer the magnetic assembly includes the magnet with a dedicated power supply as well as a field sensor or regulator such as a Hall probe. EPR spectrometers use one of two types of magnet which is determined by the operating microwave frequency (which determine the range of magnetic field strengths required). The first is an electromagnet which are generally capable of generating field strengths of up to 1.5 T making them suitable for measurements using the Q-band frequency. In order to generate field strengths appropriate for W-band and higher frequency operation superconducting magnets are employed. The magnetic field is homogeneous across the sample volume and has a high stability at static field.

Microwave resonator (cavity)

The microwave resonator is designed to enhance the microwave magnetic field at the sample in order to induce EPR transitions. It is a metal box with a rectangular or cylindrical shape that resonates with microwaves (like an organ pipe with sound waves). At the resonance frequency of the cavity microwaves remain inside the cavity and are not reflected back. Resonance means the cavity stores microwave energy and its ability to do this is given by the quality factor Q, defined by the following equation:

The higher the value of Q the higher the sensitivity of the spectrometer. The energy dissipated is the energy lost in one microwave period. Energy may be lost to the side walls of the cavity as microwaves may generate currents which in turn generate heat. A consequence of resonance is the creation of a standing wave inside the cavity. Electromagnetic standing waves have their electric and magnetic field components exactly out of phase. This provides an advantage as the electric field provides non-resonant absorption of the microwaves, which in turn increases the dissipated energy and reduces Q. To achieve the largest signals and hence sensitivity the sample is positioned such that it lies within the magnetic field maximum and the electric field minimum. When the magnetic field strength is such that an absorption event occurs, the value of Q will be reduced due to the extra energy loss. This results in a change of impedance which serves to stop the cavity from being critically coupled. This means microwaves will now be reflected back to the detector (in the microwave bridge) where an EPR signal is detected. [30]

Pulsed electron paramagnetic resonance

The dynamics of electron spins are best studied with pulsed measurements. [31] Microwave pulses typically 10–100 ns long are used to control the spins in the Bloch sphere. The spin–lattice relaxation time can be measured with an inversion recovery experiment.

As with pulsed NMR, the Hahn echo is central to many pulsed EPR experiments. A Hahn echo decay experiment can be used to measure the dephasing time, as shown in the animation below. The size of the echo is recorded for different spacings of the two pulses. This reveals the decoherence, which is not refocused by the pulse. In simple cases, an exponential decay is measured, which is described by the time.

GWM HahnEchoDecay.gif

Pulsed electron paramagnetic resonance could be advanced into electron nuclear double resonance spectroscopy (ENDOR), which utilizes waves in the radio frequencies. Since different nuclei with unpaired electrons respond to different wavelengths, radio frequencies are required at times. Since the results of the ENDOR gives the coupling resonance between the nuclei and the unpaired electron, the relationship between them can be determined.

See also

Related Research Articles

<span class="mw-page-title-main">Paramagnetism</span> Weak, attractive magnetism possessed by most elements and some compounds

Paramagnetism is a form of magnetism whereby some materials are weakly attracted by an externally applied magnetic field, and form internal, induced magnetic fields in the direction of the applied magnetic field. In contrast with this behavior, diamagnetic materials are repelled by magnetic fields and form induced magnetic fields in the direction opposite to that of the applied magnetic field. Paramagnetic materials include most chemical elements and some compounds; they have a relative magnetic permeability slightly greater than 1 and hence are attracted to magnetic fields. The magnetic moment induced by the applied field is linear in the field strength and rather weak. It typically requires a sensitive analytical balance to detect the effect and modern measurements on paramagnetic materials are often conducted with a SQUID magnetometer.

Fourier-transform spectroscopy is a measurement technique whereby spectra are collected based on measurements of the coherence of a radiative source, using time-domain or space-domain measurements of the radiation, electromagnetic or not. It can be applied to a variety of types of spectroscopy including optical spectroscopy, infrared spectroscopy, nuclear magnetic resonance (NMR) and magnetic resonance spectroscopic imaging (MRSI), mass spectrometry and electron spin resonance spectroscopy.

<span class="mw-page-title-main">Hyperfine structure</span> Small shifts and splittings in the energy levels of atoms, molecules and ions

In atomic physics, hyperfine structure is defined by small shifts in otherwise degenerate energy levels and the resulting splittings in those energy levels of atoms, molecules, and ions, due to electromagnetic multipole interaction between the nucleus and electron clouds.

<span class="mw-page-title-main">Rotational spectroscopy</span> Spectroscopy of quantized rotational states of gases

Rotational spectroscopy is concerned with the measurement of the energies of transitions between quantized rotational states of molecules in the gas phase. The rotational spectrum of polar molecules can be measured in absorption or emission by microwave spectroscopy or by far infrared spectroscopy. The rotational spectra of non-polar molecules cannot be observed by those methods, but can be observed and measured by Raman spectroscopy. Rotational spectroscopy is sometimes referred to as pure rotational spectroscopy to distinguish it from rotational-vibrational spectroscopy where changes in rotational energy occur together with changes in vibrational energy, and also from ro-vibronic spectroscopy where rotational, vibrational and electronic energy changes occur simultaneously.

Nuclear quadrupole resonance spectroscopy or NQR is a chemical analysis technique related to nuclear magnetic resonance (NMR). Unlike NMR, NQR transitions of nuclei can be detected in the absence of a magnetic field, and for this reason NQR spectroscopy is referred to as "zero Field NMR". The NQR resonance is mediated by the interaction of the electric field gradient (EFG) with the quadrupole moment of the nuclear charge distribution. Unlike NMR, NQR is applicable only to solids and not liquids, because in liquids the electric field gradient at the nucleus averages to zero. Because the EFG at the location of a nucleus in a given substance is determined primarily by the valence electrons involved in the particular bond with other nearby nuclei, the NQR frequency at which transitions occur is unique for a given substance. A particular NQR frequency in a compound or crystal is proportional to the product of the nuclear quadrupole moment, a property of the nucleus, and the EFG in the neighborhood of the nucleus. It is this product which is termed the nuclear quadrupole coupling constant for a given isotope in a material and can be found in tables of known NQR transitions. In NMR, an analogous but not identical phenomenon is the coupling constant, which is also the result of an internuclear interaction between nuclei in the analyte.

In physics, the spin quantum number is a quantum number that describes the intrinsic angular momentum of an electron or other particle. It has the same value for all particles of the same type, such as s = 1/2 for all electrons. It is an integer for all bosons, such as photons, and a half-odd-integer for all fermions, such as electrons and protons.

Dynamic nuclear polarization (DNP) results from transferring spin polarization from electrons to nuclei, thereby aligning the nuclear spins to the extent that electron spins are aligned. Note that the alignment of electron spins at a given magnetic field and temperature is described by the Boltzmann distribution under the thermal equilibrium. It is also possible that those electrons are aligned to a higher degree of order by other preparations of electron spin order such as: chemical reactions, optical pumping and spin injection. DNP is considered one of several techniques for hyperpolarization. DNP can also be induced using unpaired electrons produced by radiation damage in solids.

In nuclear magnetic resonance (NMR) spectroscopy, the chemical shift is the resonant frequency of an atomic nucleus relative to a standard in a magnetic field. Often the position and number of chemical shifts are diagnostic of the structure of a molecule. Chemical shifts are also used to describe signals in other forms of spectroscopy such as photoemission spectroscopy.

Microwave spectroscopy is the spectroscopy method that employs microwaves, i.e. electromagnetic radiation at GHz frequencies, for the study of matter.

CIDNP, often pronounced like "kidnip", is a nuclear magnetic resonance (NMR) technique that is used to study chemical reactions that involve radicals. It detects the non-Boltzmann (non-thermal) nuclear spin state distribution produced in these reactions as enhanced absorption or emission signals.

<span class="mw-page-title-main">Nuclear magnetic resonance spectroscopy</span> Laboratory technique

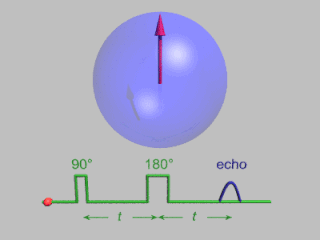
Nuclear magnetic resonance spectroscopy, most commonly known as NMR spectroscopy or magnetic resonance spectroscopy (MRS), is a spectroscopic technique based on re-orientation of atomic nuclei with non-zero nuclear spins in an external magnetic field. This re-orientation occurs with absorption of electromagnetic radiation in the radio frequency region from roughly 4 to 900 MHz, which depends on the isotopic nature of the nucleus and increased proportionally to the strength of the external magnetic field. Notably, the resonance frequency of each NMR-active nucleus depends on its chemical environment. As a result, NMR spectra provide information about individual functional groups present in the sample, as well as about connections between nearby nuclei in the same molecule. As the NMR spectra are unique or highly characteristic to individual compounds and functional groups, NMR spectroscopy is one of the most important methods to identify molecular structures, particularly of organic compounds.

Ferromagnetic resonance, or FMR, is coupling between an electromagnetic wave and the magnetization of a medium through which it passes. This coupling induces a significant loss of power of the wave. The power is absorbed by the precessing magnetization of the material and lost as heat. For this coupling to occur, the frequency of the incident wave must be equal to the precession frequency of the magnetization and the polarization of the wave must match the orientation of the magnetization.

<span class="mw-page-title-main">Nuclear magnetic resonance</span> Spectroscopic technique based on change of nuclear spin state

Nuclear magnetic resonance (NMR) is a physical phenomenon in which nuclei in a strong constant magnetic field are perturbed by a weak oscillating magnetic field and respond by producing an electromagnetic signal with a frequency characteristic of the magnetic field at the nucleus. This process occurs near resonance, when the oscillation frequency matches the intrinsic frequency of the nuclei, which depends on the strength of the static magnetic field, the chemical environment, and the magnetic properties of the isotope involved; in practical applications with static magnetic fields up to ca. 20 tesla, the frequency is similar to VHF and UHF television broadcasts (60–1000 MHz). NMR results from specific magnetic properties of certain atomic nuclei. Nuclear magnetic resonance spectroscopy is widely used to determine the structure of organic molecules in solution and study molecular physics and crystals as well as non-crystalline materials. NMR is also routinely used in advanced medical imaging techniques, such as in magnetic resonance imaging (MRI). The original application of NMR to condensed matter physics is nowadays mostly devoted to strongly correlated electron systems. It reveals large many-body couplings by fast broadband detection and it should not to be confused with solid state NMR, which aims at removing the effect of the same couplings by Magic Angle Spinning techniques.

Electron nuclear double resonance (ENDOR) is a magnetic resonance technique for elucidating the molecular and electronic structure of paramagnetic species. The technique was first introduced to resolve interactions in electron paramagnetic resonance (EPR) spectra. It is currently practiced in a variety of modalities, mainly in the areas of biophysics and heterogeneous catalysis.

Acoustic paramagnetic resonance (APR) is a phenomenon of resonant absorption of sound by a system of magnetic particles placed in an external magnetic field. It occurs when the energy of the sound wave quantum becomes equal to the splitting of the energy levels of the particles, the splitting being induced by the magnetic field. APR is a variation of electron paramagnetic resonance (EPR) where the acoustic rather than electromagnetic waves are absorbed by the studied sample. APR was theoretically predicted in 1952, independently by Semen Altshuler and Alfred Kastler, and was experimentally observed by W. G. Proctor and W. H. Tanttila in 1955.

Magnetochemistry is concerned with the magnetic properties of chemical compounds. Magnetic properties arise from the spin and orbital angular momentum of the electrons contained in a compound. Compounds are diamagnetic when they contain no unpaired electrons. Molecular compounds that contain one or more unpaired electrons are paramagnetic. The magnitude of the paramagnetism is expressed as an effective magnetic moment, μeff. For first-row transition metals the magnitude of μeff is, to a first approximation, a simple function of the number of unpaired electrons, the spin-only formula. In general, spin–orbit coupling causes μeff to deviate from the spin-only formula. For the heavier transition metals, lanthanides and actinides, spin–orbit coupling cannot be ignored. Exchange interaction can occur in clusters and infinite lattices, resulting in ferromagnetism, antiferromagnetism or ferrimagnetism depending on the relative orientations of the individual spins.

<span class="mw-page-title-main">Pulsed electron paramagnetic resonance</span>

Pulsed electron paramagnetic resonance (EPR) is an electron paramagnetic resonance technique that involves the alignment of the net magnetization vector of the electron spins in a constant magnetic field. This alignment is perturbed by applying a short oscillating field, usually a microwave pulse. One can then measure the emitted microwave signal which is created by the sample magnetization. Fourier transformation of the microwave signal yields an EPR spectrum in the frequency domain. With a vast variety of pulse sequences it is possible to gain extensive knowledge on structural and dynamical properties of paramagnetic compounds. Pulsed EPR techniques such as electron spin echo envelope modulation (ESEEM) or pulsed electron nuclear double resonance (ENDOR) can reveal the interactions of the electron spin with its surrounding nuclear spins.

<span class="mw-page-title-main">Paramagnetic nuclear magnetic resonance spectroscopy</span> Spectroscopy of paramagnetic compounds via NMR

Paramagnetic nuclear magnetic resonance spectroscopy refers to nuclear magnetic resonance (NMR) spectroscopy of paramagnetic compounds. Although most NMR measurements are conducted on diamagnetic compounds, paramagnetic samples are also amenable to analysis and give rise to special effects indicated by a wide chemical shift range and broadened signals. Paramagnetism diminishes the resolution of an NMR spectrum to the extent that coupling is rarely resolved. Nonetheless spectra of paramagnetic compounds provide insight into the bonding and structure of the sample. For example, the broadening of signals is compensated in part by the wide chemical shift range (often 200 ppm in 1H NMR). Since paramagnetism leads to shorter relaxation times (T1), the rate of spectral acquisition can be high.

Electric dipole spin resonance (EDSR) is a method to control the magnetic moments inside a material using quantum mechanical effects like the spin–orbit interaction. Mainly, EDSR allows to flip the orientation of the magnetic moments through the use of electromagnetic radiation at resonant frequencies. EDSR was first proposed by Emmanuel Rashba.

In physics, optically detected magnetic resonance (ODMR) is a double resonance technique by which the electron spin state of a crystal defect may be optically pumped for spin initialisation and readout.

References

  1. Zavoisky E (1945). "Spin-magnetic resonance in paramagnetics". J. Phys. (USSR). 9: 245.
  2. Zavoisky E (1944). Paramagnetic Absorption in Perpendicular and Parallel Fields for Salts, Solutions and Metals (PhD thesis).
  3. Odom B, Hanneke D, D'Urso B, Gabrielse G (July 2006). "New measurement of the electron magnetic moment using a one-electron quantum cyclotron". Physical Review Letters. 97 (3): 030801. Bibcode:2006PhRvL..97c0801O. doi:10.1103/PhysRevLett.97.030801. PMID   16907490.
  4. 1 2 Chechik V, Carter E, Murphy D (2016). Electron Paramagnetic Resonance. Oxford, UK: Oxford University Press. ISBN   978-0-19-872760-6. OCLC   945390515.
  5. Levine IN (1975). Molecular Spectroscopy . Wiley & Sons, Inc. p.  380. ISBN   978-0-471-53128-9.
  6. Herb K, Tschaggelar R, Denninger G, Jeschke G (April 2018). "Double resonance calibration of g factor standards: Carbon fibers as a high precision standard". Journal of Magnetic Resonance. 289: 100–106. Bibcode:2018JMagR.289..100H. doi: 10.1016/j.jmr.2018.02.006 . hdl: 20.500.11850/245192 . PMID   29476927.
  7. Encyclopedia of Spectroscopy and Spectrometry. Academic Press. 2016. pp. 521, 528. ISBN   9780128032251.
  8. Strictly speaking, "a" refers to the hyperfine splitting constant, a line spacing measured in magnetic field units, while A and B refer to hyperfine coupling constants measured in frequency units. Splitting and coupling constants are proportional, but not identical. The book by Wertz and Bolton has more information (pp. 46 and 442). Wertz JE, Bolton JR (1972). Electron spin resonance: Elementary theory and practical applications. New York: McGraw-Hill.
  9. Wertz, John, and James R Bolton. Electron Spin Resonance: Elementary Theory and Practical Application. Chapman and Hall, 1986.
  10. Goswami, Monalisa; Chirila, Andrei; Rebreyend, Christophe; de Bruin, Bas (2015-09-01). "EPR Spectroscopy as a Tool in Homogeneous Catalysis Research". Topics in Catalysis. 58 (12): 719–750. doi: 10.1007/s11244-015-0414-9 . ISSN   1572-9028.
  11. Yashroy RC (1990). "Magnetic resonance studies of dynamic organisation of lipids in chloroplast membranes". Journal of Biosciences. 15 (4): 281–288. doi:10.1007/BF02702669. S2CID   360223.
  12. YashRoy RC (January 1991). "Protein heat denaturation and study of membrane lipid-protein interactions by spin label ESR". Journal of Biochemical and Biophysical Methods. 22 (1): 55–9. doi:10.1016/0165-022X(91)90081-7. PMID   1848569.
  13. YashRoy RC (1990). "Determination of membrane lipid phase transition temperature from 13C-NMR intensities". Journal of Biochemical and Biophysical Methods. 20 (4): 353–6. doi:10.1016/0165-022X(90)90097-V. PMID   2365951.
  14. Chu RD, McLaughlin WL, Miller A, Sharpe PH (December 2008). "5. Dosimetry systems". Journal of the ICRU. 8 (2): 29–70. doi:10.1093/jicru/ndn027. PMID   24174520.
  15. Kempe S, Metz H, Mader K (January 2010). "Application of electron paramagnetic resonance (EPR) spectroscopy and imaging in drug delivery research - chances and challenges". European Journal of Pharmaceutics and Biopharmaceutics. 74 (1): 55–66. doi:10.1016/j.ejpb.2009.08.007. PMID   19723580.
  16. Ikeya M (1993). New Applications of Electron Spin Resonance. doi:10.1142/1854. ISBN   978-981-02-1199-8.
  17. Bakr MY, Akiyama M, Sanada Y (1990). "ESR assessment of kerogen maturation and its relation with petroleum genesis". Organic Geochemistry. 15 (6): 595–599. Bibcode:1990OrGeo..15..595B. doi:10.1016/0146-6380(90)90104-8.
  18. Yen, T. F.; Erdman, J. G.; Saraceno, A. J. (1962). "Investigation of the nature of free radicals in petroleum asphaltenes and related substance by electron spin resonance". Analytical Chemistry. 34 (6): 694–700. doi:10.1021/ac60186a034.
  19. Lovell J, Abdullah D, Punnapala S, Al Daghar K, Kulbrandstad O, Madem S, Meza D (Nov 2020). "A Chemical IoT System for Flow Assurance - From Single-Well Applications to Field Implementation". SPE-203286-MS. ADIPEC. doi:10.2118/203286-MS.
  20. Khulbe K, Mann R, Lu B, Lamarche G, Lamarche A (1992). "Effects of solvents on free radicals of bitumen and asphaltenes". Fuel Processing Technology. 32 (3): 133–141. doi:10.1016/0378-3820(92)90027-N.
  21. Azumi Todaka; Shin Toyoda; Masahiro Natsuhori; Keiji Okada; Itaru Sato; Hiroshi Sato; Jun Sasaki (August 2020). "ESR assessment of tooth enamel dose from cattle bred in areas contaminated due to the Fukushima Dai-ichi nuclear power plant accident". Radiation Measurements. 136 (106357): 106357. Bibcode:2020RadM..136j6357T. doi:10.1016/j.radmeas.2020.106357. S2CID   218993842.
  22. Nori Nakamura; Yuko Hirai; Yoshiaki Kodama (2012). "Gamma-ray and neutron dosimetry by EPR and AMS, using tooth enamel from atomic-bomb survivors: a mini review". Radiation Protection Dosimetry. 149 (1): 79–83. doi: 10.1093/rpd/ncr478 . PMID   22267275.
  23. Gualtieri G, Colacicchi S, Sgattoni R, Giannoni M (July 2001). "The Chernobyl accident: EPR dosimetry on dental enamel of children". Applied Radiation and Isotopes. 55 (1): 71–9. doi:10.1016/S0969-8043(00)00351-1. PMID   11339534.
  24. Chumak V, Sholom S, Pasalskaya L (1999). "Application of High Precision EPR Dosimetry with Teeth for Reconstruction of Doses to Chernobyl Populations". Radiation Protection Dosimetry. 84: 515–520. doi:10.1093/oxfordjournals.rpd.a032790.
  25. S. Toyoda; A. Kondo; K. Zumadilov; M. Hoshi; C. Miyazawa; A. Ivannikov (September 2011). "ESR measurements of background doses in teeth of Japanese residents". Radiation Measurements. 46 (9): 797–800. Bibcode:2011RadM...46..797T. doi:10.1016/j.radmeas.2011.05.008.
  26. Chauhan, S. K.; et al. (2008). "Detection Methods for Irradiated Foods". Comprehensive Reviews in Food Science and Food Safety. 8: 4. doi: 10.1111/j.1541-4337.2008.00063.x .
  27. 1 2 3 EPR of low-dimensional systems
  28. Krinichnyi VI (1995). 2-mm Wave Band EPR Spectroscopy of Condensed Systems. Boca Raton, Fl: CRC Press.
  29. Eaton GR, Eaton SS, Barr DP, Weber RT (2010-04-10). Quantitative EPR. Springer Science & Business Media. ISBN   978-3-211-92948-3.
  30. Eaton GR, Eaton SS, Barr DP, Weber RT (2010). "Basics of Continuous Wave EPR". Quantitative EPR: 1–14. doi:10.1007/978-3-211-92948-3_1. ISBN   978-3-211-92947-6.
  31. Schweiger A, Jeschke G (2001). Principles of Pulse Electron Paramagnetic Resonance. Oxford University Press. ISBN   978-0-19-850634-8.