Tropical cyclones in 2005

Last updated

Tropical cyclones in 2005
Tropical cyclones in 2005.png
Year summary map
Year boundaries
First system 07
FormedJanuary 4, 2005
Last system Zeta
DissipatedJanuary 6, 2006
Strongest system
Name Wilma
Lowest pressure882 mbar (hPa); 26.05 inHg
Longest lasting system
Name Kenneth
Duration16 days
Year statistics
Total systems141
Named systems94
Total fatalities4,459 total
Total damage$181.591 billion (2005 USD)
Related articles
Other years
2003, 2004, 2005, 2006, 2007
Cyclones Nancy (right) and Olaf (left) on February 14 Nancy and Olaf 14 feb 2005.jpg
Cyclones Nancy (right) and Olaf (left) on February 14

During 2005, tropical cyclones formed within seven different tropical cyclone basins, located within various parts of the Atlantic, Pacific and Indian Oceans. During the year, a total of 141 systems formed with 94 of these developing further and were named by the responsible warning centre. The strongest tropical cyclone of the year was Hurricane Wilma, which was estimated to have a minimum barometric pressure of 882  hPa (26.05  inHg ). 2005 was above-average in terms of the number of storms. The most active basin in the year was the North Atlantic, which documented 28 named systems. The Western Pacific had an near-average season with 23 named storms. The Eastern Pacific hurricane season experienced an above-average number of tropical storm intensity systems, numbering 15. Activity across the southern hemisphere's three basins – South-West Indian, Australian, and South Pacific – was fairly significant, with the regions recording 23 named storms altogether, with the most intense Southern Hemisphere cyclone of the year, Cyclone Percy from the South Pacific Ocean basin peaking at 145 mph (235 km/h) and 900 millibars. Throughout the year, 28 Category 3 tropical cyclones formed, including eight Category 5 tropical cyclones in the year. The accumulated cyclone energy (ACE) index for the 2005 (seven basins combined), as calculated by Colorado State University was 899.6 units.

Contents

The deadliest tropical cyclone of the year was Hurricane Stan in the North Atlantic Ocean, which killed more than 1,600 people in Central America, while the costliest tropical cyclone was Hurricane Katrina – also in the North Atlantic Ocean – which caused more than $125 billion in damage after striking United States especially New Orleans and its surrounding areas, making it the costliest tropical cyclone on record, tying with Hurricane Harvey in 2017.

Global atmospheric and hydrological conditions

On the Eastern and Central Pacific, three simultaneous tropical cyclones existed on September 22. Jova, Kenneth and Max 2005 Pacific hurricane season three active storms.jpg
On the Eastern and Central Pacific, three simultaneous tropical cyclones existed on September 22. Jova, Kenneth and Max

A strong La Niña existed throughout 2005.

Summary

Tropical Storm Zeta (2005)Hurricane Epsilon (2005)Tropical Storm Delta (2005)Tropical Storm Gamma (2005)Hurricane Beta (2005)Tropical Storm Alpha (2005)Hurricane WilmaHurricane Vince (2005)Tropical Storm Tammy (2005)2005 Azores subtropical stormHurricane StanHurricane Otis (2005)Typhoon LongwangHurricane RitaTropical Storm Vicente (2005)Hurricane Kenneth (2005)Hurricane Ophelia (2005)Hurricane Nate (2005)Hurricane Maria (2005)Typhoon NabiTyphoon Talim (2005)Hurricane KatrinaHurricane Irene (2005)Typhoon MatsaTropical Storm Gert (2005)Hurricane Emily (2005)Typhoon Haitang (2005)Hurricane DennisHurricane Cindy (2005)Tropical Storm Bret (2005)Tropical Storm Arlene (2005)Hurricane Adrian (2005)Cyclone IngridCyclone PercyCyclone NancyCyclone OlafCyclone HarveyCyclone MeenaCyclone Ernesttropical cyclone basinsTropical cyclones in 2005

North Atlantic Ocean

2005 Atlantic hurricane season summary map 2005 Atlantic hurricane season summary map.png
2005 Atlantic hurricane season summary map

The activity was the most active Atlantic hurricane season in recorded history at the time, shattering numerous records, with 31  tropical or subtropical cyclones recorded. The United States National Hurricane Center [nb 1] named 27 storms, exhausting the annual pre-designated list and resulting in the usage of six Greek letter names. A record 15 storms attained hurricane status, with maximum sustained winds of at least 74  mph (119  km/h); of those, a record seven became major hurricanes, which are a Category 3 or higher on the Saffir–Simpson scale. The season's impact was widespread and catastrophic. Its storms caused an estimated 3,468 deaths and approximately $171.7 billion in damage. It was the costliest season on record at the time, until its record was surpassed 12 years later. It also produced the second-highest accumulated cyclone energy (ACE) in the Atlantic basin, surpassed only by the 1933 season. The season officially began on June 1, 2005, and the first storm – Arlene – developed on June 8. Hurricane Dennis in July inflicted heavy damage to Cuba. Hurricane Stan in October was part of a broader weather system that killed 1,668 people and caused $3.96 billion in damage to eastern Mexico and Central America, with Guatemala hit the hardest. The final storm – Zeta – formed in late December and lasted until January 6, 2006.

Eastern Pacific Ocean

2005 Pacific hurricane season summary map 2005 Pacific hurricane season summary map.png
2005 Pacific hurricane season summary map

The activity continued the trend of generally below-average activity that began a decade prior. The season's first tropical cyclone, Adrian, developed on May 17 and reached its peak as a Category 1 hurricane. Named storms are infrequent in May, with one tropical storm every two years and a hurricane once every four years. [2] At the time, Adrian was the fourth earliest tropical cyclone to form in the eastern Pacific since reliable record-keeping began in 1971. Activity throughout the remainder of the season was far less notable, with 16 tropical cyclones, 15 named storms, 7 hurricanes, and 2 major hurricanes. The long-term 1971–2004 average suggests an average season to feature 15 named storms, 9 hurricanes, and 4 major hurricanes. October, in particular, was notably quiet, with the formation of only one tropical depression; only three other seasons, 1989, 1995, and 1996, ended the month without the designation of a named storm. [3]

Western Pacific Ocean

2005 Pacific typhoon season summary map 2005 Pacific typhoon season summary map.png
2005 Pacific typhoon season summary map

Although the season was quiet, some typhoons caused extensive damages in many places, especially in China where eight typhoons struck the country. First, Typhoon Haitang became the strongest storm in the basin this year and caused about $1.1 billion in damages in Taiwan and China in mid July. In August, Typhoon Matsa made landfall in Eastern China and caused about $2.23 billion in damages. Later that same month, two powerful typhoons made landfall, causing extreme damage and some casualties. Similar to Haitang, Typhoon Longwang made landfall in Taiwan and China at a strong intensity causing damages. The season also marked the first time the Atlantic hurricane season was more active than the Pacific typhoon season (the others being 2010 and 2020). However, the 2005 Atlantic hurricane season featured record high activity while the Pacific typhoon season featured near average activity.

North Indian Ocean

2005 North Indian Ocean cyclone season map 2005 North Indian Ocean cyclone season summary map.png
2005 North Indian Ocean cyclone season map

There were a total of 12 depressions during the year, three less than normal, although the highest since 1992. The IMD named four cyclonic storms, a process they initiated in 2004, which was also below normal. No systems strengthened beyond cyclonic storm status. The season was the sixth in a row with below normal activity, based on the seasonal accumulated cyclone energy. Storms generally develop when the monsoon trough is located over tropical waters, with a peak from May to June and another peak in November. [4] The monsoon developed 11 distinct low-pressure areas by the end of September, including five monsoon depressions, [5] and the monsoon season was more active than usual.

Systems

January

Cyclone Ernest Ernest Jan 22 2005 1105Z.jpg
Cyclone Ernest

January was above average featuring thirteen tropical cyclones, of which ten of them being named. The month started off with a tropical low which was short lived in the Mozambique Channel. The month's first named storm Cyclone Sally formed on the 7th in the Australian basin, however it dissipated two days later. The South-West Indian Ocean basin also had two notable storms Cyclone Ernest and Tropical Storm Felapi which both impacted Madagascar. The North Indian Ocean had an early start with a depression and Cyclone Hibaru forming. The Northwest Pacific basin also had an early start with Tropical Storm Kulap forming near the Caroline Islands.

Tropical cyclones formed in January 2005
Storm nameDates activeMax wind
km/h (mph)
Pressure
(hPa)
Areas affectedDamage
(USD)
DeathsRefs
07 January 4–5 Mozambique, Madagascar NoneNone
Sally January 7–995 (60)985NoneNoneNone
01B January 8–1055 (35)1000NoneNoneNone
Kerry January 8–14140 (90)955NoneNoneNone
10S January 11–1755 (35)998NoneNoneNone
Hibaru January 13–1765 (40)1000NoneNoneNone
Kulap January 13–1995 (50)985 Caroline Islands NoneNone
Ernest January 16–23165 (105)950 Madagascar Minimal78[ citation needed ]
Daren January 17–2395 (60)986NoneNoneNone
Tim January 23–2585 (50)990NoneNoneNone
Felapi January 26 – February 365 (40)995 Madagascar NoneNone
Lola January 27 – February 275 (45)990NoneNoneNone
Gerard January 29 – February 5115 (70)973NoneNoneNone

February

Cyclone Percy Cyclone Percy 2005.jpg
Cyclone Percy

February was slightly below-average featuring nine tropical cyclones, of which seven were named. The Australian region featured Cyclone Harvey and Tropical Low Vivienne. Harvery formed in the Gulf of Carpentaria before making landfall on Queensland and the Northern Territory while Vivienne caused minor oil and gas distruptions in the Timor Sea. The Southern Pacific basin featuted seven cyclones of which three of them became Category 5 cyclones. Cyclones Meena, Olaf, Nancy, and Percy all affected the Cook Islands with Percy becoming the strongest storm of the month.

Tropical cyclones formed in February 2005
Storm nameDates activeMax wind
km/h (mph)
Pressure
(hPa)
Areas affectedDamage
(USD)
DeathsRefs
Meena February 1–8215 (130)915 Cook Islands $20 millionNone[ citation needed ]
Harvey February 3–8140 (90)967 Northern Territory, Queensland $797 000None[ citation needed ]
Vivienne February 4–965 (40)990NoneNoneNone
Olaf February 10–20215 (130)915 Samoan Islands, Cook Islands $10 millionNone[ citation needed ]
Nancy February 10–17175 (110)935 Samoan Islands, Cook Islands NoneNone
Percy February 24 – March 5230 (145)900 Tokelau, Samoan Islands, Cook Islands $25 millionNone[ citation needed ]
11F February 26–2755 (35)998 French Polynesia NoneNone
Rae February 27 – March 675 (45)990NoneNoneNone
13F February 27 – March 4Not specified1001NoneNoneNone

March

Cyclone Ingrid Cyclone Ingrid 2005.jpg
Cyclone Ingrid

March was very inactive, featuring five tropical cyclones with all of them being named. The month started off with Cyclone Ingrid, which formed north of the Gulf of Carpentaria. Ingril was a erratic cyclone which effected much of Northern Australia as a Category 4 tropical storm. The storm made landfall on the town of Nhulunbuy as a Category 5 on the Australian scale. It then made a slow approach on Kimberley before dissipating. While, Ingril was a Category 5 cyclone, another storm named Cyclone Willy formed northwest of Australia. Willy only caused minor oil distruption in the Timor Sea but had no effect on land. The Western Pacific basin featured its second storm Tropical Storm Roke. Roke struck the Philippines as a mimimal typhoon killing 7 people. The South-West Indian Ocean featured two storms named Hennie and Isang. Hennie caused minor damage on Mauritius, and Réunion before accelerating towards the southeastern Indian Ocean. Isang on the other hand took a similar route with Hennie but had no effect on land.

Tropical cyclones formed in March 2005
Storm nameDates activeMax wind
km/h (mph)
Pressure
(hPa)
Areas affectedDamage
(USD)
DeathsRefs
Ingrid March 4–16230 (140)924 Papua New Guinea, Northern Australia $14.4 million5[ citation needed ]
Willy March 8–14140 (85)960NoneNoneNone
Roke (Auring) March 13–19100 (65)980 Caroline Islands, Philippines $166 thousand7[ citation needed ]
Hennie March 19–26100 (65)978 Mauritius, Réunion NoneNone
Isang March 29 – April 6115 (75)970NoneNoneNone

April

Cyclone Adeline-Juliet Cyclone Adeline-Juliet 2005.jpg
Cyclone Adeline-Juliet

April was average featuring eight tropical cyclones, of which three were named. The month started off with Cyclone Adeline-Juliet which became the strongest storm of the month. The storm was first noted near the Cocos Islands and was upgraded into Tropical Storm Adeline. It then entered the South-West Indian Ocean basin where the storm was renamed Juliet. It then intensified into an Intense Tropical Cyclone until the system weakened and became extratropical. Later 11U formed over the Arafura Sea and made landfall on Papua New Guinea. 11U was the last storm of the 2004–05 Australian region cyclone season. The second named storm was Cyclone Sheila which formed over Fiji. The storm then curved away from Fiji where the storm dissipated shortly after being named. The third named storm was Typhoon Sonca which formed in the Western Pacific. It then intensified into a Category 4 typhoon. Despite its strength, the typhoon stayed at sea and dissipated. The other unnamed storms were rather weak and short-lived as not much information is known.

Tropical cyclones formed in April 2005
Storm nameDates activeMax wind
km/h (mph)
Pressure
(hPa)
Areas affectedDamage
(USD)
DeathsRefs
Adeline–Juliet April 2–11220 (140)905 Cocos (Keeling) Islands MinimalNone[ citation needed ]
11U April 13–15Not specified990 Papua New Guinea NoneNone
14F April 14 – May 155 (35)1000NoneNoneNone
Sheila April 20–2275 (45)990 Fiji NoneNone
16F April 20–22Not specified1000 Niue NoneNone
Sonca (Bising) April 21–27165 (105)935 Caroline Islands NoneNone
17F April 26 – May 1Not specified1007NoneNoneNone
18F April 29 – May 1Not specified1006NoneNoneNone

May

Typhoon Nesat (Dante) TyphoonNesat2005.jpg
Typhoon Nesat (Dante)

May was a very inactive season featuring only three tropical cyclones with two of them being. The month's first storm started in the Western Pacific with the formation of a tropical depression named Crising which was named by the PAGASA. Crising formed east of the Philippine island of Mindanao however, the storm never organized into a tropical storm and did not receive an International name. It then dissipated east of the Philippines. The Eastern Pacific featured its first storm of the year, Hurricane Adrian. Adrian formed very early shortly after the season started and took an unusually northeast route towards El Salvador making it the closest hurricane ever to approach the country. It then made landfall on Honduras before dissipating. The last storm of the month was Nesat which formed near Guam. Nesat then intensified into a Category 4 typhoon before passing south of Japan before becoming extratropical southeast of Japan.

Tropical cyclones formed in May 2005
Storm nameDates activeMax wind
km/h (mph)
Pressure
(hPa)
Areas affectedDamage
(USD)
DeathsRefs
Crising May 15–1855 (35)1004 Philippines NoneNone
Adrian May 17–21130 (80)982 El Salvador, Guatemala, Honduras, Nicaragua $12 million5[ citation needed ]
Nesat (Dante) May 27 – June 11175 (110)930 Caroline Islands, Japan, Philippines NoneNone

June

Tropical Storm Arlene Arlene 11 june 2005 1645Z.jpg
Tropical Storm Arlene

June was an inactive month featuring only six tropical storms with four of them being named. The Eastern Pacific featured Tropical Storm Arlene and Tropical Storm Calvin which formed south of Mexico. However, the two storms weren't much of a threat to the country. The Atlantic featured Tropical Storm Arlene and Tropical Storm Bret. Arlene, which became the first storm of the 2005 Atlantic hurricane season and the strongest storm of the month, formed very early north of Honduras. It traveled north in the Gulf of Mexico then made landfall near the Alabama-Florida border. Bret was a short lived storm that made landfall Veracruz in Mexico causing minor damage. The North Indian Ocean featured two depressions with one depression forming over India causing minor flooding.

Tropical cyclones formed in June 2005
Storm nameDates activeMax wind
km/h (mph)
Pressure
(hPa)
Areas affectedDamage
(USD)
DeathsRefs
Arlene June 8–13110 (70)989 Cayman Islands, Cuba, Florida $11.8 million1[ citation needed ]
ARB 01 June 21–2245 (30)992 Gujarat NoneNone
Beatriz June 21–2485 (50)1000NoneNoneNone
Calvin June 26–2985 (50)1000MexicoMinimalNone[ citation needed ]
LAND 01 June 27 – July 545 (30)990IndiaUnknown26[ citation needed ]
Bret June 28–3065 (40)1002Mexico$9.2 million2[ citation needed ]

July

Typhoon Haitang Haitang 2005-07-16 1325Z.png
Typhoon Haitang

July was average featuring fourteen tropical cyclones, with twelve of them being named. The East Pacific featured two tropical storms named Dora and Eugene. The two storms made a close approach to the Mexican coastline however, the damage was minimal. The Western Pacific saw the formation of Typhoons Haitang, Matsa and Tropical Storms Nalgae, Banyan, and Washi and Emong. Typhoon Haitang, which became the strongest storm of the month made landfall on China and Taiwan along with Typhoon Matsa which made landfall near Shanghai. Washi made landfall in Vietnam while Banyan made a close approach to Japan but missed the country and became extratropical east of Japan. The Atlantic featured three hurricanes and two tropical storms. Some notable storms include Dennis and Hurricane Emily. Dennis was an early-forming Category 4 hurricane that traveled across the Caribbean and eventually striking Alabama inflicting severe damage and killing at least 70 people. Dennis was then followed by Emily which also formed near Windward Islands. It then became the earliest-forming hurricane with a Category 5 strength. It was also the costliest Category 5 hurricane to not have its name retired. The North Indian Ocean featured the only non-named storm of the month classified as BOB 02 which was short lived.

Tropical cyclones formed in July 2005
Storm nameDates activeMax wind
km/h (mph)
Pressure
(hPa)
Areas affectedDamage
(USD)
DeathsRefs
Cindy July 3–7120 (75)991 Yucatán Peninsula, East Coast of the United States $320 million3[ citation needed ]
Dora July 4–675 (45)1002MexicoMinimalNone[ citation needed ]
Dennis July 4–13240 (150)930 Windward Islands, Greater Antilles, Gulf Coast of the United States, Great Lakes region $4.26 billion88[ citation needed ]
Emong July 4–7Not specified1004 Philippines ChinaNoneNone
Haitang (Feria) July 10–21195 (120)920 Mariana Islands, Ryukyu Islands, Taiwan, China$1.1 billion13[ citation needed ]
Emily July 11–21260 (160)929 Lesser Antilles, Greater Antilles, South America, Yucatán Peninsula, Mexico, Texas $1.01 billion17[ citation needed ]
Eugene July 18–20110 (70)989 Baja California Peninsula Minimal1[ citation needed ]
Nalgae July 18–2485 (50)990NoneNoneNone
Banyan July 20–27100 (65)975JapanNoneNone
Franklin July 21–29110 (70)997 The Bahamas, Bermuda, Newfoundland and Labrador NoneNone
Gert July 23–2575 (45)1005Central America$6 million1[ citation needed ]
Washi July 28–3185 (50)985China, Vietnam NoneNone
BOB 02 July 29–3155 (35)988IndiaUnknown1[ citation needed ]
Matsa (Gorio) July 30 – August 8150 (90)950 Taiwan, China, Korea $2.23 billion29[ citation needed ]

August

Hurricane Katrina Katrina 2005-08-28 1700Z.jpg
Hurricane Katrina

August was average, featuring eighteen tropical cyclones with fourteen of them being named. The Eastern Pacific featured Hurricanes Fernanda, and Hilary, Tropical Storms Greg, and Irwin along with one depression classified as One-C. The five storms all stayed away from any landmass however, One-C's remnants dropped moderate rain on Hawaii causing minor damage. The Western Pacific featured three typhoons named Mawar, Talim, and Nabi and Severe Tropical Storms Sanvu and Ghuchol. Sanvu and Talim struck China while Mawar and Nabi affected Japan. The Atlantic featured Tropical Storms Harvey, Jose, and Lee and Hurricanes Irene and Katrina. Jose was short lived but struck Central Mexico causing minor damage. Hurricane Katrina on the other hand struck Florida and intensified into the season's second Category 5 hurricane. Katrina then struck New Orleans causing a large storm surge leaving the city completely flooded. The hurricane killed at least 1,800 people and inflicted $125 billion dollars worth of damage making it at the time the costliest tropical storm on record until it tied with Hurricane Harvey in 2017.[ citation needed ]

Tropical cyclones formed in August 2005
Storm nameDates activeMax wind
km/h (mph)
Pressure
(hPa)
Areas affectedDamage
(USD)
DeathsRefs
Harvey August 2–8100 (65)994 Bermuda NoneNone
One-C August 3–445 (30)1008NoneNoneNone
Irene August 4–18165 (105)970 East Coast of the United States None1[ citation needed ]
TD August 9–12Not specified996China, Vietnam, Laos NoneNone
Fernanda August 9–16140 (85)978NoneNoneNone
Sanvu (Huaning) August 9–1495 (60)985 Philippines Taiwan, ChinaNoneNone
Greg August 11–1585 (50)1000NoneNoneNone
Ten August 13–1455 (35)1008NoneNoneNone
Ghuchol August 18–25100 (65)980NoneNoneNone
Mawar August 19–27175 (110)930JapanNone2[ citation needed ]
Hilary August 19–25165 (105)970NoneNoneNone
Jose August 22–2395 (65)998Mexico$45 million16[ citation needed ]
Katrina August 23–30280 (175)902 The Bahamas, Florida, Gulf Coast of the United States $125 billion1,836[ citation needed ]
Irwin August 25–2885 (50)1000MexicoNoneNone
Talim (Isang) August 25 – September 2175 (110)925 Taiwan, China$1.5 billion150[ citation needed ]
TD August 27–31Not specified1000China, Vietnam, Laos NoneNone
Lee August 28 – September 365 (40)1006NoneNoneNone
Nabi (Jolina) August 28 – September 8175 (110)925 Caroline Islands, Mariana Islands, Korea, Japan, Russia, Alaska $972 million35[ citation needed ]

September

Hurricane Rita Rita 2005-09-21 1915Z.jpg
Hurricane Rita

September was very active featuring 22 tropical storms with 17 of them being named. The Eastern Pacific featured Hurricanes Jova, Kenneth, Max, and Otis and Tropical storms Lidia and Norma. Otis became a Category 2 hurricane and threatened the Baja California Peninsula, however, it dissipated before it could reach the peninsula. The other storms on the other hand stayed at sea. The Western Pacific featured some deadly storms mostly being Typhoons Khanun, Damrey, Vicente, and Longwang. Khanun, Damrey, and Longwang all struck China killing more than 350 people. Vincente on the other hand looped in The South China Sea before striking Vietnam killing at least 22 people. The Atlantic season continued with the formation of Hurricanes Maria, Nate, Ophelia, Philippe, and Rita, and a short lived depression. Maria, affected parts of Norway causing 3 deaths. Nate stayed at sea however it disturbed some Canadian Navy ships heading to the U.S to help in the aftermath of Hurricane Katrina along with Ophelia which affected much of the Eastern United States as well as parts of Atlantic Canada. Hurricane Rita on the other hand became the third Category 5 hurricane in the basin and became the most intense Atlantic Hurricane in the Gulf of Mexico by pressure. Rita then made landfall near the Texas-Louisiana border which was already devastated by Hurricane Katrina. Rita was the strongest storm in 2005 until it was then beaten by Hurricane Wilma the next month. In the North Indian Ocean, three short lived depressions as well as Cyclone Pyarr formed. Pyarr, being the only named stormed of the month affected India and Bangladesh which resulted in severe damage and severe loss of life.

Tropical cyclones formed in September 2005
Storm nameDates activeMax wind
km/h (mph)
Pressure
(hPa)
Areas affectedDamage
(USD)
DeathsRefs
Maria September 1–10185 (115)962 Northeastern United States, Iceland, Scotland, Norway $3.1 million3[ citation needed ]
Nate September 5–10150 (90)979 Bermuda, Azores None1[ citation needed ]
Ophelia September 6–17140 (85)976 The Bahamas, Florida, East Coast of the United States, Atlantic Canada, Europe $70 million3[ citation needed ]
Khanun (Kiko) September 6–12155 (100)945 Caroline Islands, Taiwan, China, Korea $1.22 billion16[ citation needed ]
TD September 11–14Not specified998 Vietnam, Cambodia, Thailand NoneNone
Jova September 12–25205 (125)951NoneNoneNone
BOB 03 September 12–1645 (30)992IndiaUnknown6[ citation needed ]
ARB 02 September 14–1645 (30)996 Gujarat Unknown13[ citation needed ]
Kenneth September 14–30215 (130)947 Hawaii NoneNone
TD September 15–16Not specified1004 Philippines NoneNone
Vicente September 16–1985 (50)985 Philippines, China, Vietnam, Laos, Thailand $3.48 million22[ citation needed ]
Philippe September 17–23130 (80)986 Bermuda MinimalNone[ citation needed ]
Lidia September 17–1965 (40)1005NoneNoneNone
Pyarr September 17–2165 (40)988India, Bangladesh $11.4 million84[ citation needed ]
Max September 18–22140 (85)981NoneNoneNone
Rita September 18–26285 (180)895 Hispaniola, The Bahamas, Cuba, Florida, Gulf Coast of the United States, Midwestern United States $18.5 billion120[ citation needed ]
Saola September 19–26150 (90)950 Japan NoneNone
Damrey (Labuyo) September 19–28150 (90)955 Philippines Taiwan, China, Vietnam, Laos, Thailand $1.73 billion180[ citation needed ]
Norma September 23–2795 (60)997NoneNoneNone
Longwang (Maring) September 25 – October 3175 (110)930 Ryukyu Islands, Taiwan, China $970.5 million149[ citation needed ]
Otis September 28 – October 3165 (105)970 Baja California Peninsula MinimalNone[ citation needed ]
Nineteen September 30 – October 255 (35)1006NoneNoneNone

October

Hurricane Wilma Wilma 2005-10-19 0712Z.jpg
Hurricane Wilma

October was above average featuring sixteen storms with eight of them being named. In the East Pacific a short lived depression formed. The storm officially ended the 2005 Pacific hurricane season. In the West Pacific, Typhoons Kirogi and Kai-tak along with three depressions formed. Kirogi approached Japan but drifted away from the mainland. Kai-tak on the other hand paralleled the Vietnamese coast as a tropical storm before dissipating. In the Atlantic, the active season continued on with the formation of Tropical Storms Tammy and Alpha and, Hurricanes Stan, Vince, Wilma, Beta and along with two depressions and an unnamed subtropical storm. Stan affected much of Central America and Mexico killing more than 1,600 people. Vince formed out of the unnamed subtropical storm which then intensified into a minimal Category 1 hurricane becoming the most eastern hurricane until the record was broken by Hurricane Pablo in 2019. Hurricane Wilma on the other hand intensified into a Category 5 hurricane within a day with its pressure dropping from 982hPa to 882hPa within a 30-hour period. Wilma became the most intense Atlantic hurricane ever recorded, based on pressure. In the North Indian Ocean, 03B and BOB 04 formed but were short lived.

Tropical cyclones formed in October 2005
Storm nameDates activeMax wind
km/h (mph)
Pressure
(hPa)
Areas affectedDamage
(USD)
DeathsRefs
Stan October 1–5130 (80)977Central America, Mexico$2.70 billion1,669[ citation needed ]
03B October 1–375 (45)994India, Bangladesh Unknown16[ citation needed ]
Unnamed October 4–585 (50)997 Azores NoneNone
Tammy October 5–685 (50)1001 The Bahamas, Florida $30 million10[ citation needed ]
20W October 6–8Not specified1006 Vietnam, Cambodia, Laos NoneNone
Twenty-Two October 8–1055 (35)1008 Bermuda, New England MinimalNone[ citation needed ]
Vince October 8–11120 (75)988 Madeira Island, Portugal, SpainMinimalNone
TD October 7–17Not specified1004NoneNoneNone
Kirogi (Nando) October 9–19185 (115)930NoneNoneNone
TD October 10–12Not specified1004NoneNoneNone
Wilma October 15–26185 (295)882 Jamaica, Central America, Yucatán Peninsula, Cuba, Florida, The Bahamas, Atlantic Canada $27.4 billion52[ citation needed ]
Sixteen-E October 15–2055 (35)1005NoneNoneNone
Alpha October 22–2485 (50)998 Hispaniola, The Bahamas Unknown26[ citation needed ]
BOB 04 October 26–2955 (35)998IndiaUnknown105[ citation needed ]
Beta October 26–31185 (115)962Central America, Colombia $15.5 million9[ citation needed ]
Kai-tak October 28 – November 2150 (90)950 Vietnam, China$11 million19[ citation needed ]

November

Cyclone Bertie-Alvin Bertie Nov 23 2005 0405Z.jpg
Cyclone Bertie-Alvin

November was average featuring ten storms with seven storms being named. In the Southern Hemisphere, 02R and 01F formed but were short lived. Another notable storm was Cyclone Bertie-Alvin which was given two names. Bertie-Alvin wandered across the Southern Indian Ocean before dissipating. In the West Pacific, Tembin and Bolaven formed with the storms affecting the Philippines. In the North Indian Ocean, BOB 05 and Cyclone Baaz. In the Atlantic, Tropical storms Gamma, Delta and Hurricane Epsilon formed. Gamma affected Central America while Epsilon stayed out to sea. Delta, on the other hand, stuck the Canary Islands which destroyed an iconic sea stack. Delta's remnants then made landfall of Morocco and Algeria.

Tropical cyclones formed in November 2005
Storm nameDates activeMax wind
km/h (mph)
Pressure
(hPa)
Areas affectedDamage
(USD)
DeathsRefs
02R November 5–855 (35)995NoneNoneNone
Tembin (Ondoy) November 7–1265 (40)1002 Caroline Islands, Philippines NoneNone
Bolaven (Pepeng) November 14–20100 (65)985 Philippines NoneNone
Gamma November 14–2185 (50)1002 Lesser Antilles, Central America$18 million39[ citation needed ]
BOB 05 November 20–2245 (30)1002 Sri Lanka, India NoneNone
Delta November 22–28110 (70)980 Canary Islands, North Africa, (Especially Algeria and Morocco)$362 million19[ citation needed ]
Bertie-Alvin November 19 – December 3185 (115)928NoneNoneNone
Baaz November 28 – December 285 (50)998 Thailand, India $11 million22[ citation needed ]
Epsilon November 29 – December 8140 (85)981NoneNoneNone
01F November 30 – December 2Not specified1004NoneNoneNone

December

Tropical Storm Zeta Tropical Storm Zeta 2005.jpg
Tropical Storm Zeta

December was inactive featuring six storms with two of them being named. In the Southern Hemisphere, 02F and 04R formed but were short lived. In the West Pacific, a short lived depression that was named Quedan by the PAGASA traveled across the South China Sea and dissipated south of Vietnam. In the North Indian Ocean, Cyclonic Storm Fanoos and BOB 08 formed with Fannos making landfall in Southern India. BOB 08 on the other hand stayed in the Bay of Bengal. In the Atlantic, Zeta formed very late in the season and became the 28th storm of the year. Zeta continued into January 2006 which made it the second Atlantic tropical cyclones to span two calendar years (the other being Hurricane Alice in 1954–55).

Tropical cyclones formed in December 2005
Storm nameDates activeMax wind
km/h (mph)
Pressure
(hPa)
Areas affectedDamage
(USD)
DeathsRefs
02F December 3–6Not specified1002NoneNoneNone
Fanoos December 6–1085 (50)998 India, Sri Lanka UnknownNone[ citation needed ]
BOB 08 December 15–2255 (36)1000 India NoneNone
25W (Quedan) December 16–2255 (35)1000 Philippines Vietnam NoneNone
04R December 21–2355 (35)998NoneNoneNone
Zeta December 30 – January 6100 (65)994NoneNoneNone

Global effects

Season nameAreas affectedSystems formedNamed stormsDamage (USD)Deaths
2005 Atlantic hurricane season Guyana, Venezuela, Trinidad and Tobago, Windward Islands, Honduras, Belize, Cayman Islands, Mexico, Cuba, United States, Barbados, Nicaragua, Bermuda, Suriname, Jamaica, Atlantic Canada, Cape Verde, Leeward Islands, Puerto Rico, Hispaniola, Turks and Caicos, The Bahamas, United Kingdom, Ireland, France, Spain, Costa Rica, El Salvador, Panama, Azores, Portugal, Norway 3128$171.755 billion3,468
2005 Pacific hurricane season Guatemala, El Salvador, Nicaragua, Honduras, Southwestern Mexico, Western Mexico, Hawaii, Baja California Peninsula 1715$12 million6
2005 Pacific typhoon season 3 Caroline Islands, Philippines, Mariana Islands, Ryukyu Islands, Japan, Taiwan, China, Vietnam, Laos, Russian Far East, Alaska, Thailand, Cambodia, South Korea, North Korea 3323$9.73 billion629
2005 North Indian Ocean cyclone season Bangladesh, East India, Central India, South India, Gujarat, Sri Lanka, Thailand 145$21.4 million273
2004–05 South-West Indian Ocean cyclone season 2 Madagascar, Mauritius, Rodrigues, Tromelin Island, Réunion 116None78
2005–06 South-West Indian Ocean cyclone season 3 Madagascar, Mauritius, Rodrigues 40NoneNone
2004–05 Australian region cyclone season 2 Western Australia, Eastern Indonesia, Top End, Kimberley, Queensland, Papua New Guinea, Cocos (Keeling) Islands 118$15.197 million5
2005–06 Australian region cyclone season 3 None31NoneNone
2004–05 South Pacific cyclone season 2 Solomon Islands, Vanuatu, Tuvalu, Fiji, Samoa, Tonga, Niue, Tokelau, American Samoa 148$55 millionNone
2005–06 South Pacific cyclone season 3 None30NoneNone
Worldwide(See above)141 [lower-alpha 1] 94$181.591 billion4,459
  1. The sum of the number of systems and fatalities in each basin will not equal the number shown as the total. This is because when systems move between basins, it creates a discrepancy in the actual number of systems and fatalities.

See also

Notes

1 Only systems that formed either on or after January 1, 2005 are counted in the seasonal totals.
2 Only systems that formed either before or on December 31, 2005 are counted in the seasonal totals.
3 The wind speeds for this tropical cyclone/basin are based on the IMD Scale which uses 3-minute sustained winds.
4 The wind speeds for this tropical cyclone/basin are based on the Saffir Simpson Scale which uses 1-minute sustained winds.
5The wind speeds for this tropical cyclone are based on Météo-France which uses gust winds.

Related Research Articles

<span class="mw-page-title-main">Tropical cyclone basins</span> Areas of tropical cyclone formation

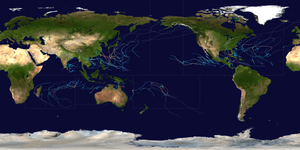
Traditionally, areas of tropical cyclone formation are divided into seven basins. These include the north Atlantic Ocean, the eastern and western parts of the northern Pacific Ocean, the southwestern Pacific, the southwestern and southeastern Indian Oceans, and the northern Indian Ocean. The western Pacific is the most active and the north Indian the least active. An average of 86 tropical cyclones of tropical storm intensity form annually worldwide, with 47 reaching hurricane/typhoon strength, and 20 becoming intense tropical cyclones, super typhoons, or major hurricanes.

<span class="mw-page-title-main">Tropical cyclones in 2010</span>

During 2010, tropical cyclones formed within seven different tropical cyclone basins, located within various parts of the Atlantic, Pacific and Indian Oceans. During the year, a total of 111 tropical cyclones developed, with 64 of them being named by either a Regional Specialized Meteorological Center (RSMC) or a Tropical Cyclone Warning Center (TCWC). The most active basin was the North Atlantic, which documented 19 named systems, while the North Indian Ocean, despite only amounting to five named systems, was its basin's most active since 1998. Conversely, both the West Pacific typhoon and East Pacific hurricane seasons experienced the fewest cyclones reaching tropical storm intensity in recorded history, numbering 14 and 8, respectively. Activity across the southern hemisphere's three basins—South-West Indian, Australian, and South Pacific—was spread evenly, with each region recording 7 named storms apiece. The southern hemisphere's strongest tropical cyclone was Cyclone Edzani, which bottomed out with a barometric pressure of 910 mbar in the South-West Indian Ocean. Nineteen Category 3 tropical cyclones formed, including four Category 5 tropical cyclones in the year. The accumulated cyclone energy (ACE) index for the 2010, as calculated by Colorado State University was 573.8 units.

<span class="mw-page-title-main">Tropical cyclones in 2007</span>

During 2007, tropical cyclones formed within seven different tropical cyclone basins, located within various parts of the Atlantic, Pacific and Indian Oceans. During the year, a total of 129 systems formed with 79 of these developing further and were named by the responsible warning centre. The strongest tropical cyclone of the year was Cyclone George, which was estimated to have a minimum barometric pressure of 902 hPa (26.64 inHg). The deadliest tropical cyclone of the year was Cyclone Sidr in the North Indian Ocean which killed 15,000 people in Bangladesh. The costliest tropical cyclone of the year was Cyclone Gonu in the North Indian Ocean, which caused more than $4.41 billion in damage after striking Oman, United Arab Emirates, Iran and Pakistan. The most active basin in the year was the Western Pacific, which documented 24 named systems. The North Atlantic had an above-average season with 15 named storms. The Eastern Pacific hurricane season experienced a below-average number of tropical storm intensity systems, numbering 11. Activity across the Southern Hemisphere's three basins – South-West Indian, Australian, and South Pacific – was fairly significant, with the regions recording 25 named storms altogether, with the most intense storm of the year coming from the Australian basin. Throughout 2007, twenty one major tropical cyclones formed, including five Category 5 tropical cyclones in the year. The accumulated cyclone energy (ACE) index for the 2007, as calculated by Colorado State University was 568.1 units.

<span class="mw-page-title-main">Tropical cyclones in 2018</span>

During 2018, tropical cyclones formed within seven different tropical cyclone basins, located within various parts of the Atlantic, Pacific and Indian Oceans. During the year, a total of 151 tropical cyclones had formed this year to date. 102 tropical cyclones were named by either a Regional Specialized Meteorological Center (RSMC) or a Tropical Cyclone Warning Center (TCWC).

<span class="mw-page-title-main">Tropical cyclones in 2017</span>

During 2017 tropical cyclones formed within seven different tropical cyclone basins, located within various parts of the Atlantic, Pacific and Indian Oceans. During the year, a total of 146 tropical cyclones had formed. 88 tropical cyclones had been named by either a Regional Specialized Meteorological Center (RSMC) or a Tropical Cyclone Warning Center (TCWC). The strongest and deadliest tropical cyclone was Hurricane Maria with a minimum barometric pressure of 908 mbar and killing 3,000 people in Puerto Rico and Dominica. The costliest tropical cyclone of the year was Hurricane Harvey in the Atlantic, which struck Houston metropolitan area in August causing US$125 billion in damage, tying with Hurricane Katrina as the costliest tropical cyclone worldwide.

<span class="mw-page-title-main">Tropical cyclones in 2019</span>

During 2019, tropical cyclones formed within seven different tropical cyclone basins, located within various parts of the Atlantic, Pacific and Indian Oceans. During the year,a total of 142 systems formed, with 100 of these developing further and being named by the responsible warning centre. The strongest tropical cyclone of the year was Typhoon Halong, with a minimum barometric pressure of 905 hPa (26.72 inHg). Cyclone Idai became the deadliest tropical cyclone of the year, after killing at least 1,303 people in Mozambique, Malawi, Zimbabwe, and Madagascar. The costliest tropical cyclone of the year was Typhoon Hagibis, which caused more than $15 billion in damage after striking Japan.

<span class="mw-page-title-main">Tropical cyclones in 2016</span>

During 2016, tropical cyclones formed within seven different tropical cyclone basins, located within various parts of the Atlantic, Pacific and Indian Oceans. During the year, 140 tropical cyclones formed in bodies of water known as tropical cyclone basins. Of these, 84, including two subtropical cyclones in the South Atlantic Ocean and two tropical-like cyclones in the Mediterranean, were named by various weather agencies when they attained maximum sustained winds of 35 knots. The strongest storm of the year was Winston, peaking with a pressure of 884 hPa (26.10 inHg) and with 10-minute sustained winds of 285 km/h (175 mph) before striking Fiji. The costliest and deadliest tropical cyclone in 2016 was Hurricane Matthew, which impacted Haiti, Cuba, Florida, Georgia and the Carolinas, causing US$15.09 billion in damage. Matthew killed 603 people; 546 in Haiti, 47 in United States, 4 in Cuba and Dominican Republic, and 1 in Colombia and St. Vincent.

<span class="mw-page-title-main">Tropical cyclones in 2020</span>

2020 was regarded as the most active tropical cyclone year on record, documenting 104 named tropical systems. During the year, 141 tropical cyclones formed in bodies of water known as tropical cyclone basins. Of these, a record-high of 104, including three subtropical cyclones in the South Atlantic Ocean and three tropical-like cyclones in the Mediterranean, were named by various weather agencies when they attained maximum sustained winds of 35 knots. The strongest storm of the year was Typhoon Goni, peaking with a pressure of 905 hPa (26.72 inHg). The deadliest storm of the year was Hurricane Eta which caused 175 fatalities and another 100+ to be missing in Central America and the US, while the costliest storm of the year was Hurricane Laura, with a damage cost around $19.1 billion in the Greater Antilles, The Bahamas, and the Gulf Coast of the United States.

<span class="mw-page-title-main">Tropical cyclones in 2009</span>

Throughout 2009, 130 tropical cyclones formed in bodies of water known as tropical cyclone basins. Of these, 81 were named, including a subtropical cyclone in the South Atlantic Ocean, by various weather agencies when they attained maximum sustained winds of 35 knots. The strongest storm of the year was Typhoon Nida in the Western Pacific Ocean. The deadliest and costliest storm of the year was Typhoon Morakot (Kiko) causing 789 fatalities through its track in the Philippines, Japan, Taiwan, China, and the Korean peninsula. Throughout the year, twenty-one Category 3 tropical cyclones formed, including five Category 5 tropical cyclones in the year. The accumulated cyclone energy (ACE) index for the 2009, as calculated by Colorado State University was 609.6 units.

<span class="mw-page-title-main">Tropical cyclones in 2000</span>

During 2000, tropical cyclones formed in seven different areas called basins, located within various parts of the Atlantic, Pacific, and Indian Oceans. A total of 140 tropical cyclones formed within bodies of water known as tropical cyclone basins, with 81 of them being further named by their responsible weather agencies when they attained maximum sustained winds of 35 knots. The strongest storm of the year was Cyclone Hudah, peaking with a minimum pressure of 905 hPa (26.72 inHg), and with 10-minute sustained winds of 220 km/h (135 mph). The highest confirmed number of deaths from a storm was from Typhoon Kai-tak, which killed 188 people, however, Leon–Eline may have killed up to 722 people. The costliest storm was Saomai, which caused $6.3 billion in damage. The accumulated cyclone energy (ACE) index for the 2000, as calculated by Colorado State University was 677.3 units.

The year 1997 was regarded as one of the most intense tropical cyclone years on record, featuring a record 12 category 5-equivalent tropical cyclones, according to the Saffir–Simpson hurricane wind scale. The year also featured the second-highest amount of accumulated cyclone energy (ACE) on record, just behind 1992 and 2018. Throughout the year, 108 tropical cyclones have developed in bodies of water, commonly known as tropical cyclone basins. However, only 89 tropical cyclones were of those attaining 39 mph or greater, falling just below the long term average of 102 named systems. The most active basin was the Western Pacific, attaining an ACE amount of 571, the highest ever recorded in any season in any basin on record. The deadliest tropical cyclone was Severe Tropical Storm Linda (Openg). The costliest tropical cyclone was Super Typhoon Winnie (Ibiang), which set a record for having the largest eye on record. The most intense tropical cyclone was Hurricane Linda, peaking at 902 hPa/mbar. Typhoon Paka (Rubing), the longest-lived system, produced the fourth-highest ACE for a single tropical cyclone, just behind Typhoon Nancy (1961), Hurricane/Typhoon Ioke (2006), and Cyclone Freddy (2023). The accumulated cyclone energy (ACE) index for the 1997, as calculated by Colorado State University was 1,099.2 units.

<span class="mw-page-title-main">Tropical cyclones in 1996</span>

During 1996, tropical cyclones formed within seven different tropical cyclone basins, located within various parts of the Atlantic, Pacific, and Indian Oceans. During the year, a total of 139 tropical cyclones formed in bodies of water known as tropical cyclone basins. 90 of them were named by various weather agencies when they attained maximum sustained windS of 35 knots. The strongest tropical cyclone of the year was Cyclone Daniella, peaking with a pressure of 915 hPa (27.02 inHg) in the open waters of the Indian Ocean. Hurricane Fran and Typhoon Herb tie for the costliest storm of the year, both with a damage cost of $5 billion. The deadliest tropical cyclone of the year was the 1996 Andhra Pradesh cyclone, which was blamed for over 1,000 fatalities as it directly affected the state of Andhra Pradesh in India. Five Category 5 tropical cyclones were formed in 1996. The accumulated cyclone energy (ACE) index for the 1996, as calculated by Colorado State University was 960 units.

<span class="mw-page-title-main">Tropical cyclones in 1995</span>

During 1995, tropical cyclones formed within seven different bodies of water called basins. To date, 110 tropical cyclones formed, of which 74 were given names by various weather agencies. The strongest storm and the deadliest storm of the year was Typhoon Angela, which reached a minimum central pressure of 910 hPa (26.87 inHg) and caused a total of 936 deaths throughout the Philippines. The costliest storm of the year was Hurricane Opal, which caused $4.7 billion in damage throughout Central America and the Gulf Coast of the United States. The accumulated cyclone energy (ACE) index for the 1995, as calculated by Colorado State University was 779.3 units.

<span class="mw-page-title-main">Tropical cyclones in 1993</span>

During 1993, tropical cyclones formed within seven different bodies of water called basins. To date, 110 tropical cyclones formed, of which 78 were given names by various weather agencies. Only one Category 5 tropical cyclone was formed in 1993. The accumulated cyclone energy (ACE) index for the 1993, as calculated by Colorado State University was 710.4 units.

<span class="mw-page-title-main">Tropical cyclones in 2021</span>

During 2021, tropical cyclones formed in seven major bodies of water, commonly known as tropical cyclone basins. Tropical cyclones will be assigned names by various weather agencies if they attain maximum sustained winds of 35 knots. During the year, one hundred forty-five systems have formed and ninety-one were named, including one subtropical depression and excluding one system, which was unofficial. One storm was given two names by the same RSMC. The most intense storm of the year was Typhoon Surigae, with maximum 10-minute sustained wind speeds of 220 km/h (140 mph) and a minimum pressure of 895 hPa (26.43 inHg). The deadliest tropical cyclone was Typhoon Rai, which caused 410 fatalities in the Philippines and 1 in Vietnam, while the costliest was Hurricane Ida, which caused an estimated $75.25 billion USD in damage after striking Louisiana and the Northeastern United States.

<span class="mw-page-title-main">Tropical cyclones in 2022</span>

During 2022, tropical cyclones formed in seven major bodies of water, commonly known as tropical cyclone basins. Tropical cyclones were named by various weather agencies when they attained maximum sustained winds of 35 knots. During the year, 133 systems formed, of which 87 were named. The strongest storm to form was Typhoon Nanmadol, with minimum pressure of 910 hPa (26.87 inHg). The deadliest tropical cyclone was Tropical Storm Megi, which caused 214 fatalities in the Philippines, while the costliest was Hurricane Ian, which had an estimated damage total of at least $113.1 billion after affecting Trinidad and Tobago, Venezuela, Colombia, the western part of the Greater Antilles and Southeast United States.

<span class="mw-page-title-main">Tropical cyclones in 2023</span> Tropical cyclones in 2023 worldwide

During 2023, tropical cyclones formed in seven major bodies of water, commonly known as tropical cyclone basins. They were named by various weather agencies when they attained maximum sustained winds of 35 knots. Throughout the year, a total of 115 systems formed, with 79 of them being named. The most intense storm this year was Typhoon Mawar, which had a minimum pressure of 900 hPa (26.58 inHg). The deadliest tropical cyclone of the year was Storm Daniel, which killed at least 10,028 people in Libya, Greece, Turkey, and Bulgaria. Meanwhile, the costliest tropical cyclone was Typhoon Doksuri which caused at least US$28.4 billion worth of damage in China, the Philippines and Taiwan, becoming the costliest on record outside the Atlantic Ocean basin. Among this year's systems, thirty became major tropical cyclones, of which nine intensified into Category 5 tropical cyclones on the Saffir–Simpson scale (SSHWS). This year, for the first time on record, at least one such Category 5 system formed in each tropical cyclone basin: Typhoons Mawar and Bolaven in the western Pacific Ocean, Hurricanes Jova and Otis in the eastern Pacific, Hurricane Lee in the Atlantic, Cyclone Mocha in the North Indian Ocean, Cyclone Freddy in the southwest Indian Ocean, Cyclone Ilsa in the Australian region, and Cyclone Kevin in the South Pacific. The accumulated cyclone energy (ACE) index for the 2023, as calculated by Colorado State University (CSU) was 857.4 units, which was above the 1991-2020 mean of 770.2 units.

References

  1. Worldwide Tropical Cyclone Centers (Report). National Hurricane Center. 2011-09-11. Archived from the original on March 21, 2015. Retrieved March 19, 2020.
  2. Richard D. Knabb; James L. Franklin (June 1, 2005). Monthly Tropical Weather Summary: May (Report). Miami, Florida: National Hurricane Center. Retrieved April 25, 2017.
  3. Stacy R. Stewart; John L. Beven II; James L. Franklin (November 1, 2005). Monthly Tropical Weather Summary: October (Report). National Hurricane Center. Retrieved April 27, 2017.
  4. H.J. Diamond; K.A. Shein (June 2006). "The Tropics" (PDF). Bureau of the American Meteorological Society. Retrieved 2015-06-30.
  5. Government of India (2005-10-05). "India Meteorological Department southwest monsoon 2005 end-of-season report". ReliefWeb. Retrieved 2015-06-30.

Regional Specialized Meteorological Centers

Tropical Cyclone Warning Centers

PD-icon.svg This article incorporates public domain material from websites or documents of the National Weather Service .