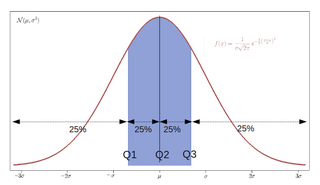
In statistics and probability, quantiles are cut points dividing the range of a probability distribution into continuous intervals with equal probabilities, or dividing the observations in a sample in the same way. There is one fewer quantile than the number of groups created. Common quantiles have special names, such as quartiles, deciles, and percentiles. The groups created are termed halves, thirds, quarters, etc., though sometimes the terms for the quantile are used for the groups created, rather than for the cut points.

In probability and statistics, Student's t-distribution is any member of a family of continuous probability distributions that arise when estimating the mean of a normally distributed population in situations where the sample size is small and the population's standard deviation is unknown. It was developed by English statistician William Sealy Gosset under the pseudonym "Student".
In medicine and health-related fields, a reference range or reference interval is the range or the interval of values that is deemed normal for a physiological measurement in healthy persons. It is a basis for comparison for a physician or other health professional to interpret a set of test results for a particular patient. Some important reference ranges in medicine are reference ranges for blood tests and reference ranges for urine tests.

The margin of error is a statistic expressing the amount of random sampling error in the results of a survey. The larger the margin of error, the less confidence one should have that a poll result would reflect the result of a survey of the entire population. The margin of error will be positive whenever a population is incompletely sampled and the outcome measure has positive variance, which is to say, the measure varies.
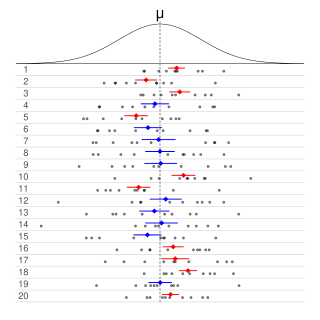
In frequentist statistics, a confidence interval (CI) is a range of estimates for an unknown parameter. A confidence interval is computed at a designated confidence level; the 95% confidence level is most common, but other levels, such as 90% or 99%, are sometimes used. The confidence level represents the long-run proportion of correspondingly CI that end up containing the true value of the parameter. For example, out of all intervals computed at the 95% level, 95% of them should contain the parameter's true value.

A Z-test is any statistical test for which the distribution of the test statistic under the null hypothesis can be approximated by a normal distribution. Z-tests test the mean of a distribution. For each significance level in the confidence interval, the Z-test has a single critical value which makes it more convenient than the Student's t-test whose critical values are defined by the sample size. Both the Z test and Student's t-test have similarities in that they both help determine the significance of a set of data. However, the z-test is rarely used in practice because the population deviation is difficult to determine.
In statistics, a k-thpercentile is a score below which a given percentage k of scores in its frequency distribution falls or a score at or below which a given percentage falls. For example, the 50th percentile is the score below which (exclusive) or at or below which (inclusive) 50% of the scores in the distribution may be found. Percentiles are expressed in the same unit of measurement as the input scores; for example, if the scores refer to human weight, the corresponding percentiles will be expressed in kilograms or pounds.
In statistical inference, specifically predictive inference, a prediction interval is an estimate of an interval in which a future observation will fall, with a certain probability, given what has already been observed. Prediction intervals are often used in regression analysis.

The standard error (SE) of a statistic is the standard deviation of its sampling distribution or an estimate of that standard deviation. If the statistic is the sample mean, it is called the standard error of the mean (SEM).
In statistics, propagation of uncertainty is the effect of variables' uncertainties on the uncertainty of a function based on them. When the variables are the values of experimental measurements they have uncertainties due to measurement limitations which propagate due to the combination of variables in the function.
A tolerance interval is a statistical interval within which, with some confidence level, a specified proportion of a sampled population falls. "More specifically, a 100×p%/100×(1−α) tolerance interval provides limits within which at least a certain proportion (p) of the population falls with a given level of confidence (1−α)." "A tolerance interval (TI) based on a sample is constructed so that it would include at least a proportion p of the sampled population with confidence 1−α; such a TI is usually referred to as p-content − (1−α) coverage TI." "A upper tolerance limit (TL) is simply a 1−α upper confidence limit for the 100 p percentile of the population."
Sample size determination is the act of choosing the number of observations or replicates to include in a statistical sample. The sample size is an important feature of any empirical study in which the goal is to make inferences about a population from a sample. In practice, the sample size used in a study is usually determined based on the cost, time, or convenience of collecting the data, and the need for it to offer sufficient statistical power. In complicated studies there may be several different sample sizes: for example, in a stratified survey there would be different sizes for each stratum. In a census, data is sought for an entire population, hence the intended sample size is equal to the population. In experimental design, where a study may be divided into different treatment groups, there may be different sample sizes for each group.
This glossary of statistics and probability is a list of definitions of terms and concepts used in the mathematical sciences of statistics and probability, their sub-disciplines, and related fields. For additional related terms, see Glossary of mathematics.
In Bayesian statistics, a credible interval is an interval within which an unobserved parameter value falls with a particular probability. It is an interval in the domain of a posterior probability distribution or a predictive distribution. The generalisation to multivariate problems is the credible region. Credible intervals are analogous to confidence intervals in frequentist statistics, although they differ on a philosophical basis: Bayesian intervals treat their bounds as fixed and the estimated parameter as a random variable, whereas frequentist confidence intervals treat their bounds as random variables and the parameter as a fixed value. Also, Bayesian credible intervals use knowledge of the situation-specific prior distribution, while the frequentist confidence intervals do not.
In statistics, a binomial proportion confidence interval is a confidence interval for the probability of success calculated from the outcome of a series of success–failure experiments. In other words, a binomial proportion confidence interval is an interval estimate of a success probability p when only the number of experiments n and the number of successes nS are known.
Bootstrapping is any test or metric that uses random sampling with replacement, and falls under the broader class of resampling methods. Bootstrapping assigns measures of accuracy to sample estimates. This technique allows estimation of the sampling distribution of almost any statistic using random sampling methods.

In statistics, the 68–95–99.7 rule, also known as the empirical rule, is a shorthand used to remember the percentage of values that lie within an interval estimate in a normal distribution: 68%, 95%, and 99.7% of the values lie within one, two, and three standard deviations of the mean, respectively.
In statistics, robust measures of scale are methods that quantify the statistical dispersion in a sample of numerical data while resisting outliers. The most common such robust statistics are the interquartile range (IQR) and the median absolute deviation (MAD). These are contrasted with conventional or non-robust measures of scale, such as sample variance or standard deviation, which are greatly influenced by outliers.

In probability theory and statistics, the Poisson distribution is a discrete probability distribution that expresses the probability of a given number of events occurring in a fixed interval of time or space if these events occur with a known constant mean rate and independently of the time since the last event. It is named after French mathematician Siméon Denis Poisson. The Poisson distribution can also be used for the number of events in other specified interval types such as distance, area or volume.
In statistics, a population proportion, generally denoted by or the Greek letter , is a parameter that describes a percentage value associated with a population. For example, the 2010 United States Census showed that 83.7% of the American population was identified as not being Hispanic or Latino; the value of .837 is a population proportion. In general, the population proportion and other population parameters are unknown. A census can be conducted in order to determine the actual value of a population parameter, but often a census is not practical due to its costs and time consumption.


