1952 Puerto Rican general election

Last updated

1952 Puerto Rican general election
Flag of Puerto Rico.svg
  1948 November 4, 1952 1956  
Gubernatorial election
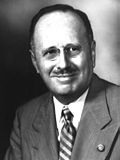
  Luis Munoz Marin.jpg 3x4.svg 3x4.svg
Nominee Luis Muñoz Marín Fernando Milán Suárez Francisco López Domínguez
Party Popular Democratic Independence PEP
Popular vote431,409126,22885,591
Percentage64.88%18.98%12.87%

Puerto Rico Governor 1952.svg
Results by municipality
Marín:      50-60%     60-70%     70-80%     80-90%

Governor before election

Luis Muñoz Marín
Popular Democratic

Elected Governor

Luis Muñoz Marín
Popular Democratic

Resident Commissioner election
  Antonio Fernos-Isern.jpg 3x4.svg 3x4.svg
Nominee Antonio Fernós-Isern Carmen Rivera De AlvaradoJuan B. Soto
Party Popular Democratic Independence PEP
Popular vote430,296126,20885,788
Percentage64.80%19.01%12.92%

General elections were held in Puerto Rico on November 4, 1952. [1] They were the second direct gubernatorial elections and the first after the ratification of the 1952 constitution.

Contents

Luis Muñoz Marín of the Popular Democratic Party (PPD) was re-elected as governor with 65% of the vote, whilst the PPD also won a majority of seats in the Senate and House of Representatives elections.

Results

Governor

CandidatePartyVotes%
Luis Muñoz Marín Popular Democratic Party 431,40964.88
Fernando Milán Suárez Puerto Rican Independence Party 126,22818.98
Francisco López Domínguez Partido Estadista Puertorriqueño 85,59112.87
Luis Moczó Socialist Party 21,7193.27
Total664,947100.00
Registered voters/turnout883,219
Source: Nohlen

Resident Commissioner

CandidatePartyVotes%
Antonio Fernós-Isern Popular Democratic Party 430,29664.80
Carmen Rivera de Alvarado Puerto Rican Independence Party 126,20819.01
Juan B. Soto Partido Estadista Puertorriqueño 85,78812.92
Angel Fernández Sánchez Socialist Party 21,7193.27
Total664,011100.00
Source: Nolla-Acosta [2]

Senate

PartyDistrict class IDistrict class IIAt-largeTotal
seats
Votes%SeatsVotes%SeatsVotes%Seats
Popular Democratic Party 430,15864.818430,20073.298429,81264.78723
Puerto Rican Independence Party 126,14919.010126,13221.490126,21819.0233
Partido Estadista Puertorriqueño 85,63912.9008,8691.51085,70412.9211
Socialist Party 21,7303.27021,7563.71021,7823.2800
Total663,676100.008586,957100.008663,516100.001127
Source: Nolla-Acosta [3]

House of Representatives

PartyDistrictAt-largeTotal
seats
Votes%SeatsVotes%Seats
Popular Democratic Party 429,58764.3740429,63164.74747
Puerto Rican Independence Party 126,08918.890126,07619.0022
Partido Estadista Puertorriqueño 89,90513.47086,16512.9822
Socialist Party 21,8213.27021,7193.2700
Total667,402100.0040663,591100.001151
Source: Nolla-Acosta [3]

References

  1. Dieter Nohlen (2005) Elections in the Americas: A data handbook, Volume I, p552 ISBN   978-0-19-928357-6
  2. Nolla-Acosta, Juan Jose (2013). Puerto Rico Election Results, 1899-2012. p. 107. ISBN   978-1-300-67141-1.
  3. 1 2 Nolla-Acosta 2013, p. 108.