America's Health Rankings

Last updated

AHR LinkedInLogo350x350.png

America's Health Rankings started in 1990 and is the longest-running annual assessment of the nation's health on a state-by-state basis. It is founded on the World Health Organization holistic definition of health, which says health is a state of complete physical, mental, and social well-being and not merely the absence of disease or infirmity. America's Health Rankings is a partnership of the United Health Foundation, and the American Public Health Association.

Contents

America's Health Rankings releases two yearly reports, one on the health of the general population in the 50 US states plus a senior report on the population aged 65 and older in each state. Both reports include some health metrics that are stratified by race/ethnicity, gender, age, education, place of residence, and economic status. State rankings are based on a methodology approved by a Scientific Advisory Committee. This methodology balances the contributions of health determinants—including 1) Behaviors; 2) Community and Environment; 3) Policy pertaining to our health care system, government, and numerous prevention programs; and 4) Clinical Care received—and Outcomes such as diabetes and deaths from cardiovascular disease.

Purpose

The ultimate purpose of the two reports is to improve the health of the US population by providing information that stimulates individuals, elected officials, health care professionals, public health professionals, employers, educators, and communities to act and create change. The publication of the rankings stimulates conversations concerning health in each state and across the nation. [1] [2] [3] The fundamental conviction of America's Health Rankings is that each person in his or her capacity as an employee, employer, educator, student, voter, community volunteer, health care professional, public health professional, or elected official can contribute to the advancement of the health of his or her state. [4] [5]

History

America's Health Rankings was first published in 1990 and ranked the 50 US states using 16 health measures. The 2014 25th anniversary edition of the report used 27 Core Measures and 22 Supplemental Measures to evaluate the health of each state and the nation. America's Health Rankings Senior Report started in 2013 and used 34 Core Measures as well as five Supplemental Measures. [6]

Scientific Advisory Committee

In 2002 United Health Foundation and the American Public Health Association commissioned the University of North Carolina at Chapel Hill School of Public Health to do an ongoing review of America's Health Rankings. The Scientific Advisory Committee, currently led by Anna Schenck, PhD, MSPH, formed as a result and was charged with recommending improvements that maintain the value of the comparative, longitudinal information. Improvements also reflect the evolving role and science of public health as well as include adding and refining health measures as they become available and acceptable. The Scientific Advisory Committee includes representatives from local health departments, the American Public Health Association, current and former state health officers, and experts from many academic disciplines.

Measure selection

Four primary considerations drive the design of America's Health Rankings and the selection of each measure:

  1. The overall rankings must represent a broad range of issues that affect a population's health.
  2. Individual measures need to use common health-measurement criteria.
  3. Data have to be available at a state level.
  4. Data must be current and updated periodically.

Components of health

Americas Health Rankings includes in its model of health four groups of Determinants:

  1. Behaviors: Everyday activities that affect personal health habits as well as practices by individuals and families that affect personal health and the use of health resources. Behaviors can be modified especially when individuals are supported by the three other groups of Determinants below.
  2. Community and Environment: Daily conditions for living, working, shopping, exercising, etc., that affect achieving optimal health.
  3. Policy: Availability of resources to encourage and maintain health. Policy also influences the extent that public and health programs penetrate the general population. Policy measures can have a wide reach throughout a state, and they promote healthy living and judicious consumption of health care resources.
  4. Clinical Care: Access to as well as quality, appropriateness, and cost of care received at doctors' offices, clinics, and hospitals.

These four groups of measures influence health Outcomes of a state's population, and improving these Determinants will improve Outcomes. Most measures are a combination of activities in all four groups. For example, the prevalence of smoking is one of the Behaviors strongly influenced by the Community and Environment, by public Policy including taxation and restrictions on smoking in public places, and by Clinical Care received to treat the chemical and behavioral addictions associated with tobacco.

Methodology

America's Health Rankings employs a unique methodology developed and annually reviewed by the Scientific Advisory Committee, a panel of leading public health scholars. This methodology weighs and balances the contributions of factors such as smoking, obesity, binge drinking, high school graduation rates, children in poverty, access to care, and incidence of preventable disease to evaluate the health of a state's population. The report is based on data from the U.S. Departments of Health and Human Services, Commerce, Education and Labor; U.S. Environmental Protection Agency; the American Medical Association; the Dartmouth Atlas of Health Care Project; Centers for Disease Control and Prevention; the Administration on Aging; the National Center for Health Statistics; the Centers for Medicare and Medicaid Services; National Federation to End Senior Hunger; the National Institute for Occupational Safety and Health; the Kaiser Family Foundation; Brown University; the American Geriatrics Society; the Commonwealth Fund; and the Trust for America's Health. [7]

The overall score for each state is calculated by adding the z scores of each measure multiplied by its percentage of total overall ranking (weight) and the effect (positively or negatively correlated) it has on health. Weights for individual metrics vary from 7.5% to 2.5%. The ranking is the ordering of each state according to value. [8]

Description of measures

2014 America’s Health Rankings

The measures used in the 2014 America's Health Rankings are in two subgroups: Core Measures and Supplemental Measures.

Core Measures consist of health Determinants (risk factors), and health Outcomes. Determinants are actions that affect the population's future health, while Outcomes represent what has already occurred through death, disease, or missed days due to illness. There are four groups of Determinants: Behaviors, Community and Environment, Policy, and Clinical Care. The measures in these four groups influence a state's health Outcomes, and improving the Determinants over time will improve Outcomes. [9]

Supplemental Measures provide additional perspective on the health in a state. Supplemental Measures do not factor into a state's overall score and ranking, but they are useful in forming a fuller understanding of the health of a state. [7]

Core measures

Behaviors

  • Smoking: Percentage of adults who are smokers (smoked at least 100 cigarettes in their lifetime and currently smoke). Data from CDC Behavioral Risk Factor Surveillance System (BRFSS) [10]
  • Binge drinking: Percentage of adults who had four or more (women) or five or more (men) alcoholic beverages on at least one occasion in the past 30 days. Data from CDC BRFSS. [10]
  • Drug Deaths: Number of deaths due to drug injury of any intent (unintentional, suicide, homicide, or undetermined) per 100,000 people. Data from the National Vital Statistics System.
  • Obesity: Percentage of adults who are obese with a body mass index (BMI) of 30.0 or higher. Data from CDC BRFSS. [10]
  • Physical inactivity: Percentage of adults who report doing no physical activity or exercise (such as running, calisthenics, golf, gardening, or walking) other than their regular job in the last 30 days. Data from CDC BRFSS. [10]
  • High School Graduation: Percentage of incoming ninth graders who graduate in four years from a high school with a regular degree. Data from the National Center for Education Statistics.

Community and Environment

  • Violent Crime: The number of murders, rapes, robberies, and aggravated assaults per 100,000 population. Data from FBI.
  • Occupational Fatalities: Number of fatal occupational injuries in construction, manufacturing, trade, transportation, utilities, professional, and business services per 100,000 workers. Data from Census of Fatal Occuptional Injuries, Bureau of Economic Analysis.
  • Children in Poverty: The percentage of persons younger than 18 years who live in households at or below the poverty threshold. Data from US Census Current Population Survey, 2014 Annual Social and Economic Supplement.
  • Infectious Disease: Combined average z score using the values of incidence of Chlamydia, pertussis, and Salmonella per 100,000 population. Data from NCHHSTP Atlas, Summary of Notifiable Diseases MMWR.
  • Air Pollution: Average exposure of the general public to particulate matter of 2.5 microns or smaller. Data from EPA and US Census.

Policy

Clinical Care

  • Low birthweight: Percentage of infants weighing less than 2,500 grams (5 pounds, 8 ounces) at birth. Data from the National Vital Statistics System.
  • Primary Care Physicians: Number of primary care physicians (including general practice, family practice, OB-GYN, pediatrics, and internal medicine) per 100,000 population. Data from the AMA.
  • Dentists: Number of dentists per 100,000 population. Data from the ADA.
  • Preventable Hospitalizations: Discharge rate of Medicare beneficiaries from hospitals for ambulatory care-sensitive conditions. Data from The Dartmouth Atlas of Health Care.

Outcomes

  • Diabetes: Percentage of adults who have been told by a health professional that they have diabetes (excludes pre-diabetes and gestational diabetes). Data from CDC BRFSS. [10]
  • Poor Mental Health Days: Number of days in the previous 30 that adults report their mental health was not good. Data from CDC BRFSS. [10]
  • Poor Physical Health Days: Number of days in the previous 30 that adults report their physical health was not good. Data from CDC BRFSS. [10]
  • Disparity in Health Status: Percent difference in adults aged 25 and older with a high school degree versus those without a high school degree who report their health is very good or excellent. Data from CDC BRFSS. [10]
  • Infant Mortality: Number of deaths in the first year of life per 1,000 live births. Data from the National Vital Statistics System.
  • Cardiovascular Deaths: Number of deaths due to all cardiovascular diseases, including heart disease and strokes, per 100,000 populations. Data from the National Vital Statistics System.
  • Cancer Deaths: Number of deaths due to all causes of cancer per 100,000 population. Data from the National Vital Statistics System.
  • Premature Death: Number of years of potential life lost before age 75 per 100,000 population. Data from the National Vital Statistics System.

Supplemental measures

Behaviors

  • Cholesterol Check: Percentage of adults who have had their blood cholesterol checked within the last five years. Data from CDC BRFSS. [10]
  • Dental Visit: Percentage of adults who have visited the dentist or dental clinic within the past year for any reason. Data from CDC BRFSS. [10]
  • Diet-Fruits: Number of fruits consumed by adults on an average day. Data from CDC BRFSS. [10]
  • Diet-Vegetables: Number of vegetables consumed by adults on an average day. Data from CDC BRFSS. [10]
  • Excessive Drinking: Percentage of adults that report either binge drinking (males having five or more drinks on one occasion, females having four or more drinks on one occasion) or heavy drinking (males having more than two drinks per day, females having more than one drink per day over a 30-day period). Data from CDC's BRFSS. [10]
  • Insufficient Sleep: Percentage of adults who report sleeping fewer than seven hours in a 24-hour period, on average. Data from CDC's BRFSS. [10]
  • Teen Birth rate: Number of births per 1,000 females aged 15 to 19 years. Data from CDC National Vital Statistics System. [11]
  • Youth Smoking: Percentage of high school young adults who smoked cigarettes at least one day during the last 30 days. Data from the Youth Behavioral Risk Surveillance System.
  • Youth Obesity: Percentage of high school students who were greater or equal to the 95th percentile for body mass index (BMI). Data from the Youth Behavioral Risk Surveillance System.

Chronic Disease

  • Heart Disease: Percentage of adults told by a health professional they have angina or coronary heart disease. Data from CDC BRFSS. [10]
  • High Cholesterol: Percentage of adults who have had their cholesterol checked and been told it was high Data from CDC BRFSS. [10]
  • Heart Attack: Percentage of adults who have been told by a health professional they had a heart attack (myocardial infarction). Data from CDC BRFSS. [10]
  • Stroke: Percentage of adults who have been told by a health professional they had a stroke. Data from CDC BRFSS. [10]
  • Hypertension: Percentage of adults who have been told by a health professional they have high blood pressure. Data from CDC BRFSS. [10]

Clinical Care

Economic Environment

  • Personal Income: Per capita personal income in current dollars. Data from US Bureau of Economic Analysis
  • Median Household Income: The amount of income that divides the income distribution into 2 equal groups. Data from US Census Bureau, Current Population Survey, Annual Social and Economic Supplements
  • Unemployment Rate: Total unemployed as a percentage of the civilian labor force (U-3 definition). Data from US Bureau of Labor Statistics
  • Underemployment Rate: Total unemployed, plus all marginally attached workers, plus total employed part-time for economic reasons, as a percent of the civilian labor force (U-6 Definition). Data from US Bureau of Labor Statistics
  • Income Disparity (Gini coefficient): A common measure of income inequality, where 0 represents complete equality and 1 indicates complete inequality. Data from US Census

Outcomes

  • High Health Status: Percentage of adults reporting their health as very good or excellent. Data from CDC BRFSS. [10]
  • Suicide: Number of deaths due to intentional self-harm per 100,000 population. Data from CDC National Vital Statistics System. [11]

2015 America’s Health Rankings Senior Report

The measures that comprise 2015 America's Health Rankings Senior Report are in two subgroups: Core Measures and Supplemental Measures.

Core Measures consist of health Determinants (risk factors), and health Outcomes. Determinants are actions that affect the population's future health, while Outcomes represent what has already occurred through death, disease, or missed days due to illness. There are four groups of Determinants: Behaviors, Community and Environment, Policy, and Clinical Care. The measures in these four groups influence a state's health Outcomes, and improving the Determinants over time will improve Outcomes. [9]

Supplemental Measures provide additional perspective on the health in a state. Supplemental Measures do not factor into a state's overall score and ranking, but they are useful in forming a fuller understanding of the health of a state.

Core measures

Behaviors

  • Smoking: Percentage of adults aged 65 and older who smoked at least 100 cigarettes in their lifetime and currently smoke daily or some days. Data from CDC BRFSS. [10]
  • Chronic drinking: Percentage of adults aged 65 and older who in the last 30 days consumed more than two drinks per day for men and more than one drink per day for women. Data from CDC BRFSS. [10]
  • Obesity: Percentage of adults who are obese with a body mass index (BMI) of 30.0 or higher. Data from CDC BRFSS. [10]
  • Underweight: Percentage of adults aged 65 and older with fair or better health status estimated to be underweight with a body mass index (BMI) of 18.5 or less. Data from CDC BRFSS. [10]
  • Physical inactivity Percentage of adults aged 65 and older with fair or better health status who report doing no physical activity or exercise (such as running, calisthenics, golf, gardening or walking) other than their regular job in the last 30 days. Data from CDC BRFSS. [10]
  • Pain Management: Percentage of adults aged 65 and older with arthritis who report arthritis or joint pain does not limit their usual activities. Data from CDC BRFSS. [10]

Community and Environment

  • Poverty: Percentage of adults aged 65 and older who live in households at or below 100% of the poverty threshold. Data from US Census Bureau, American Community Survey.
  • Volunteerism: Percentage of adults aged 65 and older who report volunteering in the past 12 months. Data from US Census Bureau, Current Population Survey.
  • Nursing home Quality: Percentage of certified nursing home beds rated 4- or 5-stars (2015 revised CMS definition). Data from CMS.
  • Home-Delivered Meals: Number of persons served a home-delivered meal as a percentage of adults aged 65 and older living in poverty. Data from the Administration on Aging and the US Census Bureau, American Community Survey.
  • Food Insecurity: Percentage of adults aged 60 and older who are marginally food insecure. Data from National Foundation to End Senior Hunger
  • Community Support: Total expenditures captured by the Administration on Aging divided by the number of adults aged 65 and older living in poverty. Data from the Administration on Aging and the US Census Bureau, American Community Survey.

Policy

  • Low-Care Nursing Home Residents: Percentage of nursing home residents who were low care according to this broad definition: no physical assistance required for late-loss activities of daily living. Data from Brown University.
  • Prescription Drug Coverage: Percentage of adults aged 65 and older who have a creditable prescription drug plan. Data from Kaiser Foundation.
  • SNAP Reach: Number of adults aged 60 and older who participate in the Supplemental Nutrition Assistance Plan (SNAP) as a percentage of adults aged 60 and older living in poverty. Data from the US Department of Agriculture Food and Nutrition Service and the US Census Bureau, American Community Survey.
  • Geriatrician Shortfall: Estimated geriatrician shortfall as a percentage of the minimum required number. Data from The American Geriatrics Society.

Clinical Care

  • Dedicated Health Care Provider: Percentage of adults aged 65 and older who report having a personal doctor or health care provider. Data from CDC BRFSS. [10]
  • Flu vaccine: Percentage of adults aged 65 and older who received a flu vaccine in the last year. Data from CDC BRFSS. [10]
  • Health Screenings: Percentage of adults aged 65 to 74 who have had mammograms and/or fecal occult blood/colonoscopy/sigmoidoscopy screens within the recommended time period. Data from CDC BRFSS. [10]
  • Recommended Hospital Care: Percentage of hospitalized patients aged 65 and older who received the recommended care for heart attack, heart failure, pneumonia, and surgical procedures. Data from The Commonwealth Fund.
  • Diabetes Management: Percentage of Medicare beneficiaries aged 65 to 75 with diabetes receiving a blood lipids test. Data from The Dartmouth Atlas of Health Care.
  • Home Health Care: Number of personal care and home health aides per 1,000 adults aged 75 or older. Data from US Bureau of Labor Statistics.
  • Preventable Hospitalizations: Number of discharges for ambulatory care-sensitive conditions per 1,000 Medicare beneficiaries. Data from The Dartmouth Atlas of Health Care.
  • Hospital Readmissions: Number of discharges for ambulatory care-sensitive conditions per 1,000 Medicare beneficiaries. Data from The Dartmouth Atlas of Health Care.
  • Hospice Care: Percentage of decedents aged 65 and older who were enrolled in hospice during the last six months of life after diagnosis of a condition with high probability of death. Data from The Dartmouth Atlas of Health Care.
  • Hospital Deaths: Percentage of decedents aged 65 and older who died in a hospital. Data from The Dartmouth Atlas of Health Care.

Outcomes

  • ICU Use: Percentage of decedents aged 65 and older spending seven or more days in the intensive care unit/critical care unit during the last six months of life. Data from The Dartmouth Atlas of Health Care.
  • Falls: Percentage of adults aged 65 and older who report having had a fall in the last 12 months. Data from CDC BRFSS. [10]
  • Hip Fractures: Rate of hospitalization for hip fracture per 1,000 Medicare beneficiaries. Data from The Dartmouth Atlas of Health Care.
  • Health Status: Percentage of adults aged 65 and older who report their health is very good or excellent. Data from CDC BRFSS. [10]
  • Able-bodied: Percentage of adults aged 65 and older with no disability. Data from US Census Bureau, American Community Survey.
  • Premature Death: Number of years of potential life lost before age 75 per 100,000 population. Data from CDC National Center for Health Statistics.
  • Teeth Extractions: Percentage of adults aged 65 and older who have had all teeth removed due to tooth decay or gum disease. Data from CDC BRFSS. [10]
  • Poor Mental Health Days: Number of days in the previous 30 that adults aged 65 or older indicate their mental health was not good. Data from CDC BRFSS. [10]

Supplemental measures

  • Education: Percentage of adults aged 65 and older with a college degree. Data from US Census Bureau, American Community Survey.
  • Prescription Drug Plan With Gap: Percentage of prescription drug plans with a Medicare Part D coverage gap (“donut hole”). Data from the Kaiser Family Foundation.
  • Multiple Chronic conditions: percentage of Medicare beneficiaries with four or more chronic conditions. Data from Centers for Medicare and Medicaid Services.
  • Cognition: Percentage of adults aged 65 and older who report having a cognitive difficulty. Data from US Census Bureau, American Community Survey.
  • Depression: Percentage of adults aged 65 and older who were told by a health professional that they have a depressive disorder. Data from CDC BRFSS. [10]
  • Suicide: Number of deaths due to intentional self-harm per 100,000 adults aged 65 and older. Data from CDC NVSS. [11]

Related Research Articles

<span class="mw-page-title-main">Maternal death</span> Aspect of human reproduction and medicine

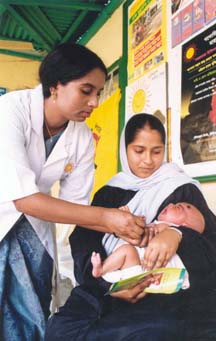
Maternal death or maternal mortality is defined in slightly different ways by several different health organizations. The World Health Organization (WHO) defines maternal death as the death of a pregnant mother due to complications related to pregnancy, underlying conditions worsened by the pregnancy or management of these conditions. This can occur either while she is pregnant or within six weeks of resolution of the pregnancy. The CDC definition of pregnancy-related deaths extends the period of consideration to include one year from the resolution of the pregnancy. Pregnancy associated death, as defined by the American College of Obstetricians and Gynecologists (ACOG), are all deaths occurring within one year of a pregnancy resolution. Identification of pregnancy associated deaths is important for deciding whether or not the pregnancy was a direct or indirect contributing cause of the death.

<span class="mw-page-title-main">Preventive healthcare</span> Prevention of the occurrence of diseases

Preventive healthcare, or prophylaxis, is the application of healthcare measures to prevent diseases. Disease and disability are affected by environmental factors, genetic predisposition, disease agents, and lifestyle choices, and are dynamic processes that begin before individuals realize they are affected. Disease prevention relies on anticipatory actions that can be categorized as primal, primary, secondary, and tertiary prevention.

Disease management is defined as "a system of coordinated healthcare interventions and communications for populations with conditions in which patient self-care efforts are significant."

<span class="mw-page-title-main">Healthcare Effectiveness Data and Information Set</span>

The Healthcare Effectiveness Data and Information Set (HEDIS) is a widely used set of performance measures in the managed care industry, developed and maintained by the National Committee for Quality Assurance (NCQA).

The social determinants of health (SDOH) are the economic and social conditions that influence individual and group differences in health status. They are the health promoting factors found in one's living and working conditions, rather than individual risk factors that influence the risk or vulnerability for a disease or injury. The distribution of social determinants is often shaped by public policies that reflect prevailing political ideologies of the area.

A chronic condition is a health condition or disease that is persistent or otherwise long-lasting in its effects or a disease that comes with time. The term chronic is often applied when the course of the disease lasts for more than three months. Common chronic diseases include diabetes, functional gastrointestinal disorder, eczema, arthritis, asthma, chronic obstructive pulmonary disease, autoimmune diseases, genetic disorders and some viral diseases such as hepatitis C and acquired immunodeficiency syndrome. An illness which is lifelong because it ends in death is a terminal illness. It is possible and not unexpected for an illness to change in definition from terminal to chronic. Diabetes and HIV for example were once terminal yet are now considered chronic due to the availability of insulin for diabetics and daily drug treatment for individuals with HIV which allow these individuals to live while managing symptoms.

<span class="mw-page-title-main">Prevalence of tobacco use</span> Percentage of population smoking tobacco

Prevalence of tobacco use is reported by the World Health Organization (WHO), which focuses on cigarette smoking due to reported data limitations. Smoking has therefore been studied more extensively than any other form of consumption.

Healthy People is a program of a nationwide health-promotion and disease-prevention goals set by the United States Department of Health and Human Services. The goals were first set in 1979 "in response to an emerging consensus among scientists and health authorities that national health priorities should emphasize disease prevention". The Healthy People program was originally issued by the Department of Health, Education and Welfare. This first issue contained "a report announcing goals for a ten-year plan to reduce controllable health risks. In its section on nutrition, the report recommended diets with fewer calories; less saturated fat, cholesterol, salt, and sugar; relatively more complex carbohydrates, fish and poultry; and less red meat." Though this recommended diet consisted of more processed foods rather than fresh produce, the report advised for consumers to "be wary of processed foods". The goals were subsequently updated for Healthy People 2000, Healthy People 2010, Healthy People 2020 and Healthy People 2030.

<span class="mw-page-title-main">Healthcare in Europe</span>

Healthcare in Europe is provided through a wide range of different systems run at individual national levels. Most European countries have a system of tightly regulated, competing private health insurance companies, with government subsidies available for citizens who cannot afford coverage. Many European countries offer their citizens a European Health Insurance Card which, on a reciprocal basis, provides insurance for emergency medical treatment insurance when visiting other participating European countries.

<span class="mw-page-title-main">Health in the United States</span> Overall health of the population of the United States

Health may refer to "a state of complete physical, mental and social well-being and not merely the absence of disease and infirmity.", according to the World Health Organization (WHO). 78.7 was the average life expectancy for individuals at birth in 2017. The highest cause of death for United States citizens is heart disease. Sexually transmitted infections impact the health of approximately 19 million yearly. The two most commonly reported infections include chlamydia and gonorrhea. The United States is currently challenged by the COVID-19 pandemic, and is 19th in the world in COVID-19 vaccination rates. All 50 states in the U.S. require immunizations for children in order to enroll in public school, but various exemptions are available by state. Immunizations are often compulsory for military enlistment in the United States.

Healthcare reform in the United States has a long history. Reforms have often been proposed but have rarely been accomplished. In 2010, landmark reform was passed through two federal statutes: the Patient Protection and Affordable Care Act (PPACA), signed March 23, 2010, and the Health Care and Education Reconciliation Act of 2010, which amended the PPACA and became law on March 30, 2010.

<span class="mw-page-title-main">Demographics of Massachusetts</span> Demographics of the U.S. state

Massachusetts has an estimated population of 6.981 million as of 2022 according to the U.S. Census Bureau. This represents a −0.7% decrease in population from the 2020 census, when the population was 7.029 million. Currently, Massachusetts is the sixteenth most populous U.S. state.

<span class="mw-page-title-main">Health insurance coverage in the United States</span>

In the United States, health insurance coverage is provided by several public and private sources. During 2019, the U.S. population overall was approximately 330 million, with 59 million people 65 years of age and over covered by the federal Medicare program. The 273 million non-institutionalized persons under age 65 either obtained their coverage from employer-based or non-employer based sources, or were uninsured. During the year 2019, 89% of the non-institutionalized population had health insurance coverage. Separately, approximately 12 million military personnel received coverage through the Veteran's Administration and Military Health System.

<span class="mw-page-title-main">Obesity in the United States</span> Overview of obesity in the United States of America

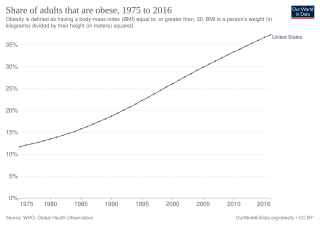
Obesity is common in the United States and is a major health issue associated with numerous diseases, specifically an increased risk of certain types of cancer, coronary artery disease, type 2 diabetes, stroke, and cardiovascular disease, as well as significant increases in early mortality and economic costs.

<span class="mw-page-title-main">Suicide in the United States</span> Statistics and causes of suicide in the U.S.

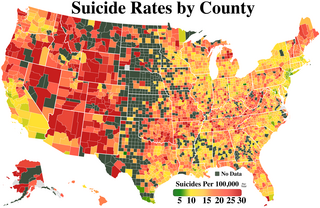
Suicide is a major national public health issue in the United States. The country has one of the highest suicide rates among wealthy nations. In 2020, there were 45,799 recorded suicides, up from 42,773 in 2014, according to the CDC's National Center for Health Statistics (NCHS). On average, adjusted for age, the annual U.S. suicide rate increased 30% between 2000 and 2020, from 10.4 to 13.5 suicides per 100,000 people. In 2018, 14.2 people per 100,000 died by suicide, the highest rate recorded in more than 30 years. Due to the stigma surrounding suicide, it is suspected that suicide is generally underreported. In April 2016, the CDC released data showing that the suicide rate in the United States had hit a 30-year high, and later in June 2018, released further data showing that the rate has continued to increase and has increased in every U.S. state except Nevada since 1999. From 2000 to 2020, more than 800,000 people died by suicide in the United States, with males representing 78.7% of all suicides that happened between 2000 and 2020. In 2022, a record high 49,500 people died by suicide, while the suicide rate in 2022 reached its highest level since 1941 at 14.3 per 100,000 persons. Surging death rates from suicide, drug overdoses and alcoholism, what researchers refer to as "deaths of despair", are largely responsible for a consecutive three year decline of life expectancy in the U.S. This constitutes the first three-year drop in life expectancy in the U.S. since the years 1915–1918.

Healthcare in the United States is largely provided by private sector healthcare facilities, and paid for by a combination of public programs, private insurance, and out-of-pocket payments. The U.S. is the only developed country without a system of universal healthcare, and a significant proportion of its population lacks health insurance.

The social determinants of health in poverty describe the factors that affect impoverished populations' health and health inequality. Inequalities in health stem from the conditions of people's lives, including living conditions, work environment, age, and other social factors, and how these affect people's ability to respond to illness. These conditions are also shaped by political, social, and economic structures. The majority of people around the globe do not meet their potential best health because of a "toxic combination of bad policies, economics, and politics". Daily living conditions work together with these structural drivers to result in the social determinants of health.

Health care finance in the United States discusses how Americans obtain and pay for their healthcare, and why U.S. healthcare costs are the highest in the world based on various measures.

An infection rate or incident rate is the probability or risk of an infection in a population. It is used to measure the frequency of occurrence of new instances of infection within a population during a specific time period.

The COVID-19 pandemic has had an unequal impact on different racial and ethnic groups in the United States, resulting in new disparities of health outcomes as well as exacerbating existing health and economic disparities.

References

  1. Peppard, PE; Kindig, DA; Dranger, E; Jovaag, A; Remington, PL (2008). "Ranking community health status to stimulate discussion of local public health issues: the Wisconsin County Health Rankings". Am J Public Health. 98 (2): 209–12. doi:10.2105/AJPH.2006.092981. PMC   2376892 . PMID   18172156.
  2. Shelley EmlingGuest Writer (May 21, 2014). "National Report Reveals Healthiest States For Older Adults | HuffPost". Huffingtonpost.com. Retrieved July 20, 2019.
  3. "America's Health Rankings: Hawaii No. 1". finance.yahoo.com. December 11, 2013.
  4. Erwin, PC; Myers, CR; Myers, GM; Daugherty, LM (2011). "State responses to America's Health Rankings: the search for meaning, utility, and value". J Public Health Manag Pract. 17: 406–12. doi:10.1097/PHH.0b013e318211b49f. PMID   21788777.
  5. Erwin, PC; Greene, SB; Mays, GP; Ricketts, TC; Davis, MV (2011). "The association of changes in local health department resources with changes in state-level health outcomes". Am J Public Health. 101 (4): 609–15. doi:10.2105/AJPH.2009.177451. PMC   3052341 . PMID   20558799.
  6. "History of Rankings".
  7. 1 2 "About the Annual Report".
  8. "Explore Health Measures in the United States | 2018 Annual Report". America's Health Rankings.
  9. 1 2 "About the Senior Report".
  10. 1 2 3 4 5 6 7 8 9 10 11 12 13 14 15 16 17 18 19 20 21 22 23 24 25 26 27 28 29 30 31 32 33 34 CDC Behavioral Risk Factor Surveillance System (BRFSS).
  11. 1 2 3 4 National Vital Statistics System.