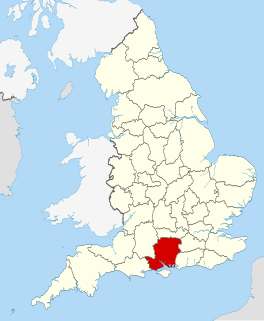
The 2012 Basingstoke and Deane Council election was held on 3 May 2012 to elect members of Basingstoke and Deane Borough Council in Hampshire, England. 21 out of 60 seats were up for reelection; Popley East had two council seats up for reelection. The Conservative Party retained control of the council with 32 out of 60 seats, losing one seat to the Labour Party in Buckskin and losing another seat in Bramley and Sherfield to an Independent. Labour overtook the Liberal Democrats to become the largest opposition party and won two seats from them in Brighton Hill South and Brookvale and Kings Furlong.
Basingstoke and Deane is a local government district and borough in Hampshire, England. Its primary settlement is Basingstoke. Other settlements include Bramley, Tadley, Kingsclere, Overton, Oakley, Whitchurch and the hamlet of Deane, some 7 miles (11 km) from Basingstoke.
Borough status in the United Kingdom is granted by royal charter to local government districts in England, Wales and Northern Ireland. The status is purely honorary, and does not give any additional powers to the council or inhabitants of the district. In Scotland, similarly chartered communities were known as royal burghs, although the status is no longer granted.
Hampshire is a county on the southern coast of England. The county town, with city status, is Winchester, a frequent seat of the Royal Court before any fixed capital, in late Anglo-Saxon England. After the metropolitan counties and Greater London, Hampshire is the most populous ceremonial county in the United Kingdom. Its two largest settlements, Southampton and Portsmouth, are administered separately as unitary authorities and the rest of the area forms the administrative county, which is governed by Hampshire County Council.
Party | Seats | Gains | Losses | Net gain/loss | Seats % | Votes % | Votes | +/− | |
---|---|---|---|---|---|---|---|---|---|
Conservative | 32 | 0 | 2 | -2 | 53.3 | 44.6 | 12,904 | ||
Labour | 14 | 3 | 0 | +3 | 23.3 | 29.0 | 8,388 | ||
Liberal Democrat | 11 | 0 | 2 | -2 | 18.3 | 16.6 | 4,890 | ||
Independent | 3 | 1 | 0 | +1 | 5 | 7.1 | 2,045 | ||
UKIP | 0 | 0 | 0 | 0 | 2.6 | 755 | |||
Green | 0 | 0 | 0 | 0 | 0.1 | 38 | |||
Party | Candidate | Votes | % | ± | |
---|---|---|---|---|---|
Conservative | Sven Godesen | 1676 | 73.2 | ||
Labour | Stephen Drake | 321 | 14.0 | ||
Liberal Democrat | Barbara Cummins | 290 | 12.7 | ||
Turnout | 2287 | ||||
Conservative hold | Swing | ||||
Party | Candidate | Votes | % | ± | |
---|---|---|---|---|---|
Liberal Democrat | Mike Bound | 645 | 43.4 | ||
Conservative | Robert Tate | 636 | 42.8 | ||
Labour | David Carr | 205 | 13.8 | ||
Turnout | 1486 | ||||
Liberal Democrat hold | Swing | ||||
Party | Candidate | Votes | % | ± | |
---|---|---|---|---|---|
Independent | Chris Tomblin | 776 | 51.9 | ||
Conservative | Rhydiain Vaughn | 603 | 40.4 | ||
Labour | Nigel Pierce | 115 | 7.7 | ||
Turnout | 1494 | ||||
Independent gain from Conservative | Swing | ||||
Party | Candidate | Votes | % | ± | |
---|---|---|---|---|---|
Labour | David Eyre | 484 | 41.3 | ||
Liberal Democrat | Kevin Harkness | 338 | 28.9 | ||
UKIP | David Watson | 168 | 14.3 | ||
Conservative | John Downes | 143 | 12.2 | ||
Green | Christopher Appleby | 38 | 3.2 | ||
Turnout | 1171 | ||||
Labour gain from Liberal Democrat | Swing | ||||
Party | Candidate | Votes | % | ± | |
---|---|---|---|---|---|
Labour | Jack Cousens | 541 | 38.6 | ||
Liberal Democrat | Doris Jones | 433 | 30.9 | ||
Conservative | Rebecca Sanders | 222 | 15.8 | ||
UKIP | Alan Stone | 205 | 14.6 | ||
Turnout | 1401 | ||||
Labour gain from Liberal Democrat | Swing | ||||
Party | Candidate | Votes | % | ± | |
---|---|---|---|---|---|
Labour | Tony Jones | 506 | 43.6 | ||
Conservative | Stephen Reid | 454 | 39.1 | ||
Independent | Ray Dobing | 159 | 13.7 | ||
Liberal Democrat | Thomas Mitchell | 43 | 3.7 | ||
Turnout | 1162 | ||||
Labour gain from Conservative | Swing | ||||
Party | Candidate | Votes | % | ± | |
---|---|---|---|---|---|
Conservative | Elaine Still | 900 | 46.9 | ||
Independent | Jo Walke | 735 | 38.3 | ||
Labour | Ann Chapman | 183 | 9.5 | ||
Liberal Democrat | Liam Elvish | 100 | 5.2 | ||
Turnout | 1918 | ||||
Conservative hold | Swing | ||||
Party | Candidate | Votes | % | ± | |
---|---|---|---|---|---|
Conservative | Dan Putty | 914 | 58.0 | ||
Labour | Carl Reader | 253 | 16.0 | ||
Liberal Democrat | Ruth Day | 214 | 13.6 | ||
UKIP | John Kearney | 196 | 12.4 | ||
Turnout | 1577 | ||||
Conservative hold | Swing | ||||
Party | Candidate | Votes | % | ± | |
---|---|---|---|---|---|
Conservative | Anne Court | 71.1 | |||
Labour | Walter McCormick | 361 | 19.8 | ||
Liberal Democrat | Stav O'Doherty | 165 | 9.1 | ||
Turnout | 1822 | ||||
Conservative hold | Swing | ||||
Party | Candidate | Votes | % | ± | |
---|---|---|---|---|---|
Conservative | Cathy Osselton | 823 | 68.9 | ||
Labour | John Rodway | 372 | 31.1 | ||
Turnout | 1195 | ||||
Conservative hold | Swing | ||||
Party | Candidate | Votes | % | ± | |
---|---|---|---|---|---|
Labour | Paul Harvey | 1100 | 72.2 | ||
Conservative | Kenneth Rhatigan | 272 | 17.8 | ||
Liberal Democrat | Louise Hall | 160 | 10.4 | ||
Turnout | 1532 | ||||
Labour hold | Swing | ||||
Party | Candidate | Votes | % | ± | |
---|---|---|---|---|---|
Conservative | Diane Taylor | 1422 | 74.0 | ||
Labour | Barnaby Wheller | 322 | 16.8 | ||
Liberal Democrat | Robert Cooper | 177 | 9.2 | ||
Turnout | 1921 | ||||
Conservative hold | Swing | ||||
Party | Candidate | Votes | % | ± | |
---|---|---|---|---|---|
Conservative | Roger Gardiner | 837 | 59.7 | ||
Independent | Steve Spillane | 375 | 26.7 | ||
Labour | Terry Price | 190 | 13.6 | ||
Turnout | 1402 | ||||
Conservative hold | Swing | ||||
Popley East had two seats up for re-election due to a vacancy. Thus, unlike the other wards, it elected councillors with plurality at-large voting rather than first past the post. If the top candidate method is used to gauge the number of votes for party (i.e. assuming the number of votes in support of a party is equal to the number of votes for its most popular candidate) instead of the raw vote, then the party's vote shares are: Labour 72.3%, Conservatives 16.2% and Liberal Democrats 11.4%.
]Party | Candidate | Votes | % | ± | |
---|---|---|---|---|---|
Labour | Vivien Washbourne | 651 | 39.6 | ||
Labour | David Potter | 607 | 36.9 | ||
Conservative | Richard Court | 146 | 8.9 | ||
Conservative | Laura Edwards | 139 | 8.4 | ||
Liberal Democrat | Michael Berwick-Gooding | 103 | 6.3 | ||
Turnout | 1646 (by 879 voters) | ||||
Labour hold | Swing | ||||
Party | Candidate | Votes | % | ± | |
---|---|---|---|---|---|
Labour | Jane Frankum | 632 | 76.1 | ||
Conservative | Paul Watts | 142 | 17.1 | ||
Liberal Democrat | Steven Whitechurch | 56 | 6.7 | ||
Turnout | 830 | ||||
Labour hold | Swing | ||||
Party | Candidate | Votes | % | ± | |
---|---|---|---|---|---|
Conservative | Karen Cherrett | 246 | 58.0 | ||
Labour | Alice James | 119 | 28.1 | ||
Liberal Democrat | Richard Whitechurch | 30 | 7.1 | ||
UKIP | Ann Williams | 29 | 6.8 | ||
Turnout | 424 | ||||
Conservative hold | Swing | ||||
Party | Candidate | Votes | % | ± | |
---|---|---|---|---|---|
Conservative | John Leek | 494 | 76.6 | ||
Labour | Lydia Massey | 90 | 14.0 | ||
Liberal Democrat | Janice Spalding | 61 | 9.5 | ||
Turnout | 645 | ||||
Conservative hold | Swing | ||||
Party | Candidate | Votes | % | ± | |
---|---|---|---|---|---|
Labour | Colin Regan | 977 | 56.2 | ||
Conservative | Jim Holder | 328 | 18.9 | ||
Liberal Democrat | Madeline Hussey | 277 | 15.9 | ||
UKIP | Duncan Stone | 157 | 9.0 | ||
Turnout | 1739 | ||||
Labour hold | Swing | ||||
Party | Candidate | Votes | % | ± | |
---|---|---|---|---|---|
Conservative | David Leeks | 685 | 61.7 | ||
Liberal Democrat | Jo Slimin | 231 | 20.8 | ||
Labour | Peter McCann | 195 | 17.6 | ||
Turnout | 1111 | ||||
Conservative hold | Swing | ||||
Party | Candidate | Votes | % | ± | |
---|---|---|---|---|---|
Liberal Democrat | Eric Dunlop | 791 | 53.4 | ||
Conservative | Ian Green | 526 | 35.5 | ||
Labour | Nuria Pett | 164 | 11.1 | ||
Turnout | 1481 | ||||
Liberal Democrat hold | Swing | ||||
Preceded by Basingstoke and Deane Council election, 2011 | Basingstoke and Deane local elections | Succeeded by Basingstoke and Deane Council election, 2014 |
The 2007 council elections in Guildford saw the Conservatives retain control over Guildford Borough Council. Full results for each ward can be found at Guildford Council election, full results, 2007.
The 2002 Wakefield Metropolitan District Council election took place on 2 May 2002 to elect members of Wakefield Metropolitan District Council in West Yorkshire, England. One third of the council was up for election and the Labour party kept overall control of the council.
The 2012 Scottish local elections, were held on 3 May, in all 32 local authorities. The Scottish National Party (SNP) overtook Labour to win the highest share of the vote, and retained and strengthened its position as the party with most councillors. Labour also made gains, while the Liberal Democrats experienced meltdown, falling behind the Conservatives. For the first time since the introduction of the Single Transferable Vote system, the SNP won majority control of 2 councils, from no overall control. Labour also won majority control of 2 councils from no overall control, while retaining majority control over 2 councils.
The 2004 South Tyneside Metropolitan Borough Council election took place on 10 June 2004 to elect members of South Tyneside Metropolitan Borough Council in Tyne and Wear, England. The whole council was up for election with boundary changes since the last election in 2003 reducing the number of seats by 6. The Labour party stayed in overall control of the council.
The 2011 council elections in Guildford saw the Conservatives retain control over Guildford Borough Council with an increased majority of 20 seats. Full results for each ward can be found at Guildford Council election, full results, 2011.
The 1998 Basingstoke and Deane Council election took place on 7 May 1998 to elect members of Basingstoke and Deane Borough Council in Hampshire, England. One third of the council was up for election and the council stayed under no overall control.
The 2002 Basingstoke and Deane Council election took place on 2 May 2002 to elect members of Basingstoke and Deane Borough Council in Hampshire, England. The whole council was up for election with boundary changes since the last election in 2000 increasing the number of seats by 3. The council stayed under no overall control.
The 2004 Basingstoke and Deane Council election took place on 10 June 2004 to elect members of Basingstoke and Deane Borough Council in Hampshire, England. One third of the council was up for election and the council stayed under no overall control.
The 2006 Basingstoke and Deane Council election took place on 4 May 2006 to elect members of Basingstoke and Deane Borough Council in Hampshire, England. One third of the council was up for election and the council stayed under no overall control.
The 2007 Basingstoke and Deane Council election took place on 3 May 2007 to elect members of Basingstoke and Deane Borough Council in Hampshire, England. One third of the council was up for election and the Conservative party stayed in overall control of the council.
The 2008 Basingstoke and Deane Council election took place on 1 May 2008 to elect members of Basingstoke and Deane Borough Council in Hampshire, England. The whole council was up for election with boundary changes since the 2007 election. The Conservative party gained overall control of the council from no overall control.
The 2010 Basingstoke and Deane Council election took place on 6 May 2010 to elect members of Basingstoke and Deane Borough Council in Hampshire, England. One third of the council was up for election and the Conservative party stayed in overall control of the council.
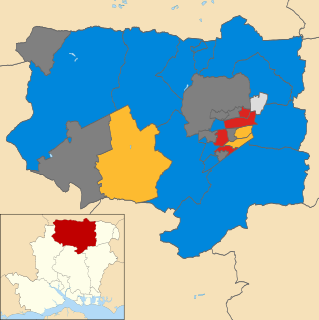
The 2011 Basingstoke and Deane Council election took place on 5 May 2011 to elect members of Basingstoke and Deane Borough Council in Hampshire, England. One third of the council was up for election and the Conservative party stayed in overall control of the council.
The 2014 Basingstoke and Deane Borough Council election took place on 22 May 2014 to elect members of Basingstoke and Deane Borough Council in England. This was on the same day as other local elections.
The 2008 Colchester Borough Council election took place on 1 May 2008 to elect members of Colchester Borough Council in Essex, England. One third of the council was up for election and the Conservative party lost overall control of the council to no overall control.
The 2015 Basingstoke and Deane Borough Council election took place on 7 May 2015 to elect members of Basingstoke and Deane Borough Council in England. It was held on the same day as the 2015 general election as well as other local elections.
The 2015 Guildford Borough Council election took place on 7 May 2015 to elect members of Guildford Borough Council in England as one of the 2015 local elections, held simultaneously with the General Election.
The 2007 West Oxfordshire District Council election took place on 3 May 2007 to elect members of West Oxfordshire District Council in Oxfordshire, England. One third of the council was up for election and the Conservative party stayed in overall control of the council.
The 2012 West Oxfordshire District Council election took place on 3 May 2012 to elect members of West Oxfordshire District Council in Oxfordshire, England. One third of the council was up for election and the Conservative party stayed in overall control of the council.