This article is being considered for deletion in accordance with Wikipedia's deletion policy. Please share your thoughts on the matter at this article's deletion discussion page. |
This article is a comparison of the Benelux countries .
This article is being considered for deletion in accordance with Wikipedia's deletion policy. Please share your thoughts on the matter at this article's deletion discussion page. |
This article is a comparison of the Benelux countries .
| Country | Area (km²) | Land area (km²) | Water area (km²) |
|---|---|---|---|
| 30,528 [1] | 30,278 [1] | 250 [1] | |
| 41,543 [2] | 33,893 [2] | 7,650 [2] | |
| 2,586 [3] | 2,586 [3] | 0 [3] |
| Country | Political systems | Power source | Power structure |
|---|---|---|---|
| Parliamentary system | Constitutional monarchy | Federal state | |
| Parliamentary system | Unitary state | ||
| Parliamentary system | |||
| Parliamentary system | |||
| Parliamentary system | |||
| Parliamentary system |
| Country | Council of Europe | Benelux Union | ECHR | European Union | NATO | OECD a | United Nations | WTO |
|---|---|---|---|---|---|---|---|---|
| 5 May 1949 | Yes | Yes | 1958 | 4 April 1949 | 13 September 1961 | 27 December 1945 | Yes | |
| 5 May 1949 | Yes | Yes | 1958 | 4 April 1949 | 13 September 1961 | 10 December 1945 | Yes | |
| 5 May 1949 | Yes | Yes | 1958 | 4 April 1949 | 7 December 1961 | 24 October 1945 | Yes |
a Luxembourg, Netherlands and Belgium were among the founders of the predecessor of the OECD, the OEEC, in 1948
| Country | GDP total (PPP) [7] [8] | GDP per capita (PPP) [9] [10] | GDP total (nominal) [11] [12] | GDP per capita (nominal) [13] [14] | Gini [15] | HDI |
|---|---|---|---|---|---|---|
(37th) | (20th) | (26th) | (17nd) | (13th) | ||
(28th) | (12nd) | (19th) | (13nd) | (10th) | ||
(97th) | (1st) | (72nd) | (1st) | (17th) |
| Country | Population | Density (per km²) | Immigration (%) |
|---|---|---|---|
| 11,250,585 | 363.6 | 2.9 | |
| 17,000,059 | 407.8 | 11.1 | |
| 562,958 | 194.1 | 44.5 |
| Country | Internet TLD | ISO 3166 code | Calling code |
|---|---|---|---|
| .be | BE | +32 | |
| .nl, .bq | NL | +31, +599 | |
| .lu | LU | +352 |

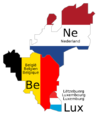
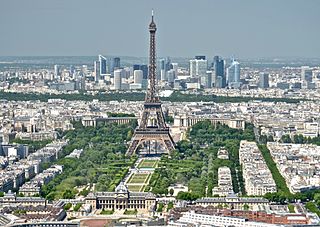
The Benelux Union or Benelux, is a politico-economic union and formal international intergovernmental cooperation of three neighboring states in western Europe: Belgium, the Netherlands, and Luxembourg. The name is a portmanteau formed from joining the first few letters of each country's name and was first used to name the customs agreement that initiated the union. It is now used more generally to refer to the geographic, economic, and cultural grouping of the three countries.

The economy of Latvia is an open economy in Europe and is part of the European Single Market. Latvia is a member of the World Trade Organization (WTO) since 1999, a member of the European Union since 2004, a member of the Eurozone since 2014 and a member of the OECD since 2016. Latvia is ranked the 14th in the world by the Ease of Doing Business Index prepared by the World Bank Group. According to the Human Development Report 2011, Latvia belongs to the group of very high human development countries. Due to its geographical location, transit services are highly developed, along with timber and wood processing, agriculture and food products, and manufacturing of machinery and electronic devices.

The economy of Luxembourg is largely dependent on the banking, steel, and industrial sectors. Luxembourgers enjoy the highest per capita gross domestic product in the world, according to an IMF estimate in 2022.

Once a single-crop agricultural economy, Saint Lucia has shifted to a tourism and banking serviced-based economy. Tourism, the island's biggest industry and main source of jobs, income and foreign exchange, accounts for 65% of its GDP. Agriculture, which was once the biggest industry, now contributes to less than 3% of GDP, but still accounts for 20% of jobs. The banana industry is now on a decline due to strong competition from low-cost Latin American producers and reduced European trade preferences, but the government has helped revitalize the industry, with 13,734 tonnes exported in 2018. Agricultural crops grown for export are bananas, mangoes, and avocados. The island is considered to have the most diverse and well-developed manufacturing industry in the eastern Caribbean.

The economy of San Marino is a developed free-market economy focused on industries such as tourism, banking, and the manufacture of ceramics, clothing, fabrics, furniture, paints, spirits, tiles, and wine. Taken together, the manufacturing and financial sector make up more than half of the national GDP. The primary sector contribution to the GDP of the country is marginal, with the main agricultural products being wine and cheeses. In addition, San Marino sells collectible postage stamps to philatelists.
The economy of Belgium is a highly developed, high-income, mixed economy.
A developed country, orhigh-income country, is a sovereign state that has a high quality of life, developed economy, and advanced technological infrastructure relative to other less industrialized nations. Most commonly, the criteria for evaluating the degree of economic development are the gross domestic product (GDP), gross national product (GNP), the per capita income, level of industrialization, amount of widespread infrastructure and general standard of living. Which criteria are to be used and which countries can be classified as being developed are subjects of debate. Different definitions of developed countries are provided by the International Monetary Fund and the World Bank; moreover, HDI ranking is used to reflect the composite index of life expectancy, education, and income per capita. Another commonly used measure of a developed country is the threshold of GDP (PPP) per capita of at least USD$22,000. In 2023, 37 countries fit all four criteria, while an additional 16 countries fit three out of four.
This page compares the sovereign states of Europe on economic, financial and social indicators.
The economy of the European Union is the joint economy of the member states of the European Union (EU). It is the third largest economy in the world in nominal terms, after the United States and China, and the third one in purchasing power parity (PPP) terms, after China and the United States. The European Union's GDP estimated to be around $16.6 trillion (nominal) in 2022 representing around one sixth of the global economy. Germany has by far the biggest national GDP of all EU countries, followed by France and Italy.