
Actuarial science is the discipline that applies mathematical and statistical methods to assess risk in insurance, pension, finance, investment and other industries and professions.
Modern portfolio theory (MPT), or mean-variance analysis, is a mathematical framework for assembling a portfolio of assets such that the expected return is maximized for a given level of risk. It is a formalization and extension of diversification in investing, the idea that owning different kinds of financial assets is less risky than owning only one type. Its key insight is that an asset's risk and return should not be assessed by itself, but by how it contributes to a portfolio's overall risk and return. The variance of return is used as a measure of risk, because it is tractable when assets are combined into portfolios. Often, the historical variance and covariance of returns is used as a proxy for the forward-looking versions of these quantities, but other, more sophisticated methods are available.
Bond valuation is the process by which an investor arrives at an estimate of the theoretical fair value, or intrinsic worth, of a bond. As with any security or capital investment, the theoretical fair value of a bond is the present value of the stream of cash flows it is expected to generate. Hence, the value of a bond is obtained by discounting the bond's expected cash flows to the present using an appropriate discount rate.

A short-rate model, in the context of interest rate derivatives, is a mathematical model that describes the future evolution of interest rates by describing the future evolution of the short rate, usually written .
In financial mathematics, the Hull–White model is a model of future interest rates. In its most generic formulation, it belongs to the class of no-arbitrage models that are able to fit today's term structure of interest rates. It is relatively straightforward to translate the mathematical description of the evolution of future interest rates onto a tree or lattice and so interest rate derivatives such as bermudan swaptions can be valued in the model.
Monte Carlo methods are used in corporate finance and mathematical finance to value and analyze (complex) instruments, portfolios and investments by simulating the various sources of uncertainty affecting their value, and then determining the distribution of their value over the range of resultant outcomes. This is usually done by help of stochastic asset models. The advantage of Monte Carlo methods over other techniques increases as the dimensions of the problem increase.
Financial modeling is the task of building an abstract representation of a real world financial situation. This is a mathematical model designed to represent the performance of a financial asset or portfolio of a business, project, or any other investment.
In mathematical finance, the Black–Derman–Toy model (BDT) is a popular short-rate model used in the pricing of bond options, swaptions and other interest rate derivatives; see Lattice model (finance) § Interest rate derivatives. It is a one-factor model; that is, a single stochastic factor—the short rate—determines the future evolution of all interest rates. It was the first model to combine the mean-reverting behaviour of the short rate with the log-normal distribution, and is still widely used.
The following outline is provided as an overview of and topical guide to actuarial science:
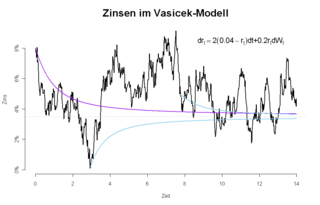
In finance, the Vasicek model is a mathematical model describing the evolution of interest rates. It is a type of one-factor short-rate model as it describes interest rate movements as driven by only one source of market risk. The model can be used in the valuation of interest rate derivatives, and has also been adapted for credit markets. It was introduced in 1977 by Oldřich Vašíček, and can be also seen as a stochastic investment model.
"Stochastic" means being or having a random variable. A stochastic model is a tool for estimating probability distributions of potential outcomes by allowing for random variation in one or more inputs over time. The random variation is usually based on fluctuations observed in historical data for a selected period using standard time-series techniques. Distributions of potential outcomes are derived from a large number of simulations which reflect the random variation in the input(s).
In statistics, stochastic volatility models are those in which the variance of a stochastic process is itself randomly distributed. They are used in the field of mathematical finance to evaluate derivative securities, such as options. The name derives from the models' treatment of the underlying security's volatility as a random process, governed by state variables such as the price level of the underlying security, the tendency of volatility to revert to some long-run mean value, and the variance of the volatility process itself, among others.
The following outline is provided as an overview of and topical guide to finance:
In finance, the Chen model is a mathematical model describing the evolution of interest rates. It is a type of "three-factor model" as it describes interest rate movements as driven by three sources of market risk. It was the first stochastic mean and stochastic volatility model and it was published in 1994 by Lin Chen, economist, theoretical physicist and former lecturer/professor at Beijing Institute of Technology, American University of Beirut, Yonsei University of Korea, and SunYetSan University.
The Rendleman–Bartter model in finance is a short-rate model describing the evolution of interest rates. It is a "one factor model" as it describes interest rate movements as driven by only one source of market risk. It can be used in the valuation of interest rate derivatives. It is a stochastic asset model.

In mathematical finance, the Cox–Ingersoll–Ross (CIR) model describes the evolution of interest rates. It is a type of "one factor model" as it describes interest rate movements as driven by only one source of market risk. The model can be used in the valuation of interest rate derivatives. It was introduced in 1985 by John C. Cox, Jonathan E. Ingersoll and Stephen A. Ross as an extension of the Vasicek model, itself an Ornstein–Uhlenbeck process.
A local volatility model, in mathematical finance and financial engineering, is an option pricing model that treats volatility as a function of both the current asset level and of time . As such, it is a generalisation of the Black–Scholes model, where the volatility is a constant. Local volatility models are often compared with stochastic volatility models, where the instantaneous volatility is not just a function of the asset level but depends also on a new "global" randomness coming from an additional random component.
Quantitative analysis is the use of mathematical and statistical methods in finance and investment management. Those working in the field are quantitative analysts (quants). Quants tend to specialize in specific areas which may include derivative structuring or pricing, risk management, investment management and other related finance occupations. The occupation is similar to those in industrial mathematics in other industries. The process usually consists of searching vast databases for patterns, such as correlations among liquid assets or price-movement patterns.
Financial correlations measure the relationship between the changes of two or more financial variables over time. For example, the prices of equity stocks and fixed interest bonds often move in opposite directions: when investors sell stocks, they often use the proceeds to buy bonds and vice versa. In this case, stock and bond prices are negatively correlated.
In mathematics, the Chan–Karolyi–Longstaff–Sanders process is a stochastic process with applications to finance. In particular it has been used to model the term structure of interest rates. The CKLS process can also be viewed as a generalization of the Ornstein–Uhlenbeck process. It is named after K. C. Chan, G. Andrew Karolyi, Francis A. Longstaff, and Anthony B. Sanders, with their paper published in 1992.


