Software testing is the act of examining the artifacts and the behavior of the software under test by validation and verification. Software testing can also provide an objective, independent view of the software to allow the business to appreciate and understand the risks of software implementation. Test techniques include, but are not necessarily limited to:
In computer science, program analysis is the process of automatically analyzing the behavior of computer programs regarding a property such as correctness, robustness, safety and liveness. Program analysis focuses on two major areas: program optimization and program correctness. The first focuses on improving the program’s performance while reducing the resource usage while the latter focuses on ensuring that the program does what it is supposed to do.
In computer science, self-modifying code is code that alters its own instructions while it is executing – usually to reduce the instruction path length and improve performance or simply to reduce otherwise repetitively similar code, thus simplifying maintenance. The term is usually only applied to code where the self-modification is intentional, not in situations where code accidentally modifies itself due to an error such as a buffer overflow.
A memory debugger is a debugger for finding software memory problems such as memory leaks and buffer overflows. These are due to bugs related to the allocation and deallocation of dynamic memory. Programs written in languages that have garbage collection, such as managed code, might also need memory debuggers, e.g. for memory leaks due to "living" references in collections.
PurifyPlus is a memory debugger program used by software developers to detect memory access errors in programs, especially those written in C or C++. It was originally written by Reed Hastings of Pure Software. Pure Software later merged with Atria Software to form Pure Atria Software, which in turn was later acquired by Rational Software, which in turn was acquired by IBM, and then divested to UNICOM Systems, Inc. on Dec 31, 2014. It is functionally similar to other memory debuggers, such as Insure++, Valgrind and BoundsChecker.
In programming and software development, fuzzing or fuzz testing is an automated software testing technique that involves providing invalid, unexpected, or random data as inputs to a computer program. The program is then monitored for exceptions such as crashes, failing built-in code assertions, or potential memory leaks. Typically, fuzzers are used to test programs that take structured inputs. This structure is specified, e.g., in a file format or protocol and distinguishes valid from invalid input. An effective fuzzer generates semi-valid inputs that are "valid enough" in that they are not directly rejected by the parser, but do create unexpected behaviors deeper in the program and are "invalid enough" to expose corner cases that have not been properly dealt with.
In software engineering, profiling is a form of dynamic program analysis that measures, for example, the space (memory) or time complexity of a program, the usage of particular instructions, or the frequency and duration of function calls. Most commonly, profiling information serves to aid program optimization, and more specifically, performance engineering.
An instruction set simulator (ISS) is a simulation model, usually coded in a high-level programming language, which mimics the behavior of a mainframe or microprocessor by "reading" instructions and maintaining internal variables which represent the processor's registers.
Runtime verification is a computing system analysis and execution approach based on extracting information from a running system and using it to detect and possibly react to observed behaviors satisfying or violating certain properties. Some very particular properties, such as datarace and deadlock freedom, are typically desired to be satisfied by all systems and may be best implemented algorithmically. Other properties can be more conveniently captured as formal specifications. Runtime verification specifications are typically expressed in trace predicate formalisms, such as finite state machines, regular expressions, context-free patterns, linear temporal logics, etc., or extensions of these. This allows for a less ad-hoc approach than normal testing. However, any mechanism for monitoring an executing system is considered runtime verification, including verifying against test oracles and reference implementations. When formal requirements specifications are provided, monitors are synthesized from them and infused within the system by means of instrumentation. Runtime verification can be used for many purposes, such as security or safety policy monitoring, debugging, testing, verification, validation, profiling, fault protection, behavior modification, etc. Runtime verification avoids the complexity of traditional formal verification techniques, such as model checking and theorem proving, by analyzing only one or a few execution traces and by working directly with the actual system, thus scaling up relatively well and giving more confidence in the results of the analysis, at the expense of less coverage. Moreover, through its reflective capabilities runtime verification can be made an integral part of the target system, monitoring and guiding its execution during deployment.
In computer science, fault injection is a testing technique for understanding how computing systems behave when stressed in unusual ways. This can be achieved using physical- or software-based means, or using a hybrid approach. Widely studied physical fault injections include the application of high voltages, extreme temperatures and electromagnetic pulses on electronic components, such as computer memory and central processing units. By exposing components to conditions beyond their intended operating limits, computing systems can be coerced into mis-executing instructions and corrupting critical data.
In the context of computer programming, instrumentation refers to the measure of a product's performance, in order to diagnose errors and to write trace information. Instrumentation can be of two types: source instrumentation and binary instrumentation.
Program animation or stepping refers to the debugging method of executing code one instruction or line at a time. The programmer may examine the state of the program, machine, and related data before and after execution of a particular line of code. This allows the programmer to evaluate the effects of each statement or instruction in isolation, and thereby gain insight into the behavior of the executing program. Nearly all modern IDEs and debuggers support this mode of execution.

Parasoft is an independent software vendor specializing in automated software testing and application security with headquarters in Monrovia, California. It was founded in 1987 by four graduates of the California Institute of Technology who planned to commercialize the parallel computing software tools they had been working on for the Caltech Cosmic Cube, which was the first working hypercube computer built.
Concolic testing is a hybrid software verification technique that performs symbolic execution, a classical technique that treats program variables as symbolic variables, along a concrete execution path. Symbolic execution is used in conjunction with an automated theorem prover or constraint solver based on constraint logic programming to generate new concrete inputs with the aim of maximizing code coverage. Its main focus is finding bugs in real-world software, rather than demonstrating program correctness.
High performance computing applications run on massively parallel supercomputers consist of concurrent programs designed using multi-threaded, multi-process models. The applications may consist of various constructs with varying degree of parallelism. Although high performance concurrent programs use similar design patterns, models and principles as that of sequential programs, unlike sequential programs, they typically demonstrate non-deterministic behavior. The probability of bugs increases with the number of interactions between the various parallel constructs. Race conditions, data races, deadlocks, missed signals and live lock are common error types.

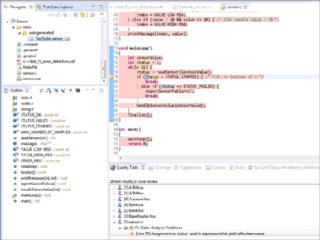
Parasoft C/C++test is an integrated set of tools for testing C and C++ source code that software developers use to analyze, test, find defects, and measure the quality and security of their applications. It supports software development practices that are part of development testing, including static code analysis, dynamic code analysis, unit test case generation and execution, code coverage analysis, regression testing, runtime error detection, requirements traceability, and code review. It's a commercial tool that supports operation on Linux, Windows, and Solaris platforms as well as support for on-target embedded testing and cross compilers.
Runtime error detection is a software verification method that analyzes a software application as it executes and reports defects that are detected during that execution. It can be applied during unit testing, component testing, integration testing, system testing, or penetration testing.

American Fuzzy Lop (AFL), stylized in all lowercase as american fuzzy lop, is a free software fuzzer that employs genetic algorithms in order to efficiently increase code coverage of the test cases. So far it has detected dozens of significant software bugs in major free software projects, including X.Org Server, PHP, OpenSSL, pngcrush, bash, Firefox, BIND, Qt, and SQLite.
Runtime predictive analysis is a runtime verification technique in computer science for detecting property violations in program executions inferred from an observed execution. An important class of predictive analysis methods has been developed for detecting concurrency errors in concurrent programs, where a runtime monitor is used to predict errors which did not happen in the observed run, but can happen in an alternative execution of the same program. The predictive capability comes from the fact that the analysis is performed on an abstract model extracted online from the observed execution, which admits a class of executions beyond the observed one.


