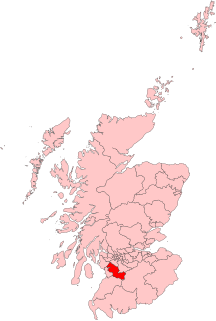
| |||||||||||||||||||||||||||||||||
All 32 seats to East Ayrshire Council 17 seats needed for a majority | |||||||||||||||||||||||||||||||||
---|---|---|---|---|---|---|---|---|---|---|---|---|---|---|---|---|---|---|---|---|---|---|---|---|---|---|---|---|---|---|---|---|---|
| |||||||||||||||||||||||||||||||||
The 9 multi-member wards | |||||||||||||||||||||||||||||||||
|
Elections to East Ayrshire Council are to be held on 3 May 2012, the same day as the other Scottish local government elections. The election is the second using 9 new wards created as a results of the Local Governance (Scotland) Act 2004, each ward elected three or four councillors using the single transferable vote system a form of proportional representation. The new wards replaced 32 single-member wards which used the plurality (first past the post) system of election.
The Local Governance (Scotland) Act 2004 is an Act of the Scottish Parliament which provided, amongst other things, for the election of councillors to the local authorities in Scotland by the single transferable vote system.
The single transferable vote (STV) is a voting system designed to achieve proportional representation through ranked voting in multi-seat organizations or constituencies. Under STV, an elector (voter) has a single vote that is initially allocated to their most preferred candidate. Votes are totalled and a quota derived. If their candidate achieves quota, he/she is elected and in some STV systems any surplus vote is transferred to other candidates in proportion to the voters' stated preferences. If more candidates than seats remain, the bottom candidate is eliminated with his/her votes being transferred to other candidates as determined by the voters' stated preferences. These elections and eliminations, and vote transfers if applicable, continue until there are only as many candidates as there are unfilled seats. The specific method of transferring votes varies in different systems.
Party | Seats | Gains | Losses | Net gain/loss | Seats % | Votes % | Votes | +/− | |
---|---|---|---|---|---|---|---|---|---|
SNP | 15 | 1 | 0 | +1 | 46.88 | 39.54 | 14,518 | +0.33 | |
Labour | 14 | 1 | 1 | ±0 | 43.75 | 41.37 | 15,190 | +0.25 | |
Conservative | 2 | 0 | 1 | -1 | 6.25 | 11.26 | 4,134 | -1.54 | |
Liberal Democrats | 0 | 0 | 0 | ±0 | 0.00 | 0.19 | 68 | N/A | |
Independent | 1 | 1 | 1 | ±0 | 3.13 | 7.64 | 2,2806 | +2.45 | |
Note: "Votes" are the first preference votes. The net gain/loss and percentage changes relate to the result of the previous Scottish local elections on 3 May 2007. This may differ from other published sources showing gain/loss relative to seats held at dissolution of Scotland's councils.
Seat | 2007 | 2012 | ||||
---|---|---|---|---|---|---|
Party | Member | Party | Member | |||
Annick | Conservative | Rose-Ann Cunninghame | Independent | Ellen Freel | ||
Ballochmyle | Labour | Jimmy Kelly | SNP | Stephanie Primrose | ||
Doon Valley | Independent | Jim Sutherland | Labour | Elaine Dinwoodie | ||
Ward | % | Cllrs | % | Cllrs | % | Cllrs | % | Cllrs | % | Cllrs | Total Cllrs |
---|---|---|---|---|---|---|---|---|---|---|---|
SNP | Labour | Conservative | Lib Dem | Independents | |||||||
Annick | 1 | 1 | 0 | 0 | 1 | 3 | |||||
Kilmarnock North | 2 | 1 | 0 | - | - | - | - | 3 | |||
Kilmarnock West and Crosshouse | 2 | 1 | 1 | - | - | 0 | 4 | ||||
Kilmarnock East and Hurlford | 2 | 2 | 0 | - | - | - | - | 4 | |||
Kilmarnock South | 2 | 1 | 0 | - | - | - | - | 3 | |||
Irvine Valley | 2 | 1 | 1 | - | - | 4 | |||||
Ballochmyle | 2 | 2 | 0 | - | - | - | - | 4 | |||
Cumnock and New Cumnock | 1 | 3 | 0 | - | - | 0 | 4 | ||||
Doon Valley | 1 | 2 | 0 | - | - | 0 | 3 | ||||
Total | 15 | 14 | 2 | 0 | 1 | 32 |
Annick (3 members) | |||||||||
---|---|---|---|---|---|---|---|---|---|
Party | Candidate | % 1st Pref | Count 1 | Count 2 | Count 3 | Count 4 | Count 5 | Count 6 | |
SNP | Eòghann MacColl | 22.66% | 947 | 957 | 1,327 | ||||
Labour | John McGhee (incumbent) | 24.43% | 1021 | 1,032 | 1,060 | ||||
Independent | Ellen Freel | 19.38% | 810 | 827 | 858 | 960 | 965 | 1,394 | |
Conservative | Rose-Ann Cunninghame (incumbent) | 20.89% | 873 | 886 | 907 | 941 | 943 | ||
SNP | John MacKay (incumbent) | 11.03% | 461 | 465 | |||||
Liberal Democrats | Greg Foster | 1.63% | 68 | ||||||
Electorate: Valid: 4,180 Spoilt: 57 (1.35%) Quota: 1,046 Turnout: 4,237(44.01%) |
2007: 2xSNP; 1xLab
2012: 2xSNP; 1xLab
Kilmarnock North (3 members) | ||||||
---|---|---|---|---|---|---|
Party | Candidate | % 1st Pref | Count 1 | Count 2 | Count 3 | |
SNP | Helen Coffey (incumbent) | 44.74% | 1,475 | |||
Labour | Maureen McKay (incumbent) | 35.67% | 1,176 | |||
SNP | Andrew Hershaw† | 7.98% | 263 | 817 | 921 | |
Conservative | Ian Grant | 11.62% | 383 | 417 | 476 | |
Electorate: Valid: 3,297 Spoilt: 40 (1.20%) Quota: 825 Turnout: 3,337 (35.36%) |
2007: 2xSNP, 1xLab, 1xCon
2012: 2xSNP; 1xLab; 1xCon
Kilmarnock West and Crosshouse (4 members) | |||||||||
---|---|---|---|---|---|---|---|---|---|
Party | Candidate | % 1st Pref | Count 1 | Count 2 | Count 3 | Count 4 | Count 5 | Count 6 | |
SNP | Iain Linton (incumbent) | 24.27% | 1,210 | ||||||
SNP | Douglas Reid (incumbent) | 20.70% | 1,032 | ||||||
Labour | Lillian Jones | 20.56% | 1,025 | ||||||
Conservative | Tom Cook (incumbent) | 16.61% | 828 | 864 | 869 | 870 | 980 | 1,171 | |
Labour | Dave Meechan | 10.35% | 516 | 554 | 559 | 582 | 709 | ||
Independent | Andi McCann | 7.52% | 375 | 417 | 423 | 424 | |||
Electorate: Valid: 4,986 Spoilt: 136 (2.66%) Quota: 998 Turnout: 5,122(40.87%) |
2007: 2xSNP; 2xLab
2012: 2xSNP; 2xLab
Kilmarnock East and Hurlford (4 members) | ||||
---|---|---|---|---|
Party | Candidate | % 1st Pref | Count 1 | |
SNP | John Campbell (incumbent) | 25.39 | 1,126 | |
Labour | Gordon Cree (incumbent) | 23.77 | 1,054 | |
Labour | Drew McIntyre (incumbent) | 22.19 | 984 | |
SNP | James Buchanan (incumbent)††† | 21.29 | 944 | |
Conservative | Rob Murray | 7.35 | 326 | |
Electorate: Valid: 4,434 Spoilt: 142 (3.10%) Quota: 887 Turnout: 4,576 (39.2%) |
Kilmarnock South (3 members) | |||||||
---|---|---|---|---|---|---|---|
Party | Candidate | % 1st Pref | Count 1 | Count 2 | Count 3 | Count 4 | |
Labour | John Knapp (incumbent) | 37.56 | 1,250 | ||||
SNP | Jim Todd (incumbent) | 23.76 | 791 | 814.4 | 822.7 | 949.7 | |
SNP | Hugh Ross (incumbent) | 22.08 | 735 | 759.4 | 789.4 | 924.4 | |
Labour | Ronnie Scott | 12.53 | 417 | 743.9 | 785.9 | ||
Conservative | Alyson Holden | 4.06 | 135 | 138.7 | |||
Electorate: Valid: 3,328 Spoilt: 93 (%) Quota: 833 Turnout: 3,421 (%) |
Irvine Valley (4 members) | ||||||||
---|---|---|---|---|---|---|---|---|
Party | Candidate | % 1st Pref | Count 1 | Count 2 | Count 3 | Count 4 | Count 5 | |
Labour | George Mair | 29.71 | 1,423 | |||||
SNP | Alan Brown (incumbent)†† | 26.14 | 1,252 | |||||
Conservative | John McFadzean | 17.89 | 857 | 896 | 940.3 | 942.9 | 1,188.3 | |
SNP | Bobby McDill (incumbent) | 17.68 | 847 | 961.1 | ||||
Independent | May Anderson | 7.08 | 339 | 451.4 | 541.9 | 547.1 | ||
Electorate: Valid: 4,718 Spoilt: 72 (%) Quota: 944 Turnout: 4,790 (%) |
Ballochmyle (4 members) | |||||||||
---|---|---|---|---|---|---|---|---|---|
Party | Candidate | % 1st Pref | Count 1 | Count 2 | Count 3 | Count 4 | Count 5 | Count 6 | |
SNP | Jim Roberts (incumbent) | 25.35 | 1,109 | ||||||
Labour | Neil McGhee (incumbent) | 23.27 | 1,018 | ||||||
Labour | David Shaw (incumbent) | 18.52 | 810 | 827.8 | 857 | ||||
Labour | Neil Murray | 11.34 | 496 | 510.1 | 622.3 | 628.4 | 704.7 | ||
SNP | Stephanie Primrose | 10.56 | 462 | 665.7 | 670.5 | 671 | 735.6 | 869.7 | |
Conservative | Nick Martin | 7.96 | 348 | 352.5 | 353.8 | 354 | |||
Electorate: Valid: 4,243 Spoilt: 131 (%) Quota: 849 Turnout: 4,374 (%) |
Cumnock and New Cumnock (4 members) | |||||||||||
---|---|---|---|---|---|---|---|---|---|---|---|
Party | Candidate | % 1st Pref | Count 1 | Count 2 | Count 3 | Count 4 | Count 5 | Count 6 | Count 7 | Count 8 | |
Labour | Eric Ross (incumbent) | 23.82 | 987 | ||||||||
SNP | Kathy Morrice (incumbent) | 21.57 | 894 | ||||||||
Labour | Barney Menzies (incumbent) | 19.52 | 809 | 892.9 | |||||||
Labour | Billy Crawford (incumbent) | 14.77 | 612 | 672.6 | 677.3 | 741.3 | 744.2 | 763 | 800 | 945.5 | |
Independent | Ian Allan | 7.43 | 308 | 310.3 | 311.3 | 314.5 | 352.9 | 409.6 | 475.9 | ||
Conservative | James Boswell | 4.97 | 206 | 208.8 | 209.9 | 210.9 | 215.2 | ||||
SNP | Craig Murray | 4.34 | 180 | 185.7 | 253.1 | 255.9 | 258.1 | 286.6 | |||
Independent | David Fraser | 1.42 | 59 | 62 | 63.3 | 64.8 | |||||
Electorate: Valid: 4,055 Spoilt: 89 (%) Quota: 812 Turnout: 4,144 (%) |
Doon Valley (3 members) | |||||||||
---|---|---|---|---|---|---|---|---|---|
Party | Candidate | % 1st Pref | Count 1 | Count 2 | Count 3 | Count 4 | Count 5 | Count 6 | |
Labour | Elaine Dinwoodie (incumbent) | 33.12 | 1,171 | ||||||
SNP | John Bell | 22.34 | 790 | 812.4 | 832.9 | 950.9 | |||
Independent | Ian Borthwick | 13.80 | 488 | 501.7 | 540.9 | 680 | 708 | ||
Independent | Drew Filson (incumbent) | 12.08 | 427 | 465.4 | 491.2 | ||||
Labour | Moira Pirie (incumbent) | 11.91 | 421 | 590.4 | 613.9 | 719 | 734.6 | 984.9 | |
Conservative | Irene Grant | 5.03 | 178 | 181.9 | |||||
Electorate: Valid: 3,475 Spoilt: 61 (%) Quota: 869 Turnout: 3,536 (%) |
Kilmarnock and Loudoun is a county constituency of the House of Commons of the Parliament of the United Kingdom. It elects one Member of Parliament (MP), using the first-past-the-post voting system.
Kilmarnock North By-election (27 March 2014) - 1 Seat [1] | |||||||
---|---|---|---|---|---|---|---|
Party | Candidate | % 1st Pref | Count 1 | Count 2 | Count 3 | Count 4 | |
SNP | Elaine Cowan | 44.2 | 1,334 | 1,358 | 1,473 | 2,042 | |
Labour | Scott Thomson | 37.4 | 1,130 | 1,147 | 1,320 | ||
Conservative | Ian Grant | 16.3 | 493 | 501 | |||
Scottish Green | Robin Tatler | 2.0 | 61 | ||||
Irvine Valley By-election (1 October 2015) - 1 Seat [2] | |||||
---|---|---|---|---|---|
Party | Candidate | % 1st Pref | Count 1 | Count 2 | |
SNP | Elena Whitham | 49.8% | 1,797 | 1,832 | |
Conservative | Susan McFadzean | 24.5% | 865 | 884 | |
Labour | Alex Walsh | 23.8% | 860 | 884 | |
Scottish Green | Jen Broadhurst | 2.4% | 88 | ||
Electorate: 11,570 Valid: 3,610 Quota: 1,805 Turnout: 31.2% |
Kilmarnock East and Hurlford By-election (26 January 2017) - 1 Seat [3] | ||||
---|---|---|---|---|
Party | Candidate | % 1st Pref | Count 1 | |
SNP | Fiona Campbell | 48.7 | 1,461 | |
Labour | Dave Meechem | 29.4 | 881 | |
Conservative | Jon Herd | 20.1 | 602 | |
Libertarian | Stephen McNamara | 1.8 | 53 | |
Elections to Angus Council were held on 3 May 2012 the same day as the other Scottish local government elections. The election used the eight wards, created as a result of the Local Governance (Scotland) Act 2004, with each ward electing three or four Councillors using the single transferable vote system a form of proportional representation, with 29 Councillors being elected.
Elections to Dundee City Council were held on 3 May 2012 on the same day as the other Scottish local government elections. The election used the eight wards created as a result of the Local Governance (Scotland) Act 2004, with each ward electing three or four Councillors using the single transferable vote system a form of proportional representation, with 29 Councillors elected.
Elections to Aberdeenshire Council were held on 3 May 2012, on the same day as the other Scottish local government elections. The election used the 19 wards created as a result of the Local Governance (Scotland) Act 2004, with each ward electing three or four Councillors using the single transferable vote system a form of proportional representation, with 68 Councillors being elected.
The 2012 Aberdeen City Council election took place on 3 May 2012 to elect members of Aberdeen City Council. The election used the 13 wards created as a result of the Local Governance (Scotland) Act 2004, with each ward electing three or four Councillors using the single transferable vote system a form of proportional representation, with 43 Councillors elected.
Elections to the Moray Council were held on 3 May 2012, the same day as the other 31 local authorities in Scotland. The election used the eight wards created under the Local Governance (Scotland) Act 2004, with 26 councillors being elected. Each ward elected either 3 or 4 members, using the STV electoral system.
Elections to the City of Edinburgh Council were held on 3 May 2012, the same day as the Scottish local elections, 2012. The election was the second using 17 new wards created as a results of the Local Governance (Scotland) Act 2004, each ward elected three or four Councillors using the single transferable vote system a form of proportional representation system of election.
Elections to Clackmannanshire Council were held on 3 May 2012, the same day as the 31 other local authorities in Scotland. The election used the five wards created under the Local Governance (Scotland) Act 2004, with 18 Councillors being elected. Each ward elected either 3 or 4 members, using the STV electoral system.
Elections to Falkirk Council were held on 3 May 2012, the same day as the 31 other local authorities in Scotland. The election used the nine wards created under the Local Governance (Scotland) Act 2004, with 32 councillors being elected. Each ward elected either 3 or 4 members, using the STV electoral system.
The 2012 West Lothian Council election took place on 3 May 2012 to elect members of West Lothian Council. The election will use the 9 wards created as a result of the Local Governance (Scotland) Act 2004, with each ward electing three or four Councillors using the single transferable vote system a form of proportional representation, with 33 Councillors being elected. The Bathgate Ward gained an additional seat for the 2012 elections. JAMAL The election saw Labour remain the largest party on the Council as they gained 2 seats. The Scottish National Party also made 2 net gains and significantly increased their vote share, outpolling Labour in terms of votes cast. The Scottish Conservative and Unionist Party retained their single seat on the Council and so to did the Independents. The Action to Save St. John's Hospital group were completely wiped out from the authority losing all of their 3 seats.
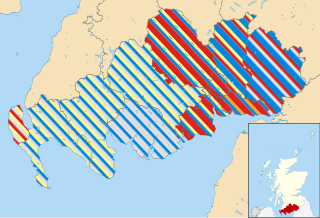
The 2012 Dumfries and Galloway Council election took place on 3 May 2012 to elect members of Dumfries and Galloway Council. The election used the thirteen wards created as a result of the Local Governance (Scotland) Act 2004, with each ward electing three or four councillors using the single transferable vote system a form of proportional representation, with 47 councillors being elected.
The 2012 South Ayrshire Council election took place on 3 May 2012 to elect members of South Ayrshire Council. The election used the eight wards created as a result of the Local Governance (Scotland) Act 2004, with each ward electing three or four Councillors using the single transferable vote system a form of proportional representation, with 30 Councillors being elected.
The 2012 North Ayrshire Council election took place on 3 May 2012 to elect members of North Ayrshire Council. The election used the eight wards created as a result of the Local Governance (Scotland) Act 2004, with each ward electing three or four Councillors using the single transferable vote system a form of proportional representation, with 30 Councillors being elected.
Elections to South Lanarkshire Council were held on 3 May 2012 on the same day as the 31 other local authorities in Scotland. The election used the twenty wards created under the Local Governance (Scotland) Act 2004, with 67 Councillors being elected. Each ward elected either 3 or 4 members, using the STV electoral system.
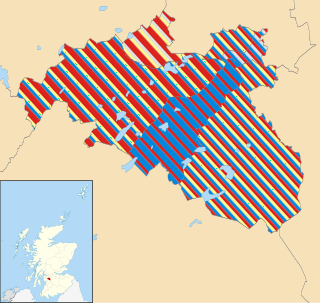
Elections to North Lanarkshire Council were held on 3 May 2012 on the same day as the 31 other local authorities in Scotland. The election used the twenty wards created under the Local Governance (Scotland) Act 2004, with 70 Councillors being elected. Each ward elected either 3 or 4 members, using the STV electoral system.
The 2012 East Renfrewshire Council election took place on 3 May 2012 to elect members of East Renfrewshire Council. The election used the six wards created as a result of the Local Governance (Scotland) Act 2004, with each ward electing three or four Councillors using the single transferable vote system a form of proportional representation, with 20 Councillors being elected.
Elections to East Dunbartonshire Council were held on 3 May 2012, the same day as the 31 other local authorities in Scotland. The election used the eight wards created under the Local Governance (Scotland) Act 2004, with 24 Councillors being elected. Each ward elected either 3 or 4 members, using the STV electoral system.
The Clackmannanshire Council election of 2017 was held on 4 May 2017, on the same day as the 31 other local authorities in Scotland. It was the third successive election to run under the STV electoral system and used the five wards created under the Local Governance (Scotland) Act 2004, with 18 councillors being elected.
The 2017 Midlothian Council election will take place on 4 May 2017 to elect members of Midlothian Council. The election used the six wards created as a result of the Local Governance (Scotland) Act 2004, with each ward electing three Councillors using the single transferable vote system a form of proportional representation, with 18 Councillors being elected.
Elections to Falkirk Council will be held on 4 May 2017, the same day as the 31 other local authorities in Scotland. The election will use the nine wards created under the Local Governance (Scotland) Act 2004, with 30 councillors being elected, a reduction of 2 members from 2012. Each ward will elect either 3 or 4 members, using the STV electoral system.
The 2017 North Ayrshire Council election took place on 4 May 2017 to elect members of North Ayrshire Council. The election used the ten wards created as a result of the 2015–16 boundary review, with each ward electing three or four Councillors using the single transferable vote system a form of proportional representation, with 33 Councillors being elected.