Ed Hawkins (climatologist)

Last updated

Ed Hawkins

MBE
20151202 Ed Hawkins (scientist) at COP21 Paris.png
Ed Hawkins speaking at the 2015 United Nations Climate Change Conference in Paris
Born
Edward Hawkins

February 1977 (age 46) [1]
NationalityBritish
Alma mater University of Nottingham (PhD)
Known for Warming stripes
Climate spirals
Awards Kavli Medal (2018)
MBE (2019)
Scientific career
Fields Climate variability
Climate predictability
Climate change
Arctic
Astrophysics
Data and information visualization [2]
Institutions University of Reading
National Centre for Atmospheric Science
Thesis Galaxy clustering in large redshift surveys  (2003)
Doctoral advisor Steve Maddox [3]
Website www.met.reading.ac.uk/~ed OOjs UI icon edit-ltr-progressive.svg

Edward Hawkins MBE [4] (born 1977) [1] is a British climate scientist who is Professor of climate science at the University of Reading, [2] principal research scientist at the National Centre for Atmospheric Science (NCAS), editor of Climate Lab Book blog [5] and lead scientist for the Weather Rescue citizen science project. [6] [7] He is known for his data visualizations of climate change for the general public such as warming stripes [8] and climate spirals. [9] [10] [11]

Contents

Education

Hawkins was educated at the University of Nottingham where he was awarded a PhD in astrophysics in 2003 for research supervised by Steve Maddox that investigated galaxy clustering in large redshift surveys. [3]

Career and research

After his PhD, Hawkins served as a Natural Environment Research Council (NERC) advanced research fellow in the department of meteorology at the University of Reading from 2005 to 2013. [12]

20181204 Warming stripes (global, WMO, 1850-2018) - Climate Lab Book (Ed Hawkins).png
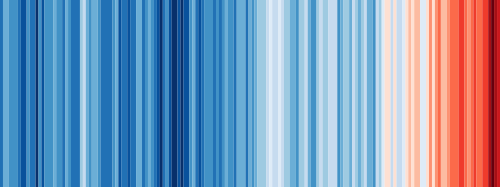
One of Hawkins' early warming stripes graphics shows global warming from 1850 (left side of graphic) to 2018 (right side of graphic). [13] Being a "minimalist graphic stripped (of) unnecessary clutter", [14] warming stripes portray observed global warming with blue stripes (cooler years) progressing to predominantly red stripes (warmer years).
5 9 16 Andrea TempSpiralEdHawkins.gif
Climate spiral shows global warming since 1850 as an ever-widening coloured spiral

As of 2023 Hawkins is a professor of climate science at the University of Reading, [15] where he serves as academic lead for public engagement and is affiliated with the National Centre for Atmospheric Science (NCAS). [16] He is a lead for Weather Rescue and Rainfall Rescue, citizen science projects in which volunteers transcribe data from historical meteorological and rainfall records for digital analysis. [17] [18]

Hawkins was a contributing author for the IPCC Fifth Assessment Report (2014) [19] and was a lead author for the IPCC Sixth Assessment Report in 2021. [20]

On 9 May 2016, Hawkins published his climate spiral data visualization graphic, [21] which was widely reported as having gone viral. [11] [22] [23] The climate spiral was widely praised, Jason Samenow writing in The Washington Post that the spiral graph was "the most compelling global warming visualization ever made". [24]

On 22 May 2018, Hawkins published his warming stripes data visualization graphic, [25] which has been used by meteorologists in Climate Central's annual #MetsUnite campaign to raise public awareness of global warming during broadcasts on the summer solstice. [26] Hawkins' similar #ShowYourStripes initiative, in which the public could freely download and share graphics customized to specific countries or localities, was launched on 17 June 2019. [26] The warming stripes graphic is used in the logo of the U.S. House Select Committee on the Climate Crisis from 2019 onwards. [27]

Honours and awards

Hawkins' climate spiral design was on the shortlist for the Kantar Information is Beautiful Awards 2016, [28] the design having been featured in the opening ceremony of the August 2016 Summer Olympics in Rio de Janeiro. [29]

Hawkins was awarded the Royal Meteorological Society’s Climate Science Communication Prize in 2017. [20]

In 2018, Hawkins was awarded the Kavli Medal by the Royal Society "for significant contributions to understanding and quantifying natural climate variability and long-term climate change, and for actively communicating climate science and its various implications with broad audiences". [20]

In July 2019, Hawkins was included in the Climate Home News list of ten climate influencers. [30]

Hawkins was appointed Member of the Order of the British Empire (MBE) in the 2020 New Year Honours "For services to Climate Science and to Science Communication". [4]

In June 2021, Hawkins was named in The Sunday Times "Green Power List" which profiled twenty environmentalists in the UK who are "minds engaging with the world’s biggest problem". [31]

Selected publications

According to Google Scholar [2] [32] [33] his most highly cited publications include:

Related Research Articles

<span class="mw-page-title-main">Attribution of recent climate change</span> Effort to scientifically ascertain mechanisms responsible for recent global warming

Efforts to scientifically ascertain and attribute mechanisms responsible for recent global warming and related climate changes on Earth have found that the main driver is elevated levels of greenhouse gases produced by human activities, with natural forces adding variability. The likely range of human-induced surface-level air warming by 2010–2019 compared to levels in 1850–1900 is 0.8 °C to 1.3 °C, with a best estimate of 1.07 °C. This is close to the observed overall warming during that time of 0.9 °C to 1.2 °C, while temperature changes during that time were likely only ±0.1 °C due to natural forcings and ±0.2 °C due to variability in the climate.

<span class="mw-page-title-main">Benjamin D. Santer</span> American climate researcher

Benjamin David Santer is a climate researcher at Lawrence Livermore National Laboratory and former researcher at the University of East Anglia's Climatic Research Unit. He also worked at the Max Planck Institute for Meteorology from 1987 to 1992. He specializes mainly in statistical analysis of climate data sets, and detection/attribution of climate change forcings.

<span class="mw-page-title-main">Climate</span> Statistics of weather conditions in a given region over long periods

Climate is the long-term weather pattern in a region, typically averaged over 30 years. More rigorously, it is the mean and variability of meteorological variables over a time spanning from months to millions of years. Some of the meteorological variables that are commonly measured are temperature, humidity, atmospheric pressure, wind, and precipitation. In a broader sense, climate is the state of the components of the climate system, including the atmosphere, hydrosphere, cryosphere, lithosphere and biosphere and the interactions between them. The climate of a location is affected by its latitude, longitude, terrain, altitude, land use and nearby water bodies and their currents.

<span class="mw-page-title-main">Global warming controversy</span> Political debate over global warming

The global warming controversy concerns the public debate over whether global warming is occurring, how much has occurred in modern times, what has caused it, what its effects will be, whether any action can or should be taken to curb it, and if so what that action should be. In the scientific literature, there is a very strong consensus that global surface temperatures have increased in recent decades and that the trend is caused by human-induced emissions of greenhouse gases. No scientific body of national or international standing disagrees with this view, though a few organizations with members in extractive industries hold non-committal positions, and some have tried to persuade the public that climate change is not happening, or if the climate is changing it is not because of human influence, attempting to sow doubt in the scientific consensus.

<span class="mw-page-title-main">Instrumental temperature record</span> In situ measurements that provide the temperature of Earths climate system

The instrumental temperature record is a record of temperatures within Earth's climate based on direct, instrument-based measurements of air temperature and ocean temperature. Instrumental temperature records are distinguished from indirect reconstructions using climate proxy data such as from tree rings and ocean sediments. Instrument-based data are collected from thousands of meteorological stations, buoys and ships around the globe. Whilst many heavily-populated areas have a high density of measurements, observations are more widely spread in sparsely populated areas such as polar regions and deserts, as well as over many parts of Africa and South America. Measurements were historically made using mercury or alcohol thermometers which were read manually, but are increasingly made using electronic sensors which transmit data automatically. Records of global average surface temperature are usually presented as anomalies rather than as absolute temperatures. A temperature anomaly is measured against a reference value. For example, a commonly used baseline period is the time period 1951-1980.

<span class="mw-page-title-main">Temperature record of the last 2,000 years</span> Temperature trends in the Common Era

The temperature record of the last 2,000 years is reconstructed using data from climate proxy records in conjunction with the modern instrumental temperature record which only covers the last 170 years at a global scale. Large-scale reconstructions covering part or all of the 1st millennium and 2nd millennium have shown that recent temperatures are exceptional: the Intergovernmental Panel on Climate Change Fourth Assessment Report of 2007 concluded that "Average Northern Hemisphere temperatures during the second half of the 20th century were very likely higher than during any other 50-year period in the last 500 years and likely the highest in at least the past 1,300 years." The curve shown in graphs of these reconstructions is widely known as the hockey stick graph because of the sharp increase in temperatures during the last century. As of 2010 this broad pattern was supported by more than two dozen reconstructions, using various statistical methods and combinations of proxy records, with variations in how flat the pre-20th-century "shaft" appears. Sparseness of proxy records results in considerable uncertainty for earlier periods.

<span class="mw-page-title-main">Scientific consensus on climate change</span> Evaluation of climate change by the scientific community

There is a strong scientific consensus that the Earth is warming and that this warming is mainly caused by human activities. This consensus is supported by various studies of scientists' opinions and by position statements of scientific organizations, many of which explicitly agree with the Intergovernmental Panel on Climate Change (IPCC) synthesis reports.

Thomas R. Karl is the former director of the National Oceanic and Atmospheric Administration’s National Centers for Environmental Information (NCEI). He joined the National Climate Centre in 1980, and when that became the National Climatic Data Center, he continued as a researcher, becoming a Lab Chief, Senior Scientist and ultimately Director of the Center. When it merged with other centers to become NCEI in 2015, he became its first director. He retired on 4 August 2016.

<span class="mw-page-title-main">John Houghton (physicist)</span> Welsh physicist (1931–2020)

Sir John Theodore Houghton was a Welsh atmospheric physicist who was the co-chair of the Intergovernmental Panel on Climate Change's (IPCC) scientific assessment working group which shared the Nobel Peace Prize in 2007 with Al Gore. He was the lead editor of first three IPCC reports. He was professor in atmospheric physics at the University of Oxford, former Director General at the Met Office and founder of the Hadley Centre.

<span class="mw-page-title-main">IPCC Third Assessment Report</span> Assessment of available scientific and socio-economic information on climate change by the IPCC

The IPCC Third Assessment Report (TAR), Climate Change 2001, is an assessment of available scientific and socio-economic information on climate change by the IPCC. Statements of the IPCC or information from the TAR were often used as a reference showing a scientific consensus on the subject of global warming. The Third Assessment Report (TAR) was completed in 2001 and consists of four reports, three of them from its Working Groups: Working Group I: The Scientific Basis; Working Group II: Impacts, Adaptation and Vulnerability; Working Group III: Mitigation; Synthesis Report. A number of the TAR's conclusions are given quantitative estimates of how probable it is that they are correct, e.g., greater than 66% probability of being correct. These are "Bayesian" probabilities, which are based on an expert assessment of all the available evidence.

<span class="mw-page-title-main">Jonathan M. Gregory</span>

Jonathan Michael Gregory is a climate modeller working on mechanisms of global and large-scale change in climate and sea level on multidecadal and longer timescales at the Met Office and the University of Reading.

<span class="mw-page-title-main">Effects of climate change</span>

Climate change affects the physical environment, ecosystems and human societies. Changes in the climate system include an overall warming trend, more extreme weather and rising sea levels. These in turn impact nature and wildlife, as well as human settlements and societies. The effects of human-caused climate change are broad and far-reaching. This is especially so if there is no significant climate action. Experts sometimes describe the projected and observed negative impacts of climate change as the climate crisis.

Climate change conspiracy theories assert that the scientific consensus on global warming is based on conspiracies to produce manipulated data or suppress dissent. It is one of a number of tactics used in climate change denial to attempt to manufacture political and public controversy disputing this consensus. Conspiracy theorists typically allege that, through worldwide acts of professional and criminal misconduct, the science behind global warming and climate change has been invented or distorted for ideological or financial reasons.

Piers Forster is a Professor of Physical Climate Change and Director of the Priestley International Centre for Climate at the University of Leeds. A physicist by training, his research focuses on quantifying the different human causes of climate change and the way the Earth responds. He is best known for his work on radiative forcing, climate sensitivity, contrails and Climate engineering. He has contributed heavily to the writing of Intergovernmental Panel on Climate Change (IPCC) reports, including acting as a Lead Author for the Fourth and Fifth Assessment Reports, and a Co-ordinating Lead Author for the Sixth Report. He also acted as a Lead Author of the IPCC 2018 Special Report on Global Warming of 1.5 °C.

Richard Arthur Betts is Head of the Climate Impacts strategic area at the Met Office Hadley Centre in Exeter, United Kingdom. He is also chair in Climate Impacts at the University of Exeter and the Principal Investigator of the EU FP7 project HELIX. He was a lead author for Working Group I and a contributing author for Working Group II of the IPCC Fourth Assessment Report. He was a lead author for Working Group II of the IPCC Fifth Assessment Report. He is an editor for the International Journal of Global Warming, the Journal of Environmental Investing, and for Earth System Dynamics. He was appointed MBE in the 2019 Birthday Honours.

<span class="mw-page-title-main">The Tempestry Project</span> Arts project promoting climate change awareness

The Tempestry Project is a collaborative fiber arts project that presents global warming data in visual form through knitted or crocheted artwork. The project is part of a larger "data art" movement and the developing field of climate change art, which seeks to exploit the human tendency to value personal experience over data by creating accessible experiential representations of the data.

Climate change art is art inspired by climate change and global warming, generally intended to overcome humans' hardwired tendency to value personal experience over data and to disengage from data-based representations by making the data "vivid and accessible". One of the goal of climate change art is to "raise awareness of the crisis", as well as engage viewers politically and environmentally.

<span class="mw-page-title-main">Warming stripes</span> Data visualization graphics of long-term trends of annual temperature anomalies

Warming stripes are data visualization graphics that use a series of coloured stripes chronologically ordered to visually portray long-term temperature trends. Warming stripes reflect a "minimalist" style, conceived to use colour alone to avoid technical distractions to intuitively convey global warming trends to non-scientists.

<span class="mw-page-title-main">Climate spiral</span> Data visualization graphics of long-term trends of annual temperature anomalies

A climate spiral is an animated data visualization graphic designed as a "simple and effective demonstration of the progression of global warming", especially for general audiences.

Antje Weisheimer is a German climate scientist researching at the University of Oxford, UK, and the European Centre for Medium-Range Weather Forecasts, Reading, UK.

References

  1. 1 2 Anon (2013). "Dr Edward Hawkins". gov.uk. London: Companies House. Archived from the original on 30 January 2023.
  2. 1 2 3 Ed Hawkins publications indexed by Google Scholar OOjs UI icon edit-ltr-progressive.svg
  3. 1 2 Hawkins, Ed (2003). Galaxy clustering in large redshift surveys. nottingham.ac.uk (PhD thesis). University of Nottingham. OCLC   1365479150. EThOS   uk.bl.ethos.272578.
  4. 1 2 "No. 62866". The London Gazette (Supplement). 28 December 2019. p. N18. Archived from the original on 28 December 2019.
  5. Hawkins, Ed (2022). "Climate Lab Book: Open Climate Science". climate-lab-book.ac.uk.
  6. Andrew M. Lorrey; Petra R. Pearce; Rob Allan; et al. (June 2022). "Meteorological data rescue: Citizen science lessons learned from Southern Weather Discovery". Patterns. 3 (6): 100495. doi:10.1016/J.PATTER.2022.100495. ISSN   2666-3899. Wikidata   Q114305499.
  7. Ed Hawkins; Rowan Sutton (11 April 2010). "The potential to narrow uncertainty in projections of regional precipitation change". Climate Dynamics . 37 (1–2): 407–418. doi:10.1007/S00382-010-0810-6. ISSN   0930-7575. Wikidata   Q58388456.
  8. Anon (2023). "'Manchester is red', climate data shows before FA Cup tie". reading.ac.uk. University of Reading. Archived from the original on 28 January 2023.
  9. Harvey, Chelsea (28 July 2016). "Scientists have found a perfect illustration of how the climate is spiraling 'out of control'". The Washington Post . Archived from the original on 11 July 2019.
  10. Kahn, Brian (25 May 2018). "This Climate Visualization Belongs in a Damn Museum". Gizmodo . Archived from the original on 19 June 2019.
  11. 1 2 Staff, Science AF (25 May 2018). "This Has Got to Be One of The Most Beautiful And Powerful Climate Change Visuals We've Ever Seen". Science Alert. Archived from the original on 28 June 2019.
  12. "Ed Hawkins". Archived from the original on 27 August 2019.
  13. Hawkins, Ed (4 December 2018). "2018 visualisation update / Warming stripes for 1850-2018 using the WMO annual global temperature dataset". Climate Lab Book. Archived from the original on 17 April 2019. (Direct link to image).
  14. Kahn, Brian (17 June 2019). "This Striking Climate Change Visualization Is Now Customizable for Any Place on Earth". Gizmodo . Archived from the original on 26 June 2019.
  15. "Professor Ed Hawkins". University of Reading. Archived from the original on 5 August 2019. Retrieved 26 August 2019.
  16. "Professor Ed Hawkins, Professor, NCAS Climate". University of Reading. Archived from the original on 26 August 2019.
  17. Johnson, Scott K. (22 March 2019). "You can help "rescue" weather data from the 1860s". Ars Technica . Archived from the original on 9 May 2019. (re Weather Rescue)
  18. Harvey, Fiona (26 March 2020). "Call for isolated Britons to help digitise historical rainfall data". The Guardian . Archived from the original on 17 April 2020. (Re Rainfall Rescue)
  19. "WG1AR5_TS_FINAL / TS Technical Summary / Contributing Authors" (PDF). Intergovernmental Panel on Climate Change (IPCC). Archived (PDF) from the original on 3 August 2019. Retrieved 26 August 2019.
  20. 1 2 3 "Our changing climate: learning from the past to inform future choices / Prize lecture". London: Royal Society. 30 April 2019. Archived from the original on 14 May 2019. Hawkins described his spiral graph and warming stripes in his Kavli prize lecture (video embedded in reference).
  21. Hawkins, Ed (9 May 2016). "Spiralling global temperatures". Climate Lab Book. Archived from the original on 16 August 2019.
  22. Mooney, Chris (11 May 2019). "This scientist just changed how we think about climate change with one GIF". The Washington Post . Archived from the original on 6 February 2019.
  23. Meduna, Veronika (17 September 2018). "The climate visualisations that leave no room for doubt or denial". The Spinoff. New Zealand. Archived from the original on 17 May 2019.
  24. Samenow, Jason (10 May 2016). "Unraveling spiral: The most compelling global warming visualization ever made". The Washington Post . Archived from the original on 22 February 2019.
  25. Hawkins, Ed (22 May 2018). "Warming stripes". Climate Lab Book. UK. Archived from the original on 26 May 2018.
  26. 1 2 Macdonald, Ted (25 June 2019). "TV meteorologists kicked off the summer by talking about climate change / #MetsUnite and #ShowYourStripes campaign highlighted the importance of climate communication". Media Matters . Archived from the original on 26 June 2019.
  27. "United States House Select Committee on the Climate Crisis / About". climatecrisis.house.gov. United States House of Representatives. 2019. Archived from the original on 2 April 2019. Crediting Shawna Faison and House Creative Services.
  28. "Climate spirals". informationisbeautifulawards.com. KANTAR Information is Beautiful. October 2016. Archived from the original on 23 August 2019.
  29. Irfan, Umair (30 May 2019). "Why this climate change data is on flip-flops, leggings, and cars / Warming stripes keep showing up on clothes and crafts". Vox. Archived from the original on 24 June 2019.
  30. Sauer, Natalie (16 July 2019). "Non-Green MEPs largely ignore climate on Twitter". Climate Home News (climatechangenews.com). Archived from the original on 31 August 2019.
  31. Spencer, Ben (14 June 2021). "The Carbon Brief: Daily Briefing / Green power list 2021: the UK's top 20 environmentalists". The Sunday Times . Archived from the original on 22 June 2021.
  32. Ed Hawkins publications from Europe PubMed Central
  33. Ed Hawkins publications indexed by the Scopus bibliographic database. (subscription required)
  34. Ed Hawkins; Rowan Sutton (August 2009). "The Potential to Narrow Uncertainty in Regional Climate Predictions". Bulletin of the American Meteorological Society . 90 (8): 1095–1108. doi:10.1175/2009BAMS2607.1. ISSN   0003-0007. Wikidata   Q58388472.
  35. E. Hawkins; S. Maddox; S. Cole; et al. (21 November 2003). "The 2dF Galaxy Redshift Survey: correlation functions, peculiar velocities and the matter density of the Universe". Monthly Notices of the Royal Astronomical Society . 346 (1): 78–96. arXiv: astro-ph/0212375 . Bibcode:2003MNRAS.346...78H. doi:10.1046/J.1365-2966.2003.07063.X. ISSN   0035-8711. Wikidata   Q58413610.
  36. Gerald A. Meehl; Lisa Goddard; James Murphy; et al. (October 2009). "Decadal Prediction". Bulletin of the American Meteorological Society . 90 (10): 1467–1486. doi:10.1175/2009BAMS2778.1. ISSN   0003-0007. Wikidata   Q58068824.
  37. Camilo Mora; Bénédicte Dousset; Iain R. Caldwell; et al. (19 June 2017). "Global risk of deadly heat". Nature Climate Change . 7 (7): 501–506. Bibcode:2017NatCC...7..501M. doi:10.1038/NCLIMATE3322. ISSN   1758-678X. S2CID   90219036. Wikidata   Q45373176.