This is a list of electoral results for the Division of Makin in Australian federal elections from the division's creation in 1984 until the present.
Member | Party | Term | |
---|---|---|---|
Peter Duncan | Labor | 1984–1996 | |
Trish Draper | Liberal | 1996–2007 | |
Tony Zappia | Labor | 2007–present |
Party | Candidate | Votes | % | ±% | |
---|---|---|---|---|---|
Labor | Tony Zappia | 49,843 | 46.30 | −2.12 | |
Liberal | Alan Howard-Jones | 33,840 | 31.44 | −1.44 | |
Greens | Emma Mustaca | 12,317 | 11.44 | +2.81 | |
One Nation | Rajan Vaid | 5,097 | 4.74 | +4.74 | |
United Australia | Kimberley Drozdoff | 4,638 | 4.31 | −2.13 | |
Australian Federation | Abram Lazootin | 1,907 | 1.77 | +1.77 | |
Total formal votes | 107,642 | 95.87 | +0.36 | ||
Informal votes | 4,639 | 4.13 | −0.36 | ||
Turnout | 112,281 | 91.20 | −1.92 | ||
Two-party-preferred result | |||||
Labor | Tony Zappia | 65,444 | 60.80 | +1.08 | |
Liberal | Alan Howard-Jones | 42,198 | 39.20 | −1.08 | |
Labor hold | Swing | +1.08 |
Party | Candidate | Votes | % | ±% | |
---|---|---|---|---|---|
Labor | Tony Zappia | 51,666 | 48.42 | +5.72 | |
Liberal | Hemant Dave | 35,087 | 32.88 | +5.42 | |
Greens | Stephanie Stewart | 9,211 | 8.63 | +3.92 | |
United Australia | Rachel Collis | 6,874 | 6.44 | +6.44 | |
Animal Justice | Lyn Gaston | 3,866 | 3.62 | +2.00 | |
Total formal votes | 106,704 | 95.51 | +0.13 | ||
Informal votes | 5,021 | 4.49 | −0.13 | ||
Turnout | 111,725 | 93.12 | +1.03 | ||
Two-party-preferred result | |||||
Labor | Tony Zappia | 63,726 | 59.72 | −1.07 | |
Liberal | Hemant Dave | 42,978 | 40.28 | +1.07 | |
Labor hold | Swing | −1.07 |
Party | Candidate | Votes | % | ±% | |
---|---|---|---|---|---|
Labor | Tony Zappia | 39,358 | 41.84 | −3.72 | |
Liberal | Graham Reynolds | 26,847 | 28.54 | −8.66 | |
Xenophon | Craig Bossie | 15,614 | 16.60 | +16.60 | |
Greens | Keiran Snape | 4,373 | 4.65 | −1.26 | |
Family First | Paul Coombe | 4,273 | 4.54 | −1.87 | |
Independent | Mark Aldridge | 2,126 | 2.26 | +2.26 | |
Animal Justice | Zarina Greenberg | 1,479 | 1.57 | +1.57 | |
Total formal votes | 94,070 | 95.56 | +0.44 | ||
Informal votes | 4,366 | 4.44 | −0.44 | ||
Turnout | 98,436 | 91.92 | −2.06 | ||
Two-party-preferred result | |||||
Labor | Tony Zappia | 56,116 | 59.65 | +4.59 | |
Liberal | Graham Reynolds | 37,954 | 40.35 | −4.59 | |
Labor hold | Swing | +4.59 |
Party | Candidate | Votes | % | ±% | |
---|---|---|---|---|---|
Labor | Tony Zappia | 41,873 | 45.56 | −4.70 | |
Liberal | Sue Lawrie | 34,192 | 37.20 | +6.75 | |
Family First | Mark Potter | 5,891 | 6.41 | +0.40 | |
Greens | Ami Harrison | 5,429 | 5.91 | −4.39 | |
Palmer United | Andrew Graham | 3,818 | 4.15 | +4.15 | |
Katter's Australian | Robert Jameson | 705 | 0.77 | +0.77 | |
Total formal votes | 91,908 | 95.12 | +1.13 | ||
Informal votes | 4,717 | 4.88 | −1.13 | ||
Turnout | 96,625 | 93.97 | −0.37 | ||
Two-party-preferred result | |||||
Labor | Tony Zappia | 50,604 | 55.06 | −6.94 | |
Liberal | Sue Lawrie | 41,304 | 44.94 | +6.94 | |
Labor hold | Swing | −6.94 |
Party | Candidate | Votes | % | ±% | |
---|---|---|---|---|---|
Labor | Tony Zappia | 43,114 | 50.58 | −0.87 | |
Liberal | Liz Davies | 25,740 | 30.20 | −8.07 | |
Greens | Jasemin Rose | 8,604 | 10.09 | +5.79 | |
Family First | Mark Potter | 5,089 | 5.97 | +2.42 | |
Liberal Democrats | Michael Gameau | 1,081 | 1.27 | +0.78 | |
One Nation | Anton Horvat | 662 | 0.78 | +0.20 | |
Democrats | Wayne Rich | 534 | 0.63 | −0.74 | |
Climate Sceptics | Robert Stewart | 409 | 0.48 | +0.48 | |
Total formal votes | 85,233 | 93.91 | −2.02 | ||
Informal votes | 5,532 | 6.09 | +2.02 | ||
Turnout | 90,765 | 94.29 | −1.38 | ||
Two-party-preferred result | |||||
Labor | Tony Zappia | 53,014 | 62.20 | +4.50 | |
Liberal | Liz Davies | 32,219 | 37.80 | −4.50 | |
Labor hold | Swing | +4.50 |
Party | Candidate | Votes | % | ±% | |
---|---|---|---|---|---|
Labor | Tony Zappia | 44,890 | 51.45 | +8.43 | |
Liberal | Bob Day | 33,390 | 38.27 | −6.44 | |
Greens | Graham Smith | 3,751 | 4.30 | +0.51 | |
Family First | Andrew Graham | 3,096 | 3.55 | −1.37 | |
Democrats | Aleisha Brown | 1,198 | 1.37 | −0.38 | |
One Nation | Robert Fechner | 502 | 0.58 | −0.26 | |
Liberty & Democracy | Garry Vandersluis | 428 | 0.49 | +0.49 | |
Total formal votes | 87,255 | 95.93 | +1.34 | ||
Informal votes | 3,705 | 4.07 | −1.34 | ||
Turnout | 90,960 | 95.81 | +0.34 | ||
Two-party-preferred result | |||||
Labor | Tony Zappia | 50,346 | 57.70 | +8.63 | |
Liberal | Bob Day | 36,909 | 42.30 | −8.63 | |
Labor gain from Liberal | Swing | +8.63 | |||
Party | Candidate | Votes | % | ±% | |
---|---|---|---|---|---|
Liberal | Trish Draper | 37,912 | 44.71 | −1.01 | |
Labor | Tony Zappia | 36,486 | 43.02 | +6.33 | |
Family First | Rob Pillar | 4,172 | 4.92 | +4.92 | |
Greens | Jon Moore | 3,213 | 3.79 | +1.47 | |
Democrats | Catherine Opitz | 1,484 | 1.75 | −8.67 | |
Independent | Jeanie Walker | 820 | 0.97 | +0.97 | |
One Nation | Victor Horvat | 715 | 0.84 | −3.87 | |
Total formal votes | 84,802 | 94.59 | −0.15 | ||
Informal votes | 4,851 | 5.41 | +0.15 | ||
Turnout | 89,653 | 95.47 | −0.67 | ||
Two-party-preferred result | |||||
Liberal | Trish Draper | 43,186 | 50.93 | −2.73 | |
Labor | Tony Zappia | 41,616 | 49.07 | +2.73 | |
Liberal hold | Swing | -2.73 | |||
Party | Candidate | Votes | % | ±% | |
---|---|---|---|---|---|
Liberal | Trish Draper | 36,979 | 45.94 | +5.35 | |
Labor | Julie Woodman | 29,539 | 36.70 | −1.14 | |
Democrats | Christine Posta | 8,343 | 10.37 | +0.14 | |
One Nation | Rod Kowald | 3,779 | 4.69 | −4.95 | |
Greens | Allon Reeves | 1,850 | 2.30 | +2.30 | |
Total formal votes | 80,490 | 94.79 | −0.92 | ||
Informal votes | 4,420 | 5.21 | +0.92 | ||
Turnout | 84,910 | 96.68 | |||
Two-party-preferred result | |||||
Liberal | Trish Draper | 43,271 | 53.76 | +2.98 | |
Labor | Julie Woodman | 37,219 | 46.24 | −2.98 | |
Liberal hold | Swing | +2.98 | |||
Party | Candidate | Votes | % | ±% | |
---|---|---|---|---|---|
Liberal | Trish Draper | 33,702 | 40.70 | −3.85 | |
Labor | Gail Gago | 31,194 | 37.67 | −3.07 | |
Democrats | Christine Posta | 8,502 | 10.27 | +1.04 | |
One Nation | Rod Kowald | 8,009 | 9.67 | +9.67 | |
Independent | Mike Wohltmann | 1,002 | 1.21 | +1.21 | |
Natural Law | Geoffrey Wells | 391 | 0.47 | −0.44 | |
Total formal votes | 82,800 | 95.70 | +0.70 | ||
Informal votes | 3,719 | 4.30 | −0.70 | ||
Turnout | 86,519 | 96.31 | −0.18 | ||
Two-party-preferred result | |||||
Liberal | Trish Draper | 42,180 | 50.94 | −0.14 | |
Labor | Gail Gago | 40,620 | 49.06 | +0.14 | |
Liberal hold | Swing | -0.14 | |||
Party | Candidate | Votes | % | ±% | |
---|---|---|---|---|---|
Liberal | Trish Draper | 35,762 | 44.55 | +3.36 | |
Labor | Peter Duncan | 32,709 | 40.75 | −6.04 | |
Democrats | Tony Hill | 7,404 | 9.22 | +2.11 | |
Greens | Henri Mueller | 1,914 | 2.38 | +2.38 | |
Independent | Mary Newcombe | 757 | 0.94 | +0.94 | |
Natural Law | Andrew Scott | 731 | 0.91 | −0.16 | |
Independent | Tony Baker | 726 | 0.90 | +0.90 | |
Barry Illert | 267 | 0.33 | +0.33 | ||
Total formal votes | 80,270 | 95.00 | −1.36 | ||
Informal votes | 4,223 | 5.00 | +1.36 | ||
Turnout | 84,493 | 96.49 | +0.58 | ||
Two-party-preferred result | |||||
Liberal | Trish Draper | 40,840 | 51.08 | +4.79 | |
Labor | Peter Duncan | 39,106 | 48.92 | −4.79 | |
Liberal gain from Labor | Swing | +4.79 | |||
Party | Candidate | Votes | % | ±% | |
---|---|---|---|---|---|
Labor | Peter Duncan | 36,748 | 46.79 | +5.49 | |
Liberal | Alan Irving | 32,353 | 41.19 | +2.87 | |
Democrats | Angela Smith | 5,585 | 7.11 | −8.60 | |
Independent | Eva Dobson | 986 | 1.26 | +1.26 | |
Call to Australia | Dorothy Durland | 986 | 1.26 | −1.97 | |
Natural Law | Susan Brown | 844 | 1.07 | +1.07 | |
Independent | Alf Taylor | 745 | 0.95 | +0.95 | |
Independent | Stan Batten | 294 | 0.37 | +0.37 | |
Total formal votes | 78,541 | 96.36 | +0.14 | ||
Informal votes | 2,966 | 3.64 | −0.14 | ||
Turnout | 81,507 | 95.91 | |||
Two-party-preferred result | |||||
Labor | Peter Duncan | 42,155 | 53.70 | +0.28 | |
Liberal | Alan Irving | 36,339 | 46.30 | −0.28 | |
Labor hold | Swing | +0.28 | |||
Party | Candidate | Votes | % | ±% | |
---|---|---|---|---|---|
Labor | Peter Duncan | 28,529 | 40.8 | −6.5 | |
Liberal | Daryl Hicks | 27,462 | 39.3 | −0.1 | |
Democrats | Steve Bartholomew | 10,619 | 15.2 | +6.2 | |
Call to Australia | Jeff Penny | 2,320 | 3.3 | +3.3 | |
Independent | Geoff Roberts | 639 | 0.9 | +0.9 | |
Independent | David Howard | 309 | 0.4 | +0.4 | |
Total formal votes | 69,878 | 96.2 | |||
Informal votes | 2,775 | 3.8 | |||
Turnout | 72,653 | 96.8 | |||
Two-party-preferred result | |||||
Labor | Peter Duncan | 36,573 | 52.4 | −1.0 | |
Liberal | Daryl Hicks | 33,197 | 47.6 | +1.0 | |
Labor hold | Swing | -1.0 | |||
Party | Candidate | Votes | % | ±% | |
---|---|---|---|---|---|
Labor | Peter Duncan | 29,361 | 47.3 | −0.9 | |
Liberal | Neville Joyce | 24,465 | 39.4 | +0.4 | |
Democrats | Sandra Kanck | 5,606 | 9.0 | −0.5 | |
National | Natalie Richardson | 1,505 | 2.4 | +1.7 | |
Unite Australia | Kenneth Taplin | 671 | 1.1 | +1.1 | |
Independent | A. Wunderlich | 441 | 0.7 | +0.7 | |
Total formal votes | 62,049 | 93.4 | |||
Informal votes | 4,398 | 6.6 | |||
Turnout | 66,447 | 94.8 | |||
Two-party-preferred result | |||||
Labor | Peter Duncan | 33,130 | 53.4 | −1.0 | |
Liberal | Neville Joyce | 28,904 | 46.6 | +1.0 | |
Labor hold | Swing | -1.0 | |||
Party | Candidate | Votes | % | ±% | |
---|---|---|---|---|---|
Labor | Peter Duncan | 27,282 | 48.2 | −5.8 | |
Liberal | Neville Joyce | 22,073 | 39.0 | +2.7 | |
Democrats | Andrew Coventry | 5,401 | 9.5 | +0.4 | |
Independent | Bernhard Buechner | 1,442 | 2.5 | +2.5 | |
National | John Henderson | 412 | 0.7 | +0.7 | |
Total formal votes | 56,610 | 90.3 | |||
Informal votes | 6,088 | 9.7 | |||
Turnout | 62,698 | 94.9 | |||
Two-party-preferred result | |||||
Labor | Peter Duncan | 30,792 | 54.4 | −4.8 | |
Liberal | Neville Joyce | 25,806 | 45.6 | +4.8 | |
Labor notional hold | Swing | -4.8 | |||
The Division of Hindmarsh is an Australian Electoral Division in South Australia covering the western suburbs of Adelaide. The division was one of the seven established when the former Division of South Australia was split on 2 October 1903, and was first contested at the 1903 election, though on vastly different boundaries. The Division is named after Sir John Hindmarsh, who was Governor of South Australia from 1836 to 1838. The 78 km2 seat extends from the coast in the west to South Road in the east, covering the suburbs of Ascot Park, Brooklyn Park, Edwardstown, Fulham, Glenelg, Grange, Henley Beach, Kidman Park, Kurralta Park, Morphettville, Plympton, Richmond, Semaphore Park, Torrensville, West Beach and West Lakes. The Adelaide International Airport is centrally located in the electorate, making noise pollution a prominent local issue, besides the aged care needs of the relatively elderly population − the seat has one of Australia's highest proportions of citizens over the age of 65. Progressive boundary redistributions over many decades transformed Hindmarsh from a safe Labor seat in to a marginal seat often won by the government of the day.
The Division of Makin is an electoral division for the Australian House of Representatives located in the northeastern suburbs of Adelaide. The 130 km2 seat covers an area from Little Para River and Gould Creek in the north-east to Grand Junction Road in the south and Port Wakefield Road in the west, including the suburbs of Banksia Park, Fairview Park, Golden Grove, Greenwith, Gulfview Heights, Ingle Farm, Mawson Lakes, Modbury, Para Hills, Para Vista, Pooraka, Redwood Park, Ridgehaven, Salisbury East, Salisbury Heights, St Agnes, Surrey Downs, Tea Tree Gully, Valley View, Vista, Walkley Heights, Wynn Vale, Yatala Vale, and parts of Gepps Cross and Hope Valley.
The Division of Port Adelaide was an Australian electoral division in the state of South Australia. The 181 km2 seat extended from St Kilda in the north to Grange Road and Findon in the south with part of Salisbury to the east. Suburbs included Alberton, Beverley, Birkenhead, Cheltenham, Findon, Kilkenny, Largs Bay, Mansfield Park, North Haven, Ottoway, Parafield Gardens, Paralowie, Pennington, Port Adelaide, Queenstown, Rosewater, Salisbury Downs, Semaphore, Woodville, West Croydon, and part of Seaton. The seat also included Torrens Island and Garden Island. Port Adelaide was abolished in 2019, after a redistribution triggered by a change in representation entitlement which saw South Australia's seats in the House of Representatives reduced to ten.
This is a list of electoral results for the Division of Cook in Australian federal elections from the electorate's creation in 1969 until the present.
This is a list of electoral results for the Division of Aston in Australian federal elections from the division's creation in 1984 until the present.
This is a list of electoral results for the Division of Dunkley in Australian federal elections from the division's creation in 1984 until the present.
This is a list of electoral results for the Division of Higgins in Australian federal elections from the division's creation in 1949 until the present.
This is a list of electoral results for the Division of Wannon in Australian federal elections from the division's creation in 1901 until the present.
This is a list of electoral results for the Division of Barker in Australian federal elections from the division's creation in 1903 until the present.
This is a list of electoral results for the Division of Boothby in Australian federal elections from the division's creation in 1903 until the present.
This is a list of electoral results for the Division of Grey in Australian federal elections from the division's creation in 1903 until the present.
This is a list of electoral results for the Division of Hindmarsh in Australian federal elections from the division's creation in 1903 until the present.
This is a list of electoral results for the Division of Kingston in Australian federal elections from the division's creation in 1949 until the present.
This is a list of electoral results for the Division of Mayo in Australian federal elections from the division's creation in 1984 until the present.
This is a list of electoral results for the Division of Port Adelaide in Australian federal elections from the division's creation in 1949 until its abolition in 2019.
This is a list of electoral results for the Division of Sturt in Australian federal elections from the division's creation in 1949 until the present.
This is a list of electoral results for the Division of Wakefield in Australian federal elections from the division's creation in 1903 until its abolition in 2019.
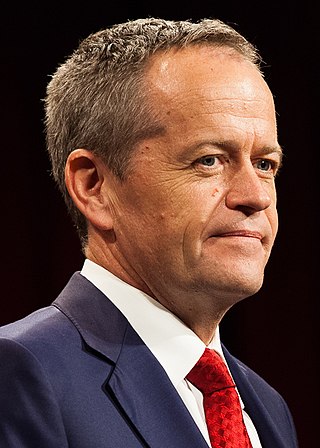
This is a list of electoral division results for the 2016 Australian federal election in the state of South Australia.
This is a list of electoral division results for the 2019 Australian federal election in the state of South Australia.
This is a list of electoral division results for the 2022 Australian federal election in the state of South Australia.