1990 Australian federal election

Last updated

1990 Australian federal election
Flag of Australia (converted).svg
  1987 24 March 1990 (1990-03-24) 1993  

All 148 seats in the House of Representatives
75 seats were needed for a majority in the House
40 (of the 76) seats in the Senate
Registered10,728,435 Increase2.svg 3.62%
Turnout10,225,800 (95.31%)
(Increase2.svg1.47 pp)
 First partySecond party
  Bob Hawke.jpg Andrew Peacock.jpg
Leader Bob Hawke Andrew Peacock
Party Labor Liberal–National Coalition
Leader since 8 February 1983 9 May 1989
Leader's seat Wills (Vic.) Kooyong (Vic.)
Last election86 seats62 seats
Seats won78 seats69 seats
Seat changeDecrease2.svg 8Increase2.svg 7
First preference  vote3,904,1384,302,127
Percentage39.44% 43.46%
SwingDecrease2.svg 6.46%Decrease2.svg 2.44%
TPP 49.90%50.10%
TPP swingDecrease2.svg 0.93Increase2.svg 0.93

1990 Australian federal election.svg
Results by division for the House of Representatives, shaded by winning party's margin of victory.

Prime Minister before election

Bob Hawke
Labor

Subsequent Prime Minister

Bob Hawke
Labor

The 1990 Australian federal election was held in Australia on 24 March 1990. All 148 seats in the House of Representatives and 40 seats in the 76-member Senate were up for election. The incumbent Australian Labor Party, led by Bob Hawke, defeated the opposition Liberal Party of Australia, led by Andrew Peacock, with its coalition partner, the National Party of Australia, led by Charles Blunt, despite losing the nationwide popular and two-party-preferred vote. The result saw the re-election of the Hawke government for a fourth successive term, the first time the ALP had won four consecutive terms.

Contents

Background

After John Howard lost the 1987 election to Hawke, Andrew Peacock was elected Deputy Leader in a show of party unity. In May 1989, Peacock's supporters mounted a successful leadership challenge which returned Peacock to the leadership. Hawke's Treasurer, Keating, ridiculed Peacock by asking: "Can the soufflé rise twice?" and calling him, in reference to Peacock's name, "all feathers and no meat".

Hawke's government was in political trouble, with high interest rates and a financial crisis in Victoria. The controversy over the Multifunction Polis boiled over during the federal election campaign. Peacock, declared that a future Coalition Government would abandon the project. [1] He shared the Asian "enclave" fears of RSL president Alf Garland and others. [2] The following day, The Australian newspaper ran a headline "Peacock a 'danger in the Lodge'". [3]

In February 1990, the Liberal Party's deputy Senate leader Austin Lewis was sacked from shadow cabinet after suggesting Peacock would be removed as leader if the Coalition failed to win the election. Lewis's comments reportedly reignited leadership tensions within the Liberal Party and were influential in Hawke deciding to set an election date in March, two months before the last possible date for the election. [4]

Opinion polling

[5]

DateBrandPrimary vote
ALP L/NP DEM OTH
24 March 1990 election39.44%43.4611.26%5.83%
22 March 1990Newspoll41.5%39.5%14%5%
4 March 1990Newspoll42%39%13%6%
10 December 1989Newspoll44.5%40%9.5%6%
27 March 1988Newspoll38%48%9%5%
23 August 1987Newspoll49%41%8%2%
18 July 1987 election 45.90%45.90%6.00%2.18%

Results

House of Representatives results

Government (78)

.mw-parser-output .legend{page-break-inside:avoid;break-inside:avoid-column}.mw-parser-output .legend-color{display:inline-block;min-width:1.25em;height:1.25em;line-height:1.25;margin:1px 0;text-align:center;border:1px solid black;background-color:transparent;color:black}.mw-parser-output .legend-text{}
Labor (78)

Opposition (69)
Coalition

Liberal (55)

National (14)

Crossbench (1)

Independent (1) Australian House of Representatives elected members, 1990.svg
Government (78)
  Labor (78)

Opposition (69)
Coalition
  Liberal (55)
  National (14)

Crossbench (1)
  Independent (1)
House of Reps (IRV) — 1990–93 — Turnout 95.32% (CV) — Informal 3.19%
1990 Australian House.svg
PartyVotes%SwingSeatsChange
   Liberal 3,440,90234.76 +0.4455Increase2.svg12
  National 833,5578.42–3.1014Decrease2.svg5
  Country Liberal 27,6680.28+0.050Steady2.svg
Liberal–National Coalition 4,302,12743.46–2.4469Increase2.svg7
  Labor 3,904,13839.44–6.4678Decrease2.svg 8
  Democrats 1,114,21611.26+5.26
  Greens (state-based) [a] 137,3511.37
  Independents [b] 257,1392.60+0.941Increase2.svg 1
 Others184,7031.86+1.67
Total9,899,674148 
Two-party-preferred vote
  Labor 4,930,83749.900.9378Decrease2.svg 8
  Liberal–National Coalition 4,950,07250.10+0.9369Increase2.svg 7
Invalid/blank votes326,1263.19–1.75
Turnout10,225,80095.32
Registered voters10,728,131
Source: Federal Elections 1990
Popular vote
Labor
39.44%
Liberal
35.04%
Democrats
11.26%
National
8.42%
Independents
2.55%
Other
3.30%
Two-party-preferred vote
Coalition
50.10%
Labor
49.90%
Parliament seats
Labor
52.70%
Coalition
46.62%
Independents
0.68%

Senate results

Government (32)

Labor (32)

Opposition (34)
Coalition

Liberal (29)

National (4)

CLP (1)

Crossbench (10)

Democrats (8)

WA Greens (1)

Independent (1) Australian Senate elected members, 1990.svg
Government (32)
  Labor (32)

Opposition (34)
Coalition
  Liberal (29)
  National (4)
  CLP (1)

Crossbench (10)
  Democrats (8)
  WA Greens (1)
  Independent (1)
Senate (STV GV) — 1990–93 — Turnout 95.81% (CV) — Informal 3.40%
1990 Australian Senate.svg
PartyVotes%SwingSeats wonSeats heldChange
  Liberal–National joint ticket2,429,55224.47+10.715N/AN/A
  Liberal 1,445,87214.56–6.411229Increase2.svg2
  National 258,1642.604.4914Decrease2.svg2
  Country Liberal 29,0450.29+0.0811Steady2.svg
Liberal–National coalition 4,162,63341.92–0.121934Steady2.svg
  Labor 3,813,54738.414.421532Steady2.svg
  Democrats 1,253,80712.63+4.1558Increase2.svg 1
  Greens [c] 208,1572.10+1.6611Increase2.svg 1
  Nuclear Disarmament [d] 38,0790.38–0.71Decrease2.svg 1
  Independents [e] 29,9740.30–1.591Decrease2.svg 1
 Others423,5684.25+2.07
Total9,929,765  4076
Invalid/blank votes349,0653.40–0.64
Turnout10,728,83095.81
Registered voters10,728,131
Source: Federal Elections 1990

Seats changing hands

Members listed in italics did not contest their seat at this election. Where redistributions occurred, the pre-1990 margin represents the redistributed margin.

SeatPre-1990SwingPost-1990
PartyMemberMarginMarginMemberParty
Adelaide, SA  Liberal Mike Pratt 6.5*N/A3.7 Bob Catley Labor 
Aston, Vic  Labor John Saunderson 2.577.204.63 Peter Nugent Liberal 
Ballarat, Vic  Labor John Mildren 2.124.001.88 Michael Ronaldson Liberal 
Bendigo, Vic  Labor John Brumby 3.965.101.14 Bruce Reid Liberal 
Corinella, Vic  Labornotional – new seat5.276.000.73 Russell Broadbent Liberal 
Dunkley, Vic  Labor Bob Chynoweth 5.606.801.20 Frank Ford Liberal 
Fairfax, Qld  National Evan Adermann 7.34N/A7.47 Alex Somlyay Liberal 
Hawker, SA  Labor Elizabeth Harvey 1.201.210.01 Chris Gallus Liberal 
Kennedy, Qld  National Bob Katter 2.994.401.41 Rob Hulls Labor 
La Trobe, Vic  Labor Peter Milton 4.255.601.35 Bob Charles Liberal 
McEwen, Vic  Labor Peter Cleeland 2.896.103.21 Fran Bailey Liberal 
McMillan, Vic  Labor Barry Cunningham 2.967.404.44 John Riggall Liberal 
Moreton, Qld  Liberal Don Cameron 0.703.052.35 Garrie Gibson Labor 
North Sydney, NSW  Liberal John Spender 4.23N/A7.66 Ted Mack Independent 
Page, NSW  National Ian Robinson 4.515.190.68 Harry Woods Labor 
Richmond, NSW  National Charles Blunt 6.597.090.50 Neville Newell Labor 

Outcome

The Gallagher Index result: 12.7 1990 Election Australia Gallagher Index.png
The Gallagher Index result: 12.7

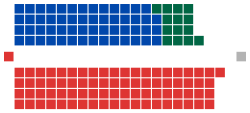
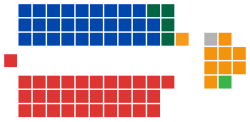
The 1990 election resulted in a modest swing to the opposition Coalition. Though Labor had to contend with the late 80s/early 90s recession, they won a record fourth successive election and a record 10 years in government with Bob Hawke as leader, a level of political success not previously seen by federal Labor. The election was to be Hawke's last as Prime Minister and Labor leader, he was replaced by Paul Keating on 20 December 1991 who would go on to lead Labor to win a record fifth successive election and a record 13 years (to the day) in government resulting from the 1993 election.

At the election, the Coalition won a slim majority of the two-party vote, and slashed Labor's majority from 24 seats to nine, most of the gains made in Victoria. [6] However, it only managed a two-party swing of 0.9 percent, which was not nearly enough to deliver the additional seven seats the Coalition needed to make Peacock Prime Minister. Despite having regained much of what the non-Labor forces had lost three years earlier, Peacock was forced to resign after the election.

This election saw the peak of the Australian Democrats' popularity under Janine Haines, and a WA Greens candidate won a seat in the Australian Senate for the first time – although the successful candidate, Jo Vallentine, was already a two-term senator, having previously won a seat for the Nuclear Disarmament Party at the 1984 election, and the Vallentine Peace Group at the 1987 election. Until 2010, this was the only post-war election where a third party (excluding splinter state parties and the Nationals) has won more than 10% of the primary vote for elections to the Australian House of Representatives.

It also saw the Nationals' leader, Charles Blunt, defeated in his own seat of Richmond by Labor challenger Neville Newell—only the second time that a major party leader had lost his own seat. Newell benefited from the presence of independent and anti-nuclear activist Helen Caldicott. Her preferences flowed overwhelmingly to Newell on the third count, allowing Newell to win despite having been second on the primary vote.

See also

Notes

  1. There was no federal Australian Greens party at this election. The Greens total includes Greens Western Australia (67,164), NSW Green Alliance [f] (45,819), Queensland Greens (10,054), United Tasmania Group (6,367), Greens South Australia (1,878) and ACT Green Democratic Alliance (6,069).
  2. The independent member was Ted Mack (NSW). He was the first Independent since 1966 Sam Benson
  3. The Greens total in the Senate includes Greens Western Australia (76,381 and elected one senator), NSW Green Alliance (64,583), Victorian Greens (23,420), Greens South Australia (19,499), United Tasmania Group (14,160), ACT Green Democratic Alliance (5,288), Greens New South Wales (4,826) and Australian Gruen (4,826).
  4. The election of Nuclear Disarmament Senator Robert Wood was void. Irina Dunn was declared elected in his place but was expelled from the party and served out the remainder of her term as an independent.
  5. Jo Vallentine had been re-elected in 1987 as an independent however she joined the Greens for this election. The sitting independent was Brian Harradine.
  6. At this election the Greens in New South Wales were a loose alliance largely organised by local groups, with 18 candidates running under a variety of names: Australian Gruen Party (Fowler, Macarthur, Mackellar, Macquarie, Prospect, St George, Throsby and Werriwa), the Greens (Phillip and Wentworth), Illawarra Greens (Cunningham and Hughes), Sydney Greens, South Sydney Greens (Kingsford Smith), Central Coast Green Party (Dobell and Robertson), Greens in Lowe and Cowper Greens.

References

  1. Hamilton, "Serendipity City", pp. 152-55.
  2. Jupp, James (2 April 2007). From White Australia to Woomera: The Story of Australian Immigration. Cambridge University Press. pp. 107–219. ISBN   978-0-521-69789-7 . Retrieved 12 January 2008.
  3. Washington, David (23 May 2016). "The more opinion, the less it matters" . Crikey. Retrieved 23 July 2023.
  4. "Peacock sacks top lib". The Canberra Times. 15 February 1990.
  5. "Federal Newspoll Archive - Infogram". infogram.com. Retrieved 8 April 2023.
  6. Megalogenis, George (25 June 2021). "Hard lessons: On unis, Coalition has embraced Howard's way". The Sydney Morning Herald. Retrieved 27 June 2021.