Results of the 1990 Australian federal election in Queensland

Last updated

1990 Australian federal election
(Queensland)
Flag of Queensland.svg
  1987 24 March 1990 1993  

All 24 Queensland seats in the Australian House of Representatives
and 6 seats in the Australian Senate
 First partySecond party
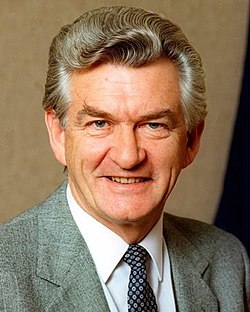
  Hawke Bob BANNER.jpg Andrew Peacock.jpg
Leader Bob Hawke Andrew Peacock
Party Labor Liberal/National coalition
Last election1311 seats
Seats won15 seats9 seats
Seat changeIncrease2.svg 2Decrease2.svg 2
Popular vote695,291756,680
Percentage41.6%45.3%
SwingDecrease2.svg 3.4Decrease2.svg 4.6
TPP 50.19%49.81%
TPP swingIncrease2.svg 0.87Decrease2.svg 0.87

This is a list of electoral division results for the Australian 1990 federal election in the state of Queensland. [1] [2]
Contents

Overall results

Turnout 94.7% (CV) — Informal 2.2% [3]
PartyVotes%SwingSeatsChange
   Liberal 476,56028.517.496Increase2.svg 1
  National 280,12016.76–12.093Decrease2.svg 3
Liberal/National Coalition 756,68045.27–4.609Decrease2.svg 2
  Labor 695,29141.59–3.3715Increase2.svg 2
  Democrats 193,81711.596.71
  Independent 11,4990.690.51
  Greens 10,0540.600.60
  Democratic Socialist 2,7280.160.16
  Conservative 1,5280.090.09
Total1,671,59724
Two-party-preferred vote
  Labor 837,50850.19+0.8715Increase2.svg 2
  Liberal/National Coalition 831,01549.81–0.879Decrease2.svg 2
Invalid/blank votes38,0652.23–1.18
Turnout1,709,66294.71
Registered voters1,805,141
Source: Federal Elections 1990

Results by division

Bowman

1990 Australian federal election: Bowman [1]
PartyCandidateVotes%±%
Labor Con Sciacca 34,92546.3−2.0
Liberal Peter Trounce23,57131.3+8.3
Democrats Phillip Grattan12,20716.2+7.2
National Stan Brimson4,6976.2−11.9
Total formal votes75,40097.7
Informal votes1,7732.3
Turnout 77,17395.6
Two-party-preferred result
Labor Con Sciacca 43,27557.5+2.5
Liberal Peter Trounce31,95042.5−2.5
Labor hold Swing +2.5

Brisbane

1990 Australian federal election: Brisbane
PartyCandidateVotes%±%
Labor Arch Bevis 29,14645.7−5.5
Liberal Keith Schafferius22,57335.4+7.4
Democrats Leo Talty7,81412.3+6.2
National Andrew Hassall1,9253.0−10.5
Independent Marylou Heath1,4102.2+2.2
Independent William Kenney4640.7−0.6
Democratic Socialist Peter Simmons4160.7+0.7
Total formal votes63,74897.9
Informal votes1,3842.1
Turnout 65,13295.1
Two-party-preferred result
Labor Arch Bevis 35,30055.5−0.9
Liberal Keith Schafferius28,34244.5+0.9
Labor hold Swing −0.9

Capricornia

1990 Australian federal election: Capricornia
PartyCandidateVotes%±%
Labor Keith Wright 33,20050.5−3.5
National Stan Collard 24,62737.5+3.9
Greens Craig Hardy7,88512.0+12.0
Total formal votes65,71297.9
Informal votes1,4132.1
Turnout 67,12595.7
Two-party-preferred result
Labor Keith Wright 37,55157.3+0.3
National Stan Collard 27,92642.7−0.3
Labor hold Swing +0.3

Dawson

1990 Australian federal election: Dawson
PartyCandidateVotes%±%
Labor Greg McGarvie29,86942.9−4.0
National Ray Braithwaite 26,78038.4−7.7
Liberal Jim Seymour7,45910.7+3.6
Democrats Tom Irelandes5,5668.0+8.0
Total formal votes69,67497.9
Informal votes1,5252.1
Turnout 71,19995.1
Two-party-preferred result
National Ray Braithwaite 34,87350.1−1.8
Labor Greg McGarvie34,69249.9+1.8
National hold Swing -1.8

Fadden

1990 Australian federal election: Fadden
PartyCandidateVotes%±%
Liberal David Jull 28,36143.9+8.1
Labor Marie Wilkinson24,38837.8−3.4
Democrats Eugene Cross8,64113.4+6.6
National Peter Freckleton2,3543.6−12.5
Independent Richard Heymann7941.2+1.2
Total formal votes64,53897.8
Informal votes1,4382.2
Turnout 66,02195.3
Two-party-preferred result
Liberal David Jull 34,62153.8−0.6
Labor Marie Wilkinson29,76646.2+0.6
Liberal hold Swing -0.6

Fairfax

1990 Australian federal election: Fairfax
PartyCandidateVotes%±%
Labor Beryl Muspratt26,01732.8−2.4
National John Stone 20,92826.4−13.4
Liberal Alex Somlyay 20,39525.7+8.5
Democrats Bob Borsellino10,43913.2+5.5
Conservative Sheila Adams1,5281.9+1.9
Total formal votes79,30798.0
Informal votes1,6322.0
Turnout 80,93994.8
Two-party-preferred result
Liberal Alex Somlyay 45,44957.5+57.5
Labor Beryl Muspratt33,63442.5−0.2
Liberal gain from National Swing +0.2

Fisher

1990 Australian federal election: Fisher
PartyCandidateVotes%±%
Labor Michael Lavarch 35,00442.8−1.9
Liberal Tony Holmes21,22526.0+13.8
National Brian Sheahan14,49017.7−18.6
Democrats Glen Spicer10,98113.4+6.6
Total formal votes81,70098.0
Informal votes1,6552.0
Turnout 83,35595.9
Two-party-preferred result
Labor Michael Lavarch 42,40152.0+1.5
Liberal Tony Holmes39,13648.0+48.0
Labor hold Swing +1.5

Forde

1990 Australian federal election: Forde
PartyCandidateVotes%±%
Labor Mary Crawford 28,06343.7−2.7
Liberal Brad Bauman24,23237.7+2.2
Democrats Jason Neville7,13811.1+5.0
Greens Coral Wynter2,1693.4+3.4
National Ross Adams1,9673.1−8.9
Independent John Duggan6461.0+1.0
Total formal votes64,21597.4
Informal votes1,7172.6
Turnout 65,93294.4
Two-party-preferred result
Labor Mary Crawford 34,91054.5+3.5
Liberal Brad Bauman29,16145.5−3.5
Labor hold Swing +3.5

Griffith

1990 Australian federal election: Griffith
PartyCandidateVotes%±%
Labor Ben Humphreys 31,61649.8−4.7
Liberal Doug Edwards20,58032.4+8.3
Democrats Steven Lyndon8,43113.3+5.7
National Sean Cousins1,8722.9−11.0
Democratic Socialist Russel Norman 9631.5+1.5
Total formal votes63,46297.2
Informal votes1,8122.8
Turnout 65,27493.0
Two-party-preferred result
Labor Ben Humphreys 38,17960.3−0.1
Liberal Doug Edwards25,15539.7+0.1
Labor hold Swing -0.1

Groom

1990 Australian federal election: Groom
PartyCandidateVotes%±%
Liberal Bill Taylor 29,04140.8+27.5
Labor Stewart Scott-Irving22,10331.1−1.3
National Terry Day11,66416.4−32.5
Democrats Trevor Ives8,31911.7+6.3
Total formal votes71,12798.1
Informal votes1,3961.9
Turnout 72,52395.9
Two-party-preferred result
Liberal Bill Taylor 44,13862.2+1.9
Labor Stewart Scott-Irving26,88037.8−1.9
Liberal hold Swing +1.9

Herbert

1990 Australian federal election: Herbert
PartyCandidateVotes%±%
Labor Ted Lindsay 32,16645.8−5.3
Liberal Peter Hazard17,38424.8+8.7
National Rick Anderton12,74918.2−9.5
Democrats Colin Parker7,88511.2+6.1
Total formal votes70,18498.0
Informal votes1,4192.0
Turnout 71,60393.3
Two-party-preferred result
Labor Ted Lindsay 38,43854.9−1.9
Liberal Peter Hazard31,52945.1+45.1
Labor hold Swing -1.9

Hinkler

1990 Australian federal election: Hinkler
PartyCandidateVotes%±%
Labor Brian Courtice 32,99547.3−0.8
National John Evans23,45333.7−9.4
Democrats Ronald Cullen6,6309.5+6.3
Liberal Frank Hibble6,6189.5+3.9
Total formal votes69,69697.7
Informal votes1,6202.3
Turnout 71,31696.1
Two-party-preferred result
Labor Brian Courtice 37,54354.0+2.9
National John Evans32,03346.0−2.9
Labor hold Swing +2.9

Kennedy

1990 Australian federal election: Kennedy
PartyCandidateVotes%±%
Labor Rob Hulls 28,93644.3−0.8
National Ross Shannon21,75133.3−14.0
Liberal Fred Tritton9,13414.0+6.4
Democrats Patricia Banzhaf5,4738.4+8.4
Total formal votes65,29497.2
Informal votes1,9012.8
Turnout 67,19592.6
Two-party-preferred result
Labor Rob Hulls 33,53651.4+4.4
National Ross Shannon31,70248.6−4.4
Labor gain from National Swing +4.4

Leichhardt

1990 Australian federal election: Leichhardt
PartyCandidateVotes%±%
Labor John Gayler 31,31844.5−6.3
Liberal Bill Cummings15,98522.7+13.1
National Kevin Byrne14,55320.7−15.6
Democrats Jim Downey7,38210.5+7.1
Independent Jim Waldock1,1481.6+1.6
Total formal votes70,38697.5
Informal votes1,8162.5
Turnout 72,20292.7
Two-party-preferred result
Labor John Gayler 37,60653.5−0.8
Liberal Bill Cummings32,72746.5+46.5
Labor hold Swing -0.8

Lilley

1990 Australian federal election: Lilley
PartyCandidateVotes%±%
Labor Elaine Darling 32,45350.0−7.3
Liberal Ronald Nankervis22,64434.9+7.7
Democrats Elizabeth Rowland7,02310.8+10.8
National Steve Purtill2,2173.4−12.2
Democratic Socialist Dave Riley5570.9+0.9
Total formal votes64,89497.9
Informal votes1,4182.1
Turnout 66,31294.4
Two-party-preferred result
Labor Elaine Darling 37,37357.7−0.5
Liberal Ronald Nankervis27,42242.3+0.5
Labor hold Swing -0.5

Maranoa

1990 Australian federal election: Maranoa
PartyCandidateVotes%±%
National Bruce Scott 31,59447.7−7.8
Labor John Adams20,71631.3−0.8
Liberal John Stone8,37312.6−7.8
Democrats Mary Hopkins5,5678.4+4.3
Total formal votes66,25097.8
Informal votes1,4692.2
Turnout 67,71994.7
Two-party-preferred result
National Bruce Scott 41,83863.2−1.7
Labor John Adams24,35136.8+1.7
National hold Swing -1.7

McPherson

1990 Australian federal election: McPherson
PartyCandidateVotes%±%
Liberal John Bradford 40,98650.2+11.8
Labor Pat Stern26,60732.6−1.1
Democrats Robert North8,0889.9+4.6
National Randall Cook4,1025.0−17.6
Independent Bert Cockerill1,7032.1+2.1
Independent Otto Kuhne1700.2+0.2
Total formal votes81,65697.8
Informal votes1,8122.2
Turnout 83,46893.5
Two-party-preferred result
Liberal John Bradford 49,76061.0−1.6
Labor Pat Stern31,76939.0+1.6
Liberal hold Swing -1.6

Moncrieff

1990 Australian federal election: Moncrieff
PartyCandidateVotes%±%
Liberal Kathy Sullivan 37,63047.8+13.1
Labor Col Struthers26,47333.6−2.3
Democrats Jonathan Cornish10,02812.7+7.3
National Peter Lyons4,5495.8−18.2
Total formal votes78,68097.6
Informal votes1,9412.4
Turnout 80,62193.9
Two-party-preferred result
Liberal Kathy Sullivan 46,75959.5−0.7
Labor Col Struthers31,86840.5+0.7
Liberal hold Swing -0.7

Moreton

1990 Australian federal election: Moreton
PartyCandidateVotes%±%
Labor Garrie Gibson 26,96042.7−2.4
Liberal Don Cameron 26,32341.7+3.5
Democrats Ken Davies8,51613.5+7.6
National Vince Cottrell1,3662.2−8.6
Total formal votes63,16598.0
Informal votes1,2752.0
Turnout 64,44095.3
Two-party-preferred result
Labor Garrie Gibson 32,99652.3+3.0
Liberal Don Cameron 30,03747.7−3.0
Labor gain from Liberal Swing +3.0

Oxley

1990 Australian federal election: Oxley
PartyCandidateVotes%±%
Labor Les Scott 33,35952.1−7.8
Liberal David Cooke18,73929.3+14.5
Democrats Althea Rossmuller9,66015.1+10.0
National Ray Wilms2,2673.5−16.7
Total formal votes64,02597.5
Informal votes1,6602.5
Turnout 65,68595.5
Two-party-preferred result
Labor Les Scott 39,61562.0−2.9
Liberal David Cooke24,27038.0+38.0
Labor hold Swing -2.9

Petrie

1990 Australian federal election: Petrie
PartyCandidateVotes%±%
Labor Gary Johns 30,76344.2−2.0
Liberal Bruce Flegg 27,99240.2+7.2
Democrats Anthony Bloomer7,74011.1+4.4
National Peter Bateman2,3273.3−10.9
Democratic Socialist Natasha Simons7921.1+1.1
Total formal votes69,61498.1
Informal votes1,3351.9
Turnout 70,94995.2
Two-party-preferred result
Labor Gary Johns 36,32752.3+0.9
Liberal Bruce Flegg 33,18547.7−0.9
Labor hold Swing +0.9

Rankin

1990 Australian federal election: Rankin
PartyCandidateVotes%±%
Labor David Beddall 31,78246.3−2.9
Liberal John Miles16,01423.3+10.2
National Huan Fraser 11,06516.1−15.9
Democrats John Hoskins7,51210.9+6.5
Independent Richard Whiteman1,8652.7+2.7
Independent Cheryl Crisp4650.7+0.7
Total formal votes68,70397.3
Informal votes1,9162.7
Turnout 70,61994.2
Two-party-preferred result
Labor David Beddall 38,03755.5+0.7
Liberal John Miles30,51944.5+44.5
Labor hold Swing +0.7

Ryan

1990 Australian federal election: Ryan
PartyCandidateVotes%±%
Liberal John Moore 31,30143.8+1.2
Labor Denny Campbell21,08529.5−5.9
Democrats Adair Ferguson 13,66919.1+10.6
National Helen McAllister4,3256.0−7.5
Independent Alan Skyring1,1391.6+1.6
Total formal votes71,51998.7
Informal votes9551.3
Turnout 72,47495.6
Two-party-preferred result
Liberal John Moore 40,87057.2−1.7
Labor Denny Campbell30,57642.8+1.7
Liberal hold Swing -1.7

Wide Bay

1990 Australian federal election: Wide Bay
PartyCandidateVotes%±%
National Warren Truss 32,49847.3−3.2
Labor Andrew Foley25,34736.9−0.6
Democrats Bryan Sandall9,10813.3+8.8
Independent John Zschech1,6952.5+2.5
Total formal votes68,64897.5
Informal votes1,7382.5
Turnout 70,38695.6
Two-party-preferred result
National Warren Truss 37,61354.9−3.9
Labor Andrew Foley30,88545.1+3.9
National hold Swing -3.9

See also

Related Research Articles

This is a list of electoral results for the Division of Farrer in Australian federal elections from the electorate's creation in 1949 until the present.

This is a list of electoral results for the Division of Kingsford Smith in Australian federal elections from the division's creation in 1949 until the present.

This is a list of electoral results for the Division of Macarthur in Australian federal elections from the division's creation in 1949 until the present.

This is a list of electoral results for the Division of Mitchell in Australian federal elections from the division's creation in 1949 until the present.

This is a list of electoral results for the Division of Newcastle in Australian federal elections from the electorate's creation in 1901 until the present.

This is a list of electoral results for the Division of North Sydney in Australian federal elections from the electorate's creation in 1901 until the present.

This is a list of electoral results for the Division of Parramatta in Australian federal elections from the division's creation in 1901 until the present.

This is a list of electoral results for the Division of Shortland in Australian federal elections from the division's creation in 1949 until the present.

This is a list of electoral results for the Division of Corio in Australian federal elections from the division's creation in 1901 until the present.

This is a list of electoral results for the Division of McMillan in Australian federal elections from the division's creation in 1949 until its abolition in 2019.

This is a list of electoral results for the Division of Bowman in Australian federal elections from the division's creation in 1949 until the present.

This is a list of electoral results for the Division of Adelaide in Australian federal elections from the division's creation in 1903 until the present.

This is a list of electoral results for the Division of Canberra in Australian federal elections from the division's creation in 1974 until the present.

This is a list of electoral division results for the Australian 1914 federal election.

<span class="mw-page-title-main">Results of the 1998 Australian federal election in Queensland</span> Results of the 1998 Australian Election in Queensland

This is a list of electoral division results for the 1998 Australian federal election in the state of Queensland.

This is a list of electoral division results for the Australian 1963 federal election.

<span class="mw-page-title-main">Results of the 1987 Australian federal election in Queensland</span>

This is a list of electoral division results for the Australian 1987 federal election in the state of Queensland.

<span class="mw-page-title-main">Results of the 1993 Australian federal election in Queensland</span>

This is a list of electoral division results for the Australian 1993 federal election in the state of Queensland.

<span class="mw-page-title-main">Results of the 1993 Australian federal election (House of Representatives)</span>

The following tables show results for the Australian House of Representatives at the 1993 federal election held on 13 March 1993.

<span class="mw-page-title-main">Results of the 1990 Australian federal election (House of Representatives)</span>

The following tables show results for the Australian House of Representatives at the 1990 federal election held on 24 March 1990.

References

  1. 1 2 "1990 House of Representatives: Queensland". Psephos Adam Carr's Election Archive. Retrieved 11 June 2022.
  2. Newman, G; Kopras, A (20 July 1990). "Federal Elections 1990" (PDF). Background Paper 18 1990. Parliamentary Research Service. ISSN   1034-8107 . Retrieved 20 June 2022.
  3. "1990 House of Representatives". Psephos Adam Carr's Election Archive. Retrieved 10 June 2022.