Results of the 1987 Australian federal election in Queensland

Last updated

1987 Australian federal election
(Queensland)
Flag of Queensland.svg
  1984 1 December 1987 1990  

All 39 Queensland seats in the Australian House of Representatives
and all 12 seats in the Australian Senate
 First partySecond party
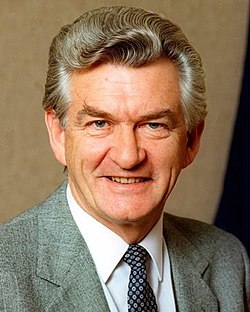
  John howard.jpg Hawke Bob BANNER.jpg
Leader John Howard Bob Hawke
Party Liberal/National coalition Labor
Last election15 seats9
Seats won11 seats13 seats
Seat changeIncrease2.svg 4Increase2.svg 4
Popular vote758,234683,640
Percentage49.9%45.0%
SwingDecrease2.svg 1.0Increase2.svg 0.9
TPP 50.7%49.3%
TPP swingDecrease2.svg 1.61Increase2.svg 1.61

This is a list of electoral division results for the Australian 1987 federal election in the state of Queensland. [1]

Contents

Overall results

Turnout 92.2% (CV) — Informal 3.4% [2]
PartyVotes%SwingSeatsChange
   National 438,62728.85-2.856Decrease2.svg 2
  Liberal 319,60721.021.865Decrease2.svg 2
Liberal/National Coalition 758,23449.87-0.9911Decrease2.svg 4
  Labor 683,64044.960.9013Increase2.svg 4
  Democrats 74,2154.880.06
  Independent 2,6840.18-0.04
  Nuclear Disarmament 1,7180.110.00
Total1,520,49124
Two-party-preferred vote
  Labor 749,83449.3249.3213Increase2.svg 4
  Liberal/National Coalition 770,51550.6849.3211Decrease2.svg 4
Invalid/blank votes53,6223.41-1.19
Turnout1,574,11392.18
Registered voters1,707,701
Source: Psephos Adam Carr's Election Archive 1987

Results by division

Bowman

1987 Australian federal election: Bowman [1]
PartyCandidateVotes%±%
Labor Con Sciacca 31,22348.3−3.3
Liberal Andrew Crowe14,86623.0+1.0
National Bill Barry-Cotter11,69618.1−2.0
Democrats Diana Taylor5,8009.0+2.5
Independent Barry Cullen1,1231.7+1.7
Total formal votes64,70896.3
Informal votes2,4823.7
Turnout 67,19093.6
Two-party-preferred result
Labor Con Sciacca 35,60955.0−0.3
Liberal Andrew Crowe29,08545.0+0.3
Labor hold Swing −0.3

Brisbane

1987 Australian federal election: Brisbane
PartyCandidateVotes%±%
Labor Manfred Cross 32,12551.2+0.9
Liberal David Drake17,54328.0+0.0
National Cliff Newman8,49513.5−2.0
Democrats Michael van Prooyen3,7996.1−0.1
Independent William Kenney7921.3+1.3
Total formal votes62,75497.1
Informal votes1,8832.9
Turnout 64,63792.2
Two-party-preferred result
Labor Manfred Cross 35,40956.4+2.1
Liberal David Drake27,33543.6−2.1
Labor hold Swing +2.1

Capricornia

1987 Australian federal election: Capricornia
PartyCandidateVotes%±%
Labor Keith Wright 34,14754.0+3.1
National Ted Price21,27233.6−3.0
Liberal Tom Young6,0849.6+0.5
Nuclear Disarmament J. S. Page1,7182.7+2.7
Total formal votes63,22197.3
Informal votes1,7522.7
Turnout 64,97393.6
Two-party-preferred result
Labor Keith Wright 36,06557.0+2.9
National Ted Price27,15543.0−2.9
Labor hold Swing +2.9

Dawson

1987 Australian federal election: Dawson
PartyCandidateVotes%±%
Labor Bill Welch30,23246.9+2.2
National Ray Braithwaite 29,69846.1−6.0
Liberal Paul Pottinger4,5537.1+7.1
Total formal votes64,48396.3
Informal votes2,5103.7
Turnout 66,99392.8
Two-party-preferred result
National Ray Braithwaite 33,43651.9−1.9
Labor Bill Welch31,04748.1+1.9
National hold Swing -1.9

Fadden

1987 Australian federal election: Fadden
PartyCandidateVotes%±%
Labor Peter Wilson24,48141.2+0.6
Liberal David Jull 21,25835.8−0.4
National Peter Robinson9,58116.1−0.6
Democrats Kenneth Davies4,0656.8+0.4
Total formal votes59,38596.6
Informal votes2,0843.4
Turnout 61,46993.2
Two-party-preferred result
Liberal David Jull 32,31154.4−0.3
Labor Peter Wilson27,07445.6+0.3
Liberal hold Swing -0.3

Fairfax

1987 Australian federal election: Fairfax
PartyCandidateVotes%±%
National Evan Adermann 24,81739.8−5.4
Labor Alison Smith21,95335.2+1.5
Liberal Joy Brannelly10,73317.2+3.0
Democrats Brian Stockwell4,7867.7+0.8
Total formal votes62,28996.8
Informal votes2,0853.2
Turnout 64,37492.0
Two-party-preferred result
National Evan Adermann 35,71357.3−3.3
Labor Alison Smith26,56542.7+3.3
National hold Swing -3.3

Fisher

1987 Australian federal election: Fisher
PartyCandidateVotes%±%
Labor Michael Lavarch 30,18144.7+2.3
National Peter Slipper 24,52236.3−0.1
Liberal Ian Mutch8,20812.2−2.2
Democrats Glen Spicer4,5976.8−0.1
Total formal votes67,50896.7
Informal votes2,3263.3
Turnout 69,83493.5
Two-party-preferred result
Labor Michael Lavarch 34,09750.5+2.8
National Peter Slipper 33,39449.5−2.8
Labor gain from National Swing +2.8

Forde

1987 Australian federal election: Forde
PartyCandidateVotes%±%
Labor Mary Crawford 27,44146.4+1.5
Liberal David Watson 20,95735.5+3.7
National Tony Philbrick7,10712.0−4.5
Democrats Sheila Rieff3,5826.1−0.7
Total formal votes59,08796.7
Informal votes2,0403.3
Turnout 61,12792.3
Two-party-preferred result
Labor Mary Crawford 30,15251.0+1.0
Liberal David Watson 28,92549.0−1.0
Labor gain from Liberal Swing +1.0

Griffith

1987 Australian federal election: Griffith
PartyCandidateVotes%±%
Labor Ben Humphreys 33,44254.5+0.1
Liberal Wayne Black14,77824.1+1.0
National Sean Cousins8,55013.9−2.4
Democrats Lance Winter4,6477.6+2.5
Total formal votes61,41795.7
Informal votes2,7544.3
Turnout 64,17189.0
Two-party-preferred result
Labor Ben Humphreys 37,09860.4+0.1
Liberal Wayne Black24,31239.6−0.1
Labor hold Swing +0.1

Groom

1987 Australian federal election: Groom
PartyCandidateVotes%±%
National Tom McVeigh 32,05448.9−7.1
Labor Linda Dwyer21,21732.4+0.9
Liberal Alexander Munro8,75413.3+4.4
Democrats Mark Carew3,5565.4+1.8
Total formal votes65,58197.1
Informal votes1,9382.9
Turnout 67,51993.4
Two-party-preferred result
National Tom McVeigh 41,17462.8−3.1
Labor Linda Dwyer24,40737.2+3.1
National hold Swing -3.1

Herbert

1987 Australian federal election: Herbert
PartyCandidateVotes%±%
Labor Ted Lindsay 33,50751.1+0.8
National Jose Goicoechea18,20627.7−3.9
Liberal Rosemary Pavey10,57116.1+1.9
Democrats Paul Swanton3,3445.1+1.2
Total formal votes65,62896.6
Informal votes2,3383.4
Turnout 67,96690.3
Two-party-preferred result
Labor Ted Lindsay 37,25956.8+3.2
National Jose Goicoechea28,36043.2−3.2
Labor hold Swing +3.2

Hinkler

1987 Australian federal election: Hinkler
PartyCandidateVotes%±%
Labor Brian Courtice 30,81448.1+1.0
National Bryan Conquest 27,66543.1−0.4
Liberal John Williams3,6045.6+0.6
Democrats Geoff Boshell2,0393.2−0.7
Total formal votes64,12297.4
Informal votes1,7332.6
Turnout 65,85593.8
Two-party-preferred result
Labor Brian Courtice 32,75351.1+1.3
National Bryan Conquest 31,36748.9−1.3
Labor gain from National Swing +1.3

Kennedy

1987 Australian federal election: Kennedy
PartyCandidateVotes%±%
National Bob Katter, Sr. 28,58547.3−3.0
Labor James Byrne27,20845.1+2.2
Liberal Ross Cooper4,5847.6+3.6
Total formal votes60,37794.9
Informal votes3,2765.1
Turnout 63,65389.2
Two-party-preferred result
National Bob Katter, Sr. 31,98953.0−2.2
Labor James Byrne28,38047.0+2.2
National hold Swing -2.2

Leichhardt

1987 Australian federal election: Leichhardt
PartyCandidateVotes%±%
Labor John Gayler 31,60150.8−0.2
National Kevin Byrne22,55136.3+0.0
Liberal Ronald Barry5,9429.6+2.6
Democrats Wilfred Tapau2,0853.4−1.4
Total formal votes62,17995.6
Informal votes2,8464.4
Turnout 65,02590.2
Two-party-preferred result
Labor John Gayler 33,74754.3−1.2
National Kevin Byrne28,43045.7+1.2
Labor hold Swing -1.2

Lilley

1987 Australian federal election: Lilley
PartyCandidateVotes%±%
Labor Elaine Darling 36,24857.3+2.8
Liberal John Gates17,18127.2+2.5
National Andrew Brown9,84215.6−3.9
Total formal votes63,27196.6
Informal votes2,2263.4
Turnout 65,49791.8
Two-party-preferred result
Labor Elaine Darling 36,84858.2+2.5
Liberal John Gates26,42241.8−2.5
Labor hold Swing +2.5

Maranoa

1987 Australian federal election: Maranoa
PartyCandidateVotes%±%
National Ian Cameron 35,59455.5−7.4
Labor Raymond Paroz20,59632.1+0.6
Liberal Bruce Christie5,3648.4+8.4
Democrats Richard McCarthy2,6054.1−1.5
Total formal votes64,15995.9
Informal votes2,7284.1
Turnout 66,88793.1
Two-party-preferred result
National Ian Cameron 41,60464.9−0.6
Labor Raymond Paroz22,55035.1+0.6
National hold Swing -0.6

McPherson

1987 Australian federal election: McPherson
PartyCandidateVotes%±%
Liberal Peter White 27,14738.4−1.4
Labor Pat Stern23,85033.7+1.5
National Max McMahon15,97422.6−0.6
Democrats Yvonne Stoelhorst3,7465.3+1.0
Total formal votes70,71796.8
Informal votes2,3673.2
Turnout 73,08490.5
Two-party-preferred result
Liberal Peter White 44,26362.6−0.9
Labor Pat Stern26,45437.4+0.9
Liberal hold Swing -0.9

Moncrieff

1987 Australian federal election: Moncrieff
PartyCandidateVotes%±%
Labor Robert Boyce23,06735.9−0.1
Liberal Kathy Sullivan 22,27134.7+3.8
National Lester Hughes15,40524.0−3.9
Democrats George Spencer3,4445.4+1.7
Total formal votes64,18796.6
Informal votes2,2343.4
Turnout 66,42191.4
Two-party-preferred result
Liberal Kathy Sullivan 38,64460.2+0.3
Labor Robert Boyce25,54339.8−0.3
Liberal hold Swing +0.3

Moreton

1987 Australian federal election: Moreton
PartyCandidateVotes%±%
Labor Garrie Gibson 28,05345.1+1.6
Liberal Don Cameron 23,74038.2−4.4
National Peter Freckleton6,71210.8+1.7
Democrats Manfred Willinger3,6655.9+1.0
Total formal votes62,17097.0
Informal votes1,9333.0
Turnout 64,10393.5
Two-party-preferred result
Liberal Don Cameron 31,51850.7−2.6
Labor Garrie Gibson 30,64549.3+2.6
Liberal hold Swing -2.6

Oxley

1987 Australian federal election: Oxley
PartyCandidateVotes%±%
Labor Bill Hayden 36,24659.9+0.4
National Barry Hoffensetz12,24820.2+1.2
Liberal Janice Akroyd8,94814.8−2.0
Democrats John Loughney3,0815.1+0.4
Total formal votes60,52396.8
Informal votes2,0233.2
Turnout 62,54692.0
Two-party-preferred result
Labor Bill Hayden 39,25664.9+1.9
National Barry Hoffensetz21,26535.1−1.9
Labor hold Swing +1.9

Petrie

1987 Australian federal election: Petrie
PartyCandidateVotes%±%
Labor Gary Johns 30,53746.2+0.0
Liberal John Hodges 21,78033.0−0.2
National Gerard Cross9,37514.2−1.6
Democrats Isobel Robinson4,4046.7+1.9
Total formal votes66,09697.0
Informal votes2,0133.0
Turnout 68,10993.5
Two-party-preferred result
Labor Gary Johns 33,99551.4+2.0
Liberal John Hodges 32,08648.6−2.0
Labor gain from Liberal Swing +2.0

Rankin

1987 Australian federal election: Rankin
PartyCandidateVotes%±%
Labor David Beddall 29,11849.2+2.5
National Gerard Walsh13,25622.4−1.3
Liberal John Patterson7,76913.1−1.3
National Peter Jorgenson5,7089.6+9.6
Democrats Miriam Cope2,5994.4−1.2
Independent Michael Dunne6701.1+1.1
Independent Terri Cavanagh990.2+0.2
Total formal votes59,21995.8
Informal votes2,5784.2
Turnout 67,79792.1
Two-party-preferred result
Labor David Beddall 32,41554.7+4.2
National Gerard Walsh26,79145.3−4.2
Labor hold Swing +4.2

Ryan

1987 Australian federal election: Ryan
PartyCandidateVotes%±%
Liberal John Moore 28,35642.6+1.9
Labor Fleur Yuile23,53835.4+1.4
National Steve Walters9,01513.5−3.5
Democrats Daphne Woodhouse5,6578.5+0.2
Total formal votes66,56697.9
Informal votes1,4012.1
Turnout 67,96792.5
Two-party-preferred result
Liberal John Moore 39,18158.9−1.5
Labor Fleur Yuile27,37941.1+1.5
Liberal hold Swing -1.5

Wide Bay

1987 Australian federal election: Wide Bay
PartyCandidateVotes%±%
National Clarrie Millar 30,69950.5−8.6
Labor Andrew Foley22,81537.5+1.6
Liberal Cam Primavera4,6167.6+7.6
Democrats Ray Barry2,7144.5−0.5
Total formal votes60,84496.7
Informal votes2,0723.3
Turnout 62,91693.7
Two-party-preferred result
National Clarrie Millar 35,75558.8−3.0
Labor Andrew Foley25,08741.2+3.0
National hold Swing -3.0

See also

Related Research Articles

This is a list of electoral results for the Division of Bennelong in Australian federal elections from the electorate's creation in 1949 until the present.

This is a list of electoral results for the Division of Blaxland in Australian federal elections since the electorate's creation in 1949 until the present.

This is a list of electoral results for the Division of Farrer in Australian federal elections from the electorate's creation in 1949 until the present.

This is a list of electoral results for the Division of Grayndler in Australian federal elections from the electorate's creation in 1949 until the present. Grayndler is currently held by Anthony Albanese, the Prime Minister of Australia and the leader of the Australian Labor Party.

This is a list of electoral results for the Division of Kingsford Smith in Australian federal elections from the division's creation in 1949 until the present.

This is a list of electoral results for the Division of Macarthur in Australian federal elections from the division's creation in 1949 until the present.

This is a list of electoral results for the Division of Mackellar in Australian federal elections from the division's creation in 1949 until the present.

This is a list of electoral results for the Division of Mitchell in Australian federal elections from the division's creation in 1949 until the present.

This is a list of electoral results for the Division of Newcastle in Australian federal elections from the electorate's creation in 1901 until the present.

This is a list of electoral results for the Division of Parramatta in Australian federal elections from the division's creation in 1901 until the present.

This is a list of electoral results for the Division of Shortland in Australian federal elections from the division's creation in 1949 until the present.

This is a list of electoral results for the Division of Corio in Australian federal elections from the division's creation in 1901 until the present.

This is a list of electoral results for the Division of McMillan in Australian federal elections from the division's creation in 1949 until its abolition in 2019.

This is a list of electoral results for the Division of Bowman in Australian federal elections from the division's creation in 1949 until the present.

This is a list of electoral results for the Division of Adelaide in Australian federal elections from the division's creation in 1903 until the present.

This is a list of electoral results for the Division of Canberra in Australian federal elections from the division's creation in 1974 until the present.

This is a list of electoral results for the Division of Braddon in Australian federal elections from the division's creation in 1955 until the present.

This is a list of electoral division results for the Australian 1914 federal election.

This is a list of electoral division results for the Australian 1963 federal election.

<span class="mw-page-title-main">Results of the 1984 Australian federal election in Queensland</span>

This is a list of electoral division results for the Australian 1984 federal election in the state of Queensland.

References

  1. 1 2 "1987 House of Representatives: Queensland". Psephos Adam Carr's Election Archive. Retrieved 15 June 2022.
  2. "1987 House of Representatives". Psephos Adam Carr's Election Archive. Retrieved 10 June 2022.