Results of the 1987 Australian federal election in Victoria

Last updated

1987 Australian federal election
(Victoria)
Flag of Victoria (Australia).svg
  1984 1 December 1987 1990  

All 39 Victoria seats in the Australian House of Representatives
and all 12 seats in the Australian Senate
 First partySecond party
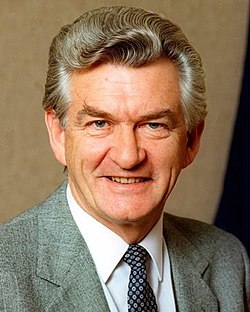
  Hawke Bob BANNER.jpg John howard.jpg
Leader Bob Hawke John Howard
Party Labor Liberal/National coalition
Last election2514 seats
Seats won24 seats15 seats
Seat changeDecrease2.svg 1Increase2.svg 1
Popular vote1,139,4371,076,408
Percentage46.9%44.3%
SwingDecrease2.svg 3.0Increase2.svg 1.2
TPP 52.31%47.69%
TPP swingDecrease2.svg 0.78Increase2.svg 0.78

This is a list of electoral division results for the Australian 1987 federal election in the state of Victoria. [1]

Contents

Overall results

Turnout 94.9% (CV) — Informal 5.2% [2]
PartyVotes%SwingSeatsChange
   Liberal 922,68038.021.1412Increase2.svg 1
  National 154,0886.35–0.023Steady2.svg
Liberal/National Coalition 1,076,76844.371.1315Increase2.svg 1
  Labor 1,139,33746.95–1.9924Decrease2.svg 1
  Democrats 163,1606.720.35
  Independent 34,4911.42–0.73
  Unite Australia 5,4270.22
  Pensioner 3,3460.140.02
  Democratic Labor 3,3340.14–4.90
  Socialist Workers 1,0970.04–0.02
Total2,426,96039
Two-party-preferred vote
  Labor 1,268,89452.31–0.7824Decrease2.svg 1
  Liberal/National Coalition 1,157,03747.69+0.7815Increase2.svg 1
Invalid/blank votes134,4155.25–2.95
Turnout2,561,37595.1
Registered voters2,698,034
Source: Psephos Adam Carr's Election Archive 1987

Results by division

Aston

1987 Australian federal election: Aston
PartyCandidateVotes%±%
Labor John Saunderson 30,81748.4−2.7
Liberal Gordon Ashley 26,59541.8+2.4
Democrats Jan Bricknell5,1348.1+1.2
National Hugh Gurney1,1131.8+1.8
Total formal votes63,65995.2
Informal votes3,2074.8
Turnout 66,86695.8
Two-party-preferred result
Labor John Saunderson 34,09953.6−2.9
Liberal Gordon Ashley 29,54746.4+2.9
Labor hold Swing −2.9

Ballarat

1987 Australian federal election: Ballarat
PartyCandidateVotes%±%
Labor John Mildren 31,44747.1−2.3
Liberal John Ronan24,05936.0−8.4
National John Boland8,25012.3+10.8
Democrats Phil Henseleit2,6854.0+0.6
Independent Martin Greany3920.6+0.6
Total formal votes66,83396.4
Informal votes2,4603.6
Turnout 69,29396.5
Two-party-preferred result
Labor John Mildren 34,67451.9−0.1
Liberal John Ronan32,14748.1+0.1
Labor hold Swing −0.1

Batman

1987 Australian federal election: Batman
PartyCandidateVotes%±%
Labor Brian Howe 35,28564.0−7.6
Liberal Ron Dunn13,40824.3+3.5
Democrats Jan Roberts5,3219.7+5.4
Independent Sue Phillips6321.1+1.1
Independent Darren Chapman4660.8+0.8
Total formal votes55,11290.2
Informal votes6,0009.8
Turnout 61,11293.1
Two-party-preferred result
Labor Brian Howe 40,04172.8−1.9
Liberal Ron Dunn14,98327.2+1.9
Labor hold Swing −1.9

Bendigo

1987 Australian federal election: Bendigo
PartyCandidateVotes%±%
Labor John Brumby 32,31248.5−0.6
Liberal John Radford 16,50824.8−11.9
National Ron Best 14,70322.1+13.2
Democrats Kaye Swanton2,7004.0+0.8
Independent John Somerville3300.5+0.5
Independent Sharyne O'Grady1260.2+0.2
Total formal votes66,67996.2
Informal votes2,6613.8
Turnout 69,34096.2
Two-party-preferred result
Labor John Brumby 35,67753.5+1.4
Liberal John Radford 31,04646.5−1.4
Labor hold Swing +1.4

Bruce

1987 Australian federal election: Bruce
PartyCandidateVotes%±%
Liberal Ken Aldred 28,56847.5+0.8
Labor Patrick Robinson25,86643.0−0.6
Democrats Kare Carr4,8208.0+2.0
Unite Australia Terence Pooley9101.5+1.5
Total formal votes60,16495.0
Informal votes3,1715.0
Turnout 63,33596.0
Two-party-preferred result
Liberal Ken Aldred 31,28252.0−0.1
Labor Patrick Robinson28,86248.0+0.1
Liberal hold Swing −0.1

Burke

1987 Australian federal election: Burke
PartyCandidateVotes%±%
Labor Neil O'Keefe 32,73849.3+0.6
Liberal Peter Dale25,53438.5−2.8
Democrats Susan Mullington4,7937.2+1.4
National Barry McLeod3,2784.9+1.7
Total formal votes66,34395.4
Informal votes3,2144.6
Turnout 69,55794.9
Two-party-preferred result
Labor Neil O'Keefe 36,09854.4+1.5
Liberal Peter Dale30,20645.6−1.5
Labor hold Swing +1.5

Calwell

1987 Australian federal election: Calwell
PartyCandidateVotes%±%
Labor Andrew Theophanous 36,61461.1−7.7
Liberal Chris Dimitrijevic16,24427.1+2.2
Democrats Louise Stewart5,9389.9+5.2
National Ivan Pavlekovich-Smith1,1301.9+1.9
Total formal votes59,92690.1
Informal votes6,5559.9
Turnout 66,48196.0
Two-party-preferred result
Labor Andrew Theophanous 41,07768.6−3.6
Liberal Chris Dimitrijevic18,80731.4+3.6
Labor hold Swing −3.6

Casey

1987 Australian federal election: Casey
PartyCandidateVotes%±%
Liberal Bob Halverson 30,22546.7+2.8
Labor David McKenzie 27,89143.1−1.1
Democrats Chris Mar5,0717.8+1.3
National Roy Haffenden8611.3+0.0
Pensioner Flo Madden6171.0+0.0
Total formal votes64,66596.6
Informal votes2,2573.4
Turnout 66,92296.2
Two-party-preferred result
Liberal Bob Halverson 33,12551.2+0.6
Labor David McKenzie 31,52848.8−0.6
Liberal hold Swing +0.6

Chisholm

1987 Australian federal election: Chisholm
PartyCandidateVotes%±%
Liberal Michael Wooldridge 29,70546.4+2.1
Labor Helen Mayer 28,09443.9−1.7
Democrats Fran Robbins4,2226.6+0.4
National Edward Wajsbrem1,1011.7+0.6
Unite Australia Ernest Rodeck6371.0+1.0
Independent Barry Gration2260.4+0.4
Total formal votes63,98595.8
Informal votes2,7724.2
Turnout 66,75795.7
Two-party-preferred result
Liberal Michael Wooldridge 32,40050.7+0.9
Labor Helen Mayer 31,52849.3−0.9
Liberal gain from Labor Swing +0.9

Corangamite

1987 Australian federal election: Corangamite
PartyCandidateVotes%±%
Liberal Stewart McArthur 32,34148.3+0.4
Labor Ian Caldwell27,62041.2−0.7
Democrats Rob Mann4,2256.3+2.8
National John McDonald2,8134.2+0.9
Total formal votes66,99996.4
Informal votes2,5043.6
Turnout 69,50395.9
Two-party-preferred result
Liberal Stewart McArthur 36,57254.6+1.2
Labor Ian Caldwell30,41145.4−1.2
Liberal hold Swing +1.2

Corio

1987 Australian federal election: Corio [1]
PartyCandidateVotes%±%
Labor Gordon Scholes 34,06454.9−4.3
Liberal Patrick Conheady20,22032.6−1.1
Democrats Greta Pearce3,7756.1+3.1
Independent Danielle Dixon2,6024.2+4.2
Independent Tom Davies1,3782.2+2.2
Total formal votes62,03994.4
Informal votes3,6885.6
Turnout 65,72796.9
Two-party-preferred result
Labor Gordon Scholes 39,02662.9+0.5
Liberal Patrick Conheady23,00437.1−0.5
Labor hold Swing +0.5

Deakin

1987 Australian federal election: Deakin
PartyCandidateVotes%±%
Liberal Julian Beale 30,66548.5+1.7
Labor Madelyn Myatt27,88444.1−1.1
Democrats Marcus Bosch3,9926.3+0.2
Unite Australia Rick Wright4010.6+0.6
Independent Gil Speirs2670.4+0.4
Total formal votes63,20996.0
Informal votes2,6604.0
Turnout 65,86996.4
Two-party-preferred result
Liberal Julian Beale 32,56951.5+0.8
Labor Madelyn Myatt30,62448.5−0.8
Liberal hold Swing +0.8

Dunkley

1987 Australian federal election: Dunkley
PartyCandidateVotes%±%
Labor Bob Chynoweth 28,74046.7+0.3
Liberal Tom Warwick26,26742.6−1.1
Democrats Robyn Kirby3,8816.3+0.2
Independent Chris van Lieshout1,8983.1+3.1
Pensioner Andrew Murray6151.0+1.0
Independent Les Johnson1930.3+0.3
Total formal votes61,59495.6+3.3
Informal votes2,8044.4−3.3
Turnout 64,39896.0
Two-party-preferred result
Labor Bob Chynoweth 31,83751.7+0.6
Liberal Tom Warwick29,72348.3−0.6
Labor hold Swing +0.6

Flinders

1987 Australian federal election: Flinders
PartyCandidateVotes%±%
Liberal Peter Reith 31,73747.2+1.8
Labor Tony Lack29,46943.8−1.3
Democrats Andrew Suttie3,6555.4+1.1
Pensioner Jonathan Miln1,4492.2+1.3
Independent Noel Maud9861.5+1.5
Total formal votes67,29695.4
Informal votes3,2694.6
Turnout 70,56594.5
Two-party-preferred result
Liberal Peter Reith 34,49851.3+0.1
Labor Tony Lack32,75748.7−0.1
Liberal hold Swing +0.1

Gellibrand

1987 Australian federal election: Gellibrand
PartyCandidateVotes%±%
Labor Ralph Willis 38,45164.9−4.6
Liberal Tim Warner14,50624.5+0.5
Democrats Susan Holmes3,6656.2+2.5
Independent Rosalba Vicari1,5692.6+2.6
Socialist Workers James Doughney1,0971.9+0.8
Total formal votes59,28891.9
Informal votes5,2458.1
Turnout 64,53393.4
Two-party-preferred result
Labor Ralph Willis 41,80470.6−2.8
Liberal Tim Warner17,39029.4+2.8
Labor hold Swing −2.8

Gippsland

1987 Australian federal election: Gippsland
PartyCandidateVotes%±%
National Peter McGauran 29,08444.3+3.5
Labor Zona Child20,05630.5+1.7
Liberal Grant Pearce12,38418.9−0.8
Democrats Pierre Forcier2,7854.2+1.2
Independent Rod Anderson1,3502.1+2.1
Total formal votes65,65996.6
Informal votes2,2943.4
Turnout 67,95395.3
Two-party-preferred result
National Peter McGauran 42,68765.0+0.7
Labor Zona Child22,95835.0−0.7
National hold Swing +0.7

Goldstein

1987 Australian federal election: Goldstein
PartyCandidateVotes%±%
Liberal Ian Macphee 35,02955.4+3.3
Labor Murray McInnes22,34335.4−3.0
Democrats Maureen Boaler3,6545.8+0.7
Democratic Labor Michael Rowe1,4362.3−0.5
Independent Tiger Casley7391.2+1.2
Total formal votes63,20195.0
Informal votes3,2955.0
Turnout 66,49693.5
Two-party-preferred result
Liberal Ian Macphee 37,56659.5+3.3
Labor Murray McInnes25,61840.5−3.3
Liberal hold Swing +3.3

Henty

1987 Australian federal election: Henty
PartyCandidateVotes%±%
Labor Joan Child 30,69550.5−2.4
Liberal Rudi Michelson25,13841.3+2.2
Democrats Paul Hegarty4,9928.2+2.9
Total formal votes60,82594.5
Informal votes3,5265.5
Turnout 64,35194.3
Two-party-preferred result
Labor Joan Child 33,30154.8−1.9
Liberal Rudi Michelson27,49645.2+1.9
Labor hold Swing -1.9

Higgins

1987 Australian federal election: Higgins
PartyCandidateVotes%±%
Liberal Roger Shipton 36,13959.0+2.0
Labor Barbara Higgins19,89932.5−0.9
Democrats Clive Jackson5,1888.5+2.7
Total formal votes61,22695.9
Informal votes2,6064.1
Turnout 63,83293.4
Two-party-preferred result
Liberal Roger Shipton 38,32862.6+0.5
Labor Barbara Higgins22,88837.4−0.5
Liberal hold Swing +0.5

Holt

1987 Australian federal election: Holt
PartyCandidateVotes%±%
Labor Michael Duffy 32,02656.1−2.6
Liberal Janice Bateman20,76436.4+1.6
Democrats Geoff Herbert4,2827.5+2.8
Total formal votes57,07293.1
Informal votes4,2006.9
Turnout 61,27293.7
Two-party-preferred result
Labor Michael Duffy 34,48960.4−1.8
Liberal Janice Bateman22,58339.6+1.8
Labor hold Swing -1.8

Hotham

1987 Australian federal election: Hotham
PartyCandidateVotes%±%
Labor Lewis Kent 33,03552.5−1.0
Liberal Peter McCall25,43240.5+5.6
Democrats Len de Koning4,4027.0−1.5
Total formal votes62,86993.3
Informal votes4,5436.7
Turnout 67,41295.5
Two-party-preferred result
Labor Lewis Kent 35,53556.5−1.6
Liberal Peter McCall27,32843.5+1.6
Labor hold Swing −1.6

Indi

1987 Australian federal election: Indi
PartyCandidateVotes%±%
Liberal Ewen Cameron 24,84437.4+4.1
Labor Danny Walsh22,06533.2−1.1
National Philip Pullar13,43520.2−8.1
Independent Rob Taylor5,4158.2+8.2
Pensioner Brian Lumsden6651.0+1.0
Total formal votes66,42496.1
Informal votes2,6833.9
Turnout 69,10795.0
Two-party-preferred result
Liberal Ewen Cameron 41,54962.6+0.3
Labor Danny Walsh24,86037.4−0.3
Liberal hold Swing +0.3

Isaacs

1987 Australian federal election: Isaacs
PartyCandidateVotes%±%
Labor David Charles 29,32547.7−3.2
Liberal Rod Atkinson 26,44843.1+3.0
Democrats Maxine Aspinall4,4287.2+1.1
National Bill Buchanan8331.4+0.1
Independent Linda Ely3950.6+0.6
Total formal votes61,42995.5
Informal votes2,8914.5
Turnout 64,32095.2
Two-party-preferred result
Labor David Charles 32,35152.7−1.7
Liberal Rod Atkinson 29,05747.3+1.7
Labor hold Swing −1.7

Jagajaga

1987 Australian federal election: Jagajaga
PartyCandidateVotes%±%
Labor Peter Staples 29,69851.3−1.7
Liberal John Pasquarelli 21,47937.1−0.1
Democrats Howard McCallum5,0238.7+3.3
National Laurie Kirwan9771.7+1.7
Independent Lynette Manning7571.3+1.3
Total formal votes57,93494.7
Informal votes3,2425.3
Turnout 61,17695.3
Two-party-preferred result
Labor Peter Staples 33,69858.2+2.1
Liberal John Pasquarelli 24,19141.8−2.1
Labor hold Swing +2.1

Kooyong

1987 Australian federal election: Kooyong
PartyCandidateVotes%±%
Liberal Andrew Peacock 36,60859.1+0.3
Labor Lindsay Woods19,03030.7−2.6
Democrats Peter Taft4,5937.4+1.9
Unite Australia Margaret Cole1,6852.7+1.8
Total formal votes61,91695.8
Informal votes2,7094.2
Turnout 64,62594.4
Two-party-preferred result
Liberal Andrew Peacock 39,64764.0+1.0
Labor Lindsay Woods22,26536.0−1.0
Liberal hold Swing +1.0

La Trobe

1987 Australian federal election: La Trobe
PartyCandidateVotes%±%
Labor Peter Milton 31,51050.8−3.2
Liberal Bob Charles 24,01338.7+2.3
Democrats John Benton6,46110.4+2.6
Total formal votes61,98495.2
Informal votes3,1214.8
Turnout 65,10595.7
Two-party-preferred result
Labor Peter Milton 35,53957.3−1.4
Liberal Bob Charles 26,43942.7+1.4
Labor hold Swing −1.4

Lalor

1987 Australian federal election: Lalor
PartyCandidateVotes%±%
Labor Barry Jones 42,08763.8−3.4
Liberal Darren Farquhar17,96627.2+0.1
Democrats Heather Jeffcoat5,8998.9+4.7
Total formal votes65,96293.4
Informal votes4,6766.6
Turnout 70,62895.2
Two-party-preferred result
Labor Barry Jones 45,82469.5−0.5
Liberal Darren Farquhar20,11830.5+0.5
Labor hold Swing −0.5

Mallee

1987 Australian federal election: Mallee
PartyCandidateVotes%±%
National Peter Fisher 31,19248.0−5.5
Labor Linda Freedman18,46128.4+3.3
Liberal Adrian Kidd12,15118.7+3.4
Independent Neil Lehmann3,2084.9+4.9
Total formal votes65,01296.6
Informal votes2,2753.4
Turnout 67,28795.8
Two-party-preferred result
National Peter Fisher 45,59570.1−1.3
Labor Linda Freedman19,41429.9+1.3
National hold Swing −1.3

Maribyrnong

1987 Australian federal election: Maribyrnong
PartyCandidateVotes%±%
Labor Alan Griffiths 31,50252.6−2.0
Liberal Victor Rudewych22,50537.6+2.3
Democrats David Mackay3,9406.6+2.3
Democratic Labor Mark Beshara1,8983.2−1.2
Total formal votes59,84593.3
Informal votes4,2796.7
Turnout 64,12495.5
Two-party-preferred result
Labor Alan Griffiths 34,25257.2−3.2
Liberal Victor Rudewych25,58442.8+3.2
Labor hold Swing -3.2

McEwen

1987 Australian federal election: McEwen [1]
PartyCandidateVotes%±%
Labor Peter Cleeland 31,05248.5+1.5
Liberal David Millie24,02137.5+0.7
Democrats Doug Lorman4,5517.1+0.7
National Andrew Coller4,0386.3−2.0
Independent Robert Wilson3690.6+0.6
Total formal votes64,03195.8
Informal votes2,8044.2
Turnout 66,83596.2
Two-party-preferred result
Labor Peter Cleeland 34,60554.1+2.0
Liberal David Millie29,39745.9−2.0
Labor hold Swing +2.0

McMillan

1987 Australian federal election: McMillan [1]
PartyCandidateVotes%±%
Labor Barry Cunningham 30,61048.9−4.6
Liberal John Kiely19,84631.7−1.5
National Pat O'Brien7,54412.1+6.0
Democrats Ross Ollquist3,3195.3+1.1
Independent Anne Lorraine8331.3+1.3
Independent Thomas Walsh4040.6+0.6
Total formal votes62,55696.2
Informal votes2,4663.8
Turnout 65,02295.6
Two-party-preferred result
Labor Barry Cunningham 33,94954.3−3.8
Liberal John Kiely28,55545.7+3.8
Labor hold Swing -3.8

Melbourne

1987 Australian federal election: Melbourne
PartyCandidateVotes%±%
Labor Gerry Hand 35,87362.6−2.5
Liberal Frank Randle15,26726.7+4.5
Democrats Peter La Franchi5,3749.4+2.3
Imperial British James Ferrari7571.3−2.3
Total formal votes57,27191.9
Informal votes5,0318.1
Turnout 62,30190.1
Two-party-preferred result
Labor Gerry Hand 39,70569.4−0.6
Liberal Frank Randle17,52630.6+0.6
Labor hold Swing -0.6

Melbourne Ports

1987 Australian federal election: Melbourne Ports
PartyCandidateVotes%±%
Labor Clyde Holding 29,83150.1−7.0
Liberal Allan Paull20,68334.7+3.9
Democrats Di Bretherton5,5689.3+3.5
Independent Alan Brown3,4835.9+5.9
Total formal votes59,56593.6
Informal votes4,0396.4
Turnout 63,60487.9
Two-party-preferred result
Labor Clyde Holding 35,64359.9−4.3
Liberal Allan Paull23,83140.1+4.3
Labor hold Swing -4.3

Menzies

1987 Australian federal election: Menzies
PartyCandidateVotes%±%
Liberal Neil Brown 32,40153.0+2.4
Labor Ivana Csar22,50536.8−4.0
Democrats Marjorie White5,2668.6+2.3
Unite Australia Bruce Plain9721.6+1.6
Total formal votes61,14495.3
Informal votes2,9994.7
Turnout 64,14395.1
Two-party-preferred result
Liberal Neil Brown 35,04957.3+1.6
Labor Ivana Csar26,08542.7−1.6
Liberal hold Swing +1.6

Murray

1987 Australian federal election: Murray
PartyCandidateVotes%±%
National Bruce Lloyd 32,73850.8−7.5
Labor Mark Anderson16,91926.3+1.7
Liberal Brendan Norden9,54514.8+2.6
Democrats Ralph Linford2,6314.1+0.7
Independent John Hargreaves2,5744.0+4.0
Total formal votes64,40795.8
Informal votes2,7964.2
Turnout 67,20395.8
Two-party-preferred result
National Bruce Lloyd 45,29070.4−2.7
Labor Mark Anderson19,07429.6+2.7
National hold Swing -2.7

Scullin

1987 Australian federal election: Scullin
PartyCandidateVotes%±%
Labor Harry Jenkins 37,15868.7−2.8
Liberal Mike Kabos12,99124.0+5.4
Democrats Joe Privitelli3,9007.2+0.5
Total formal votes54,04990.6
Informal votes5,5819.4
Turnout 59,63095.4
Two-party-preferred result
Labor Harry Jenkins 39,53973.2−4.4
Liberal Mike Kabos14,49726.8+4.4
Labor hold Swing -4.4

Streeton

1987 Australian federal election: Streeton
PartyCandidateVotes%±%
Labor Tony Lamb 29,03846.7−2.3
Liberal Russell Broadbent 26,28842.3+3.1
Democrats Rika Mason5,0638.1+0.7
National Ken Trembath9981.6−1.2
Unite Australia Tessa Cunningham8221.3+1.3
Total formal votes62,20996.3
Informal votes2,3933.7
Turnout 64,60295.5
Two-party-preferred result
Labor Tony Lamb 32,91152.9−0.4
Liberal Russell Broadbent 29,27547.1+0.4
Labor hold Swing -0.4

Wannon

1987 Australian federal election: Wannon
PartyCandidateVotes%±%
Liberal David Hawker 38,83860.2+1.8
Labor Kevin Watt21,47833.3+1.3
Democrats Julie Jennings4,2356.6+3.9
Total formal votes64,55197.0
Informal votes2,0193.0
Turnout 66,57096.8
Two-party-preferred result
Liberal David Hawker 40,71863.1−2.3
Labor Kevin Watt23,82936.9+2.3
Liberal hold Swing -2.3

Wills

1987 Australian federal election: Wills
PartyCandidateVotes%±%
Labor Bob Hawke 35,84961.8−4.7
Liberal Olga Venables15,31826.4+3.0
Democrats Ken Eley3,7296.4+2.4
Independent Fast Bucks1,4002.4+2.4
Independent Lyn Teather1,0921.9+1.9
Independent Ian Sykes6501.1+1.1
Total formal votes58,03891.4
Informal votes5,4808.6
Turnout 63,51893.3
Two-party-preferred result
Labor Bob Hawke 40,51969.9−0.4
Liberal Olga Venables17,43230.1+0.4
Labor hold Swing -0.4

See also

Related Research Articles

This is a list of electoral results for the Division of Bennelong in Australian federal elections from the electorate's creation in 1949 until the present.

This is a list of electoral results for the Division of Blaxland in Australian federal elections since the electorate's creation in 1949 until the present.

This is a list of electoral results for the Division of Farrer in Australian federal elections from the electorate's creation in 1949 until the present.

This is a list of electoral results for the Division of Kingsford Smith in Australian federal elections from the division's creation in 1949 until the present.

This is a list of electoral results for the Division of Mackellar in Australian federal elections from the division's creation in 1949 until the present.

This is a list of electoral results for the Division of Mitchell in Australian federal elections from the division's creation in 1949 until the present.

This is a list of electoral results for the Division of Newcastle in Australian federal elections from the electorate's creation in 1901 until the present.

This is a list of electoral results for the Division of Parramatta in Australian federal elections from the division's creation in 1901 until the present.

This is a list of electoral results for the Division of Shortland in Australian federal elections from the division's creation in 1949 until the present.

This is a list of electoral results for the Division of Corio in Australian federal elections from the division's creation in 1901 until the present.

McEwan, an Australian Electoral Division in the Australian state of Victoria, has existed since 1984.

This is a list of electoral results for the Division of McMillan in Australian federal elections from the division's creation in 1949 until its abolition in 2019.

This is a list of electoral results for the Division of Burke in Australian federal elections from the division's creation in 1949 until its abolition in 1955.

This is a list of electoral results for the Division of Higinbotham in Australian federal elections from the division's creation in 1949 until its abolition in 1969.

This is a list of electoral results for the Division of Adelaide in Australian federal elections from the division's creation in 1903 until the present.

This is a list of electoral results for the Division of Canberra in Australian federal elections from the division's creation in 1974 until the present.

This is a list of electoral results for the Division of Braddon in Australian federal elections from the division's creation in 1955 until the present.

This is a list of electoral division results for the Australian 1914 federal election.

This is a list of electoral division results for the Australian 1963 federal election.

<span class="mw-page-title-main">Results of the 1984 Australian federal election in Victoria</span>

This is a list of electoral division results for the Australian 1984 federal election in the state of Victoria.

References

  1. 1 2 3 4 "1987 House of Representatives: Victoria". Psephos Adam Carr's Election Archive. Retrieved 15 June 2022.
  2. "1987 House of Representatives". Psephos Adam Carr's Election Archive. Retrieved 10 June 2022.