This is a list of electoral results for the Division of Melbourne Ports in Australian federal elections from the division's creation in 1901 until its abolition in 2019. It was replaced by the division of Macnamara which had almost identical boundaries.
Member | Party | Term | |
---|---|---|---|
Samuel Mauger | Protectionist | 1901–1906 | |
James Mathews | Labor | 1906–1931 | |
Jack Holloway | Labor | 1931–1951 | |
Frank Crean | Labor | 1951–1977 | |
Clyde Holding | Labor | 1977–1998 | |
Michael Danby | Labor | 1998–2019 |
Party | Candidate | Votes | % | ±% | |
---|---|---|---|---|---|
Liberal | Owen Guest | 35,533 | 41.90 | +0.85 | |
Labor | Michael Danby | 22,897 | 27.00 | −4.67 | |
Greens | Steph Hodgins-May | 20,179 | 23.79 | +3.62 | |
Animal Justice | Robert Smyth | 1,685 | 1.99 | +1.99 | |
Independent | Peter Holland | 1,393 | 1.64 | +1.64 | |
Marriage Equality | Henry von Doussa | 1,349 | 1.59 | +1.59 | |
Drug Law Reform | Levi McKenzie-Kirkbright | 1,348 | 1.59 | +1.59 | |
Independent | John Myers | 425 | 0.50 | +0.50 | |
Total formal votes | 84,809 | 95.76 | −0.42 | ||
Informal votes | 3,756 | 4.24 | +0.42 | ||
Turnout | 88,565 | 86.59 | −3.45 | ||
Two-party-preferred result | |||||
Labor | Michael Danby | 43,573 | 51.38 | −2.18 | |
Liberal | Owen Guest | 41,236 | 48.62 | +2.18 | |
Labor hold | Swing | −2.18 |
Party | Candidate | Votes | % | ±% | |
---|---|---|---|---|---|
Liberal | Kevin Ekendahl | 33,278 | 41.05 | +3.66 | |
Labor | Michael Danby | 25,676 | 31.67 | −6.56 | |
Greens | Ann Birrell | 16,353 | 20.17 | −0.82 | |
Sex Party | Melissa Star | 3,089 | 3.81 | +1.59 | |
Palmer United | Toby Stodart | 1,122 | 1.38 | +1.38 | |
Democratic Labour | Vince Stefano | 540 | 0.67 | +0.67 | |
Family First | Robert Keenan | 490 | 0.60 | −0.14 | |
Stable Population | Steven Armstrong | 324 | 0.40 | +0.40 | |
Rise Up Australia | Margaret Quinn | 201 | 0.25 | +0.25 | |
Total formal votes | 81,073 | 96.18 | −0.59 | ||
Informal votes | 3,223 | 3.82 | +0.59 | ||
Turnout | 84,296 | 90.14 | +0.61 | ||
Two-party-preferred result | |||||
Labor | Michael Danby | 43,419 | 53.56 | −4.33 | |
Liberal | Kevin Ekendahl | 37,654 | 46.44 | +4.33 | |
Labor hold | Swing | −4.33 |
Party | Candidate | Votes | % | ±% | |
---|---|---|---|---|---|
Labor | Michael Danby | 32,391 | 38.19 | −4.28 | |
Liberal | Kevin Ekendahl | 32,057 | 37.79 | −1.89 | |
Greens | Sue Plowright | 17,528 | 20.66 | +5.63 | |
Sex Party | Christian Vega | 1,851 | 2.18 | +2.18 | |
Family First | Daniel Emmerson | 632 | 0.75 | −0.10 | |
Secular | Gregory Storer | 362 | 0.43 | +0.43 | |
Total formal votes | 84,821 | 96.75 | −1.09 | ||
Informal votes | 2,848 | 3.25 | +1.09 | ||
Turnout | 87,669 | 89.67 | −2.05 | ||
Two-party-preferred result | |||||
Labor | Michael Danby | 48,819 | 57.56 | +0.41 | |
Liberal | Kevin Ekendahl | 36,002 | 42.44 | −0.41 | |
Labor hold | Swing | +0.41 |
Party | Candidate | Votes | % | ±% | |
---|---|---|---|---|---|
Labor | Michael Danby | 36,556 | 42.47 | +3.22 | |
Liberal | Adam Held | 34,154 | 39.68 | -3.26 | |
Greens | Phillip Walker | 12,941 | 15.03 | +0.93 | |
Democrats | John Mathieson | 1,527 | 1.77 | +0.42 | |
Family First | Rebecca Gebbing | 731 | 0.85 | +0.31 | |
CEC | Aaron Isherwood | 172 | 0.20 | +0.02 | |
Total formal votes | 86,081 | 97.84 | +1.24 | ||
Informal votes | 1,903 | 2.16 | -1.24 | ||
Turnout | 87,984 | 91.71 | +0.58 | ||
Two-party-preferred result | |||||
Labor | Michael Danby | 49,191 | 57.15 | +3.41 | |
Liberal | Adam Held | 36,890 | 42.85 | -3.41 | |
Labor hold | Swing | +3.41 | |||
Party | Candidate | Votes | % | ±% | |
---|---|---|---|---|---|
Liberal | David Southwick | 35,058 | 42.94 | +3.23 | |
Labor | Michael Danby | 32,046 | 39.25 | -0.11 | |
Greens | Jo Lewis | 11,508 | 14.10 | +2.82 | |
Democrats | Craig Beale | 1,102 | 1.35 | -7.92 | |
Independent | Les Cameron | 958 | 1.17 | +1.17 | |
Family First | Graeme Jackel | 444 | 0.54 | +0.54 | |
Independent | Leonie Horin | 374 | 0.46 | +0.46 | |
CEC | Aaron Isherwood | 146 | 0.18 | -0.21 | |
Total formal votes | 81,636 | 96.60 | -0.14 | ||
Informal votes | 2,875 | 3.40 | +0.14 | ||
Turnout | 84,511 | 91.13 | -1.79 | ||
Two-party-preferred result | |||||
Labor | Michael Danby | 43,873 | 53.74 | -1.95 | |
Liberal | David Southwick | 37,763 | 46.26 | +1.95 | |
Labor hold | Swing | -1.95 | |||
Party | Candidate | Votes | % | ±% | |
---|---|---|---|---|---|
Liberal | Andrew McLorinan | 31,384 | 39.71 | +0.72 | |
Labor | Michael Danby | 31,110 | 39.36 | -4.74 | |
Greens | Jeannette Kavanagh | 8,912 | 11.28 | +6.55 | |
Democrats | Greg Chipp | 7,328 | 9.27 | +1.08 | |
CEC | Jeremy Beck | 305 | 0.39 | +0.39 | |
Total formal votes | 79,039 | 96.74 | -0.15 | ||
Informal votes | 2,662 | 3.26 | +0.15 | ||
Turnout | 81,701 | 92.32 | |||
Two-party-preferred result | |||||
Labor | Michael Danby | 44,018 | 55.69 | -0.14 | |
Liberal | Andrew McLorinan | 35,021 | 44.31 | +0.14 | |
Labor hold | Swing | -0.14 | |||
Party | Candidate | Votes | % | ±% | |
---|---|---|---|---|---|
Labor | Michael Danby | 32,849 | 44.10 | -2.47 | |
Liberal | Fiona Snedden | 29,037 | 38.99 | -0.74 | |
Democrats | Julie Peters | 6,099 | 8.19 | +1.10 | |
Greens | Dinesh Mathew | 3,523 | 4.73 | -0.43 | |
Unity | Diana Wolowski | 1,413 | 1.90 | +1.90 | |
One Nation | Arthur Hawley | 1,380 | 1.85 | +1.85 | |
Natural Law | Tom Haynes | 180 | 0.24 | -0.25 | |
Total formal votes | 74,481 | 96.89 | -0.35 | ||
Informal votes | 2,390 | 3.11 | +0.35 | ||
Turnout | 76,871 | 92.34 | -1.10 | ||
Two-party-preferred result | |||||
Labor | Michael Danby | 41,585 | 55.83 | -0.22 | |
Liberal | Fiona Snedden | 32,896 | 44.17 | +0.22 | |
Labor hold | Swing | -0.22 | |||
Party | Candidate | Votes | % | ±% | |
---|---|---|---|---|---|
Labor | Clyde Holding | 33,838 | 46.58 | -2.08 | |
Liberal | Margot Foster | 28,863 | 39.73 | -2.02 | |
Democrats | John Davey | 5,147 | 7.08 | +3.42 | |
Greens | Misha Coleman | 3,746 | 5.16 | +5.16 | |
AAFI | Margaret Gillespie-Jones | 700 | 0.96 | +0.96 | |
Natural Law | Robert Brown | 357 | 0.49 | -0.46 | |
Total formal votes | 72,651 | 97.24 | +0.16 | ||
Informal votes | 2,065 | 2.76 | -0.16 | ||
Turnout | 74,716 | 93.44 | -0.22 | ||
Two-party-preferred result | |||||
Labor | Clyde Holding | 40,399 | 56.05 | +0.20 | |
Liberal | Margot Foster | 31,679 | 43.95 | -0.20 | |
Labor hold | Swing | +0.20 | |||
Party | Candidate | Votes | % | ±% | |
---|---|---|---|---|---|
Labor | Clyde Holding | 34,751 | 48.65 | +9.10 | |
Liberal | Helen Friedmann | 29,817 | 41.74 | -1.86 | |
Democrats | Beverley Broadbent | 2,614 | 3.66 | -11.85 | |
Independent | Andrew Colbert | 2,291 | 3.21 | +3.21 | |
Christine Craik | 1,276 | 1.79 | +1.79 | ||
Natural Law | Caroline Hockley | 678 | 0.95 | +0.95 | |
Total formal votes | 71,427 | 97.07 | +0.55 | ||
Informal votes | 2,153 | 2.93 | -0.55 | ||
Turnout | 73,580 | 93.66 | |||
Two-party-preferred result | |||||
Labor | Clyde Holding | 39,862 | 55.85 | +3.80 | |
Liberal | Helen Friedmann | 31,513 | 44.15 | -3.80 | |
Labor hold | Swing | +3.80 | |||
Party | Candidate | Votes | % | ±% | |
---|---|---|---|---|---|
Liberal | Allan Paull | 29,032 | 43.6 | +2.9 | |
Labor | Clyde Holding | 26,335 | 39.6 | -4.5 | |
Democrats | David Collyer | 10,327 | 15.5 | +6.2 | |
Democratic Socialist | Greg Loats | 886 | 1.3 | +1.3 | |
Total formal votes | 66,580 | 96.5 | |||
Informal votes | 2,399 | 3.5 | |||
Turnout | 68,979 | 93.6 | |||
Two-party-preferred result | |||||
Labor | Clyde Holding | 34,594 | 52.1 | -1.8 | |
Liberal | Allan Paull | 31,872 | 47.9 | +1.8 | |
Labor hold | Swing | -1.8 | |||
Party | Candidate | Votes | % | ±% | |
---|---|---|---|---|---|
Labor | Clyde Holding | 29,831 | 50.1 | -7.0 | |
Liberal | Allan Paull | 20,683 | 34.7 | +3.9 | |
Democrats | Di Bretherton | 5,568 | 9.3 | +3.5 | |
Independent | Alan Brown | 3,483 | 5.9 | +5.9 | |
Total formal votes | 59,565 | 93.6 | |||
Informal votes | 4,039 | 6.4 | |||
Turnout | 63,604 | 87.9 | |||
Two-party-preferred result | |||||
Labor | Clyde Holding | 35,643 | 59.9 | -4.3 | |
Liberal | Allan Paull | 23,831 | 40.1 | +4.3 | |
Labor hold | Swing | -4.3 | |||
Party | Candidate | Votes | % | ±% | |
---|---|---|---|---|---|
Labor | Clyde Holding | 32,665 | 57.1 | -3.6 | |
Liberal | Allan Paull | 17,603 | 30.8 | -1.7 | |
Democrats | Sue McDougall | 3,312 | 5.8 | +0.0 | |
Democratic Labor | Michael Rowe | 1,825 | 3.2 | +3.2 | |
Independent | Denice Stephens | 845 | 1.5 | +1.5 | |
National | Dorothy Turner | 795 | 1.4 | +1.4 | |
Independent | Russell Morse | 159 | 0.3 | +0.3 | |
Total formal votes | 57,204 | 88.1 | |||
Informal votes | 7,728 | 11.9 | |||
Turnout | 64,932 | 90.6 | |||
Two-party-preferred result | |||||
Labor | Clyde Holding | 36,690 | 64.2 | +1.1 | |
Liberal | Allan Paull | 20,427 | 35.8 | -1.1 | |
Labor hold | Swing | +1.1 | |||
Party | Candidate | Votes | % | ±% | |
---|---|---|---|---|---|
Labor | Clyde Holding | 36,444 | 59.7 | +2.7 | |
Liberal | Ronald Flood | 20,488 | 33.5 | -0.4 | |
Democrats | John Sutcliffe | 3,556 | 5.8 | -1.5 | |
Socialist Workers | Brett Trenery | 595 | 1.0 | +1.0 | |
Total formal votes | 61,083 | 97.3 | |||
Informal votes | 1,688 | 2.7 | |||
Turnout | 62,751 | 91.6 | |||
Two-party-preferred result | |||||
Labor | Clyde Holding | 64.1 | +1.8 | ||
Liberal | Ronald Flood | 35.9 | -1.8 | ||
Labor hold | Swing | +1.8 | |||
Party | Candidate | Votes | % | ±% | |
---|---|---|---|---|---|
Labor | Clyde Holding | 33,992 | 57.0 | +7.0 | |
Liberal | Colin Bell | 20,252 | 33.9 | +0.9 | |
Democrats | Stephen Duthy | 4,336 | 7.3 | -2.5 | |
Independent | Gordon Moffatt | 806 | 1.4 | +1.4 | |
Independent | Wilhelm Kapphan | 270 | 0.5 | +0.5 | |
Total formal votes | 59,656 | 96.2 | |||
Informal votes | 2,373 | 3.8 | |||
Turnout | 62,029 | 89.5 | |||
Two-party-preferred result | |||||
Labor | Clyde Holding | 62.3 | +6.8 | ||
Liberal | Colin Bell | 37.7 | -6.8 | ||
Labor hold | Swing | +6.8 | |||
Party | Candidate | Votes | % | ±% | |
---|---|---|---|---|---|
Labor | Clyde Holding | 31,308 | 50.0 | -5.5 | |
Liberal | Daniel Hill | 20,627 | 33.0 | -5.0 | |
Democrats | Valina Rainer | 6,147 | 9.8 | +9.8 | |
Democratic Labor | Gordon Haberman | 4,495 | 7.2 | +4.5 | |
Total formal votes | 62,577 | 96.1 | |||
Informal votes | 2,567 | 3.9 | |||
Turnout | 65,144 | 90.9 | |||
Two-party-preferred result | |||||
Labor | Clyde Holding | 55.5 | -2.8 | ||
Liberal | Daniel Hill | 44.5 | +2.8 | ||
Labor hold | Swing | -2.8 | |||
Party | Candidate | Votes | % | ±% | |
---|---|---|---|---|---|
Labor | Frank Crean | 28,460 | 55.5 | -4.9 | |
Liberal | Roger Johnston | 19,485 | 38.0 | +7.4 | |
Australia | Beverley Broadbent | 1,641 | 3.2 | -1.5 | |
Democratic Labor | Gordon Haberman | 1,369 | 2.7 | -1.6 | |
National Country | Frederick Gray | 168 | 0.3 | +0.3 | |
Independent | Henry Sanders | 154 | 0.3 | +0.3 | |
Total formal votes | 51,277 | 97.1 | |||
Informal votes | 1,553 | 2.9 | |||
Turnout | 52,830 | 91.1 | |||
Two-party-preferred result | |||||
Labor | Frank Crean | 58.3 | -5.8 | ||
Liberal | Roger Johnston | 41.7 | +5.8 | ||
Labor hold | Swing | -5.8 | |||
Party | Candidate | Votes | % | ±% | |
---|---|---|---|---|---|
Labor | Frank Crean | 31,120 | 60.4 | -1.1 | |
Liberal | John Walsh | 15,733 | 30.6 | +0.1 | |
Australia | Beverley Broadbent | 2,429 | 4.7 | +4.7 | |
Democratic Labor | John Johnston | 2,211 | 4.3 | -3.7 | |
Total formal votes | 51,493 | 97.1 | |||
Informal votes | 1,556 | 2.9 | |||
Turnout | 53,049 | 92.3 | |||
Two-party-preferred result | |||||
Labor | Frank Crean | 64.1 | +1.8 | ||
Liberal | John Walsh | 35.9 | -1.8 | ||
Labor hold | Swing | +1.8 | |||
Party | Candidate | Votes | % | ±% | |
---|---|---|---|---|---|
Labor | Frank Crean | 29,631 | 61.5 | +9.5 | |
Liberal | Paul Fenton | 14,722 | 30.5 | -2.4 | |
Democratic Labor | John Johnston | 3,845 | 8.0 | -0.1 | |
Total formal votes | 48,198 | 97.0 | |||
Informal votes | 1,476 | 3.0 | |||
Turnout | 49,674 | 91.3 | |||
Two-party-preferred result | |||||
Labor | Frank Crean | 62.3 | +6.0 | ||
Liberal | Paul Fenton | 37.7 | -6.0 | ||
Labor hold | Swing | +6.0 | |||
Party | Candidate | Votes | % | ±% | |
---|---|---|---|---|---|
Labor | Frank Crean | 25,209 | 52.0 | +12.3 | |
Liberal | Kevin Randall | 15,923 | 32.9 | -7.6 | |
Democratic Labor | Eustace Tracey | 3,944 | 8.1 | -3.4 | |
Independent | Reg Macey | 1,580 | 3.3 | +3.3 | |
Independent | Stephen Graves | 1,447 | 3.0 | +3.0 | |
Independent | George Gabriel | 352 | 0.7 | +0.7 | |
Total formal votes | 48,455 | 94.6 | |||
Informal votes | 2,745 | 5.4 | |||
Turnout | 51,200 | 91.4 | |||
Two-party-preferred result | |||||
Labor | Frank Crean | 56.3 | +8.0 | ||
Liberal | Kevin Randall | 43.7 | -8.0 | ||
Labor gain from Liberal | Swing | +8.0 |
Party | Candidate | Votes | % | ±% | |
---|---|---|---|---|---|
Labor | Frank Crean | 16,003 | 55.5 | -8.0 | |
Liberal | Richard Thomas | 7,123 | 24.7 | +2.6 | |
Democratic Labor | George O'Dwyer | 3,304 | 11.5 | -1.0 | |
Communist | David Clark | 2,402 | 8.3 | +6.4 | |
Total formal votes | 28,832 | 94.9 | |||
Informal votes | 1,543 | 5.1 | |||
Turnout | 30,375 | 94.2 | |||
Two-party-preferred result | |||||
Labor | Frank Crean | 64.1 | -2.4 | ||
Liberal | Richard Thomas | 35.9 | +2.4 | ||
Labor hold | Swing | -2.4 | |||
Party | Candidate | Votes | % | ±% | |
---|---|---|---|---|---|
Labor | Frank Crean | 20,654 | 63.5 | +1.8 | |
Liberal | James Pond | 7,178 | 22.1 | -0.3 | |
Democratic Labor | George O'Dwyer | 4,074 | 12.5 | -1.2 | |
Communist | Roger Wilson | 632 | 1.9 | -0.3 | |
Total formal votes | 32,538 | 97.7 | |||
Informal votes | 781 | 2.3 | |||
Turnout | 33,319 | 95.1 | |||
Two-party-preferred result | |||||
Labor | Frank Crean | 66.5 | +1.4 | ||
Liberal | James Pond | 33.5 | -1.4 | ||
Labor hold | Swing | +1.4 | |||
Party | Candidate | Votes | % | ±% | |
---|---|---|---|---|---|
Labor | Frank Crean | 20,590 | 61.7 | -1.9 | |
Liberal | Gordon Blackburne | 7,483 | 22.4 | +2.0 | |
Democratic Labor | Albert Jones | 4,572 | 13.7 | -0.1 | |
Communist | Roger Wilson | 749 | 2.2 | -0.1 | |
Total formal votes | 33,394 | 96.5 | |||
Informal votes | 1,201 | 3.5 | |||
Turnout | 34,595 | 93.7 | |||
Two-party-preferred result | |||||
Labor | Frank Crean | 65.1 | -2.1 | ||
Liberal | Gordon Blackburne | 34.9 | +2.1 | ||
Labor hold | Swing | -2.1 | |||
Party | Candidate | Votes | % | ±% | |
---|---|---|---|---|---|
Labor | Frank Crean | 22,968 | 63.6 | +11.6 | |
Liberal | Norman Loader | 7,381 | 20.4 | +0.7 | |
Democratic Labor | John Fitzgerald | 4,969 | 13.8 | -11.4 | |
Communist | Roger Wilson | 813 | 2.3 | -0.8 | |
Total formal votes | 36,131 | 96.4 | |||
Informal votes | 1,362 | 3.6 | |||
Turnout | 37,493 | 95.0 | |||
Two-party-preferred result | |||||
Labor | Frank Crean | 67.2 | +10.4 | ||
Liberal | Norman Loader | 32.8 | +32.8 | ||
Labor hold | Swing | +10.4 | |||
Party | Candidate | Votes | % | ±% | |
---|---|---|---|---|---|
Labor | Frank Crean | 19,917 | 52.0 | -14.7 | |
Labor (A-C) | Stan Corrigan | 9,662 | 25.2 | +25.2 | |
Liberal | Harold Sher | 7,531 | 19.7 | -7.8 | |
Communist | Alex Dobbin | 1,193 | 3.1 | -2.7 | |
Total formal votes | 38,303 | 95.9 | |||
Informal votes | 1,645 | 4.1 | |||
Turnout | 39,948 | 93.9 | |||
Two-party-preferred result | |||||
Labor | Frank Crean | 56.8 | -15.0 | ||
Labor (A-C) | Stan Corrigan | 43.2 | +43.2 | ||
Labor hold | Swing | -15.0 | |||
Party | Candidate | Votes | % | ±% | |
---|---|---|---|---|---|
Labor | Frank Crean | 22,001 | 67.4 | -3.8 | |
Liberal | Norman Fittock | 8,914 | 27.3 | -1.5 | |
Communist | Ted Bull | 1,733 | 5.3 | +5.3 | |
Total formal votes | 32,648 | 98.0 | |||
Informal votes | 677 | 2.0 | |||
Turnout | 33,325 | 95.2 | |||
Two-party-preferred result | |||||
Labor | Frank Crean | 72.3 | +1.1 | ||
Liberal | Norman Fittock | 27.7 | -1.1 | ||
Labor hold | Swing | +1.1 | |||
Party | Candidate | Votes | % | ±% | |
---|---|---|---|---|---|
Labor | Frank Crean | 26,502 | 71.2 | +3.3 | |
Liberal | Michael Prowse | 10,740 | 28.8 | -3.3 | |
Total formal votes | 37,242 | 97.8 | |||
Informal votes | 839 | 2.2 | |||
Turnout | 38,081 | 94.9 | |||
Labor hold | Swing | +3.3 | |||
Party | Candidate | Votes | % | ±% | |
---|---|---|---|---|---|
Labor | Jack Holloway | 26,792 | 67.9 | -2.5 | |
Liberal | Frank Block | 12,690 | 32.1 | +2.5 | |
Total formal votes | 39,482 | 97.2 | |||
Informal votes | 1,137 | 2.8 | |||
Turnout | 40,619 | 94.6 | |||
Labor hold | Swing | -2.5 | |||
Party | Candidate | Votes | % | ±% | |
---|---|---|---|---|---|
Labor | Jack Holloway | 43,905 | 66.7 | -6.1 | |
Liberal | Douglas Dennis | 21,884 | 33.3 | +6.1 | |
Total formal votes | 65,789 | 97.5 | |||
Informal votes | 1,705 | 2.5 | |||
Turnout | 67,494 | 92.2 | |||
Labor hold | Swing | -6.1 | |||
Party | Candidate | Votes | % | ±% | |
---|---|---|---|---|---|
Labor | Jack Holloway | 47,149 | 72.8 | +6.7 | |
United Australia | Frank Preacher | 17,629 | 27.2 | -6.7 | |
Total formal votes | 64,778 | 97.6 | |||
Informal votes | 1,612 | 2.4 | |||
Turnout | 66,390 | 95.7 | |||
Labor hold | Swing | +6.7 | |||
Party | Candidate | Votes | % | ±% | |
---|---|---|---|---|---|
Labor | Jack Holloway | 38,853 | 66.1 | -33.9 | |
United Australia | Raymond Trickey | 19,907 | 33.9 | +33.9 | |
Total formal votes | 58,760 | 97.6 | |||
Informal votes | 1,428 | 2.4 | |||
Total votes | 60,188 | 94.7 | |||
Labor hold | Swing | -33.9 | |||
Party | Candidate | Votes | % | ±% | |
---|---|---|---|---|---|
Labor | Jack Holloway | unopposed | |||
Labor hold | Swing | ||||
Party | Candidate | Votes | % | ±% | |
---|---|---|---|---|---|
Labor | Jack Holloway | 27,081 | 62.8 | -6.4 | |
United Australia | James Laurence | 12,173 | 28.2 | -2.1 | |
Socialist | William Clarke | 3,872 | 9.0 | +9.0 | |
Total formal votes | 43,126 | 95.7 | |||
Informal votes | 1,941 | 4.3 | |||
Turnout | 45,067 | 93.2 | |||
Two-party-preferred result | |||||
Labor | Jack Holloway | 70.9 | +10.6 | ||
United Australia | James Laurence | 29.1 | -10.6 | ||
Labor hold | Swing | +10.6 | |||
Party | Candidate | Votes | % | ±% | |
---|---|---|---|---|---|
Labor | Jack Holloway | 22,901 | 56.4 | -43.6 | |
United Australia | William Orr | 12,319 | 30.3 | +30.3 | |
Independent UAP | William Howey | 3,945 | 9.7 | +9.7 | |
Communist | Thomas le Huray | 823 | 2.0 | +2.0 | |
Lang Labor | Thomas Houston | 448 | 1.1 | +1.1 | |
Independent | Noble Kerby | 154 | 0.4 | +0.4 | |
Total formal votes | 40,590 | 94.3 | |||
Informal votes | 2,445 | 5.7 | |||
Turnout | 43,035 | 95.2 | |||
Two-party-preferred result | |||||
Labor | Jack Holloway | 60.3 | -39.7 | ||
United Australia | William Orr | 39.7 | +39.7 | ||
Labor hold | Swing | -39.7 | |||
Party | Candidate | Votes | % | ±% | |
---|---|---|---|---|---|
Labor | James Mathews | unopposed | |||
Labor hold | Swing | ||||
Party | Candidate | Votes | % | ±% | |
---|---|---|---|---|---|
Labor | James Mathews | unopposed | |||
Labor hold | Swing | ||||
Party | Candidate | Votes | % | ±% | |
---|---|---|---|---|---|
Labor | James Mathews | 29,416 | 67.7 | -5.4 | |
Nationalist | Frank Wilcher | 14,035 | 32.3 | +5.4 | |
Total formal votes | 43,451 | 98.2 | |||
Informal votes | 792 | 1.8 | |||
Turnout | 44,243 | 89.7 | |||
Labor hold | Swing | -5.4 | |||
Party | Candidate | Votes | % | ±% | |
---|---|---|---|---|---|
Labor | James Mathews | 17,628 | 73.1 | -26.9 | |
Nationalist | Selwyn Neale | 6,485 | 26.9 | +26.9 | |
Total formal votes | 24,113 | 97.0 | |||
Informal votes | 745 | 3.0 | |||
Turnout | 24,858 | 54.1 | |||
Labor hold | Swing | -26.9 | |||
Party | Candidate | Votes | % | ±% | |
---|---|---|---|---|---|
Labor | James Mathews | unopposed | |||
Labor hold | Swing | ||||
Party | Candidate | Votes | % | ±% | |
---|---|---|---|---|---|
Labor | James Mathews | 22,689 | 66.3 | -33.7 | |
Nationalist | William Fozard | 11,557 | 33.7 | +33.7 | |
Total formal votes | 34,246 | 97.7 | |||
Informal votes | 801 | 2.3 | |||
Turnout | 35,047 | 80.5 | |||
Labor hold | Swing | -33.7 | |||
Party | Candidate | Votes | % | ±% | |
---|---|---|---|---|---|
Labor | James Mathews | unopposed | |||
Labor hold | Swing | ||||
Party | Candidate | Votes | % | ±% | |
---|---|---|---|---|---|
Labor | James Mathews | 24,203 | 79.2 | +10.6 | |
Liberal | Charles Merrett | 6,357 | 20.8 | -10.6 | |
Total formal votes | 30,560 | 97.9 | |||
Informal votes | 659 | 2.1 | |||
Turnout | 31,219 | 75.0 | |||
Labor hold | Swing | +10.6 | |||
Party | Candidate | Votes | % | ±% | |
---|---|---|---|---|---|
Labour | James Mathews | 15,055 | 69.6 | +29.0 | |
Liberal | Alexander Ramsay | 6,583 | 30.4 | -5.0 | |
Total formal votes | 21,638 | 98.3 | |||
Informal votes | 368 | 1.7 | |||
Turnout | 22,006 | 65.4 | |||
Labour hold | Swing | +17.0 | |||
Party | Candidate | Votes | % | ±% | |
---|---|---|---|---|---|
Labour | James Mathews | 6,813 | 40.6 | -1.3 | |
Protectionist | Edward Watts | 5,932 | 35.4 | -20.1 | |
Independent Labour | James Ronald | 3,215 | 19.2 | +19.2 | |
Ind. Anti-Socialist | Cyril James | 802 | 4.8 | +4.8 | |
Total formal votes | 16,762 | 95.9 | |||
Informal votes | 714 | 4.1 | |||
Turnout | 17,476 | 55.9 | |||
Labour gain from Protectionist | Swing | +9.4 |
Party | Candidate | Votes | % | ±% | |
---|---|---|---|---|---|
Protectionist | Samuel Mauger | 9,646 | 55.5 | -44.5 | |
Labour | James Mathews | 7,290 | 41.9 | +41.9 | |
Independent Labour | Harry Foran | 443 | 2.5 | +2.5 | |
Total formal votes | 17,379 | 97.8 | |||
Informal votes | 386 | 2.2 | |||
Turnout | 17,765 | 55.7 | |||
Protectionist hold | Swing | -44.5 | |||
Party | Candidate | Votes | % | ±% | |
---|---|---|---|---|---|
Protectionist | Samuel Mauger | unopposed | |||
Protectionist win | (new seat) | ||||
The Australian Electoral Commission (AEC) is the independent federal agency in charge of organising, conducting and supervising federal Australian elections, by-elections and referendums.
The Division of Batman was an Australian Electoral Division in the state of Victoria. It took its name from John Batman, one of the founders of the city of Melbourne. The division was created in 1906, replacing the Division of Northern Melbourne, and was abolished in 2019 and replaced by the Division of Cooper.
The Division of Melbourne is an Australian electoral division in the State of Victoria, represented since the 2010 election by Adam Bandt, leader of the Australian Greens.
The Division of Port Adelaide was an Australian electoral division in the state of South Australia. The 181 km² seat extended from St Kilda in the north to Grange Road and Findon in the south with part of Salisbury to the east. Suburbs included Alberton, Beverley, Birkenhead, Cheltenham, Findon, Kilkenny, Largs Bay, Mansfield Park, North Haven, Ottoway, Parafield Gardens, Paralowie, Pennington, Port Adelaide, Queenstown, Rosewater, Salisbury Downs, Semaphore, Woodville, West Croydon, and part of Seaton. The seat also included Torrens Island and Garden Island. Port Adelaide was abolished in 2019, after a redistribution triggered by a change in representation entitlement which saw South Australia's seats in the House of Representatives reduced to ten.
In Australia, a redistribution is the process of redrawing the boundaries of electoral divisions for the House of Representatives arising from changes in population and changes in the number of representatives. There is no redistribution for the Senate as each State constitutes a division, though with multiple members. The Australian Electoral Commission (AEC), an independent statutory authority, oversees the apportionment and redistribution process for federal divisions, taking into account a number of factors. Politicians, political parties and the public may make submissions to the AEC on proposed new boundaries, but any interference with their deliberations is considered a serious offence.
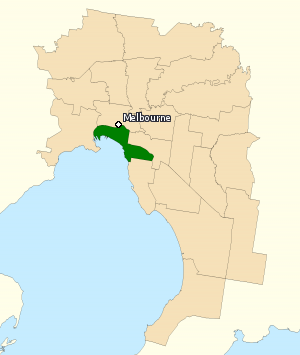
The Division of Melbourne Ports was an Australian federal electoral division in the inner south-eastern suburbs of Melbourne, Victoria, Australia. It was located to the south of Melbourne's central business district and covered an area of approximately 40 km2 around the north and north-eastern shores of Port Phillip Bay.
This is a list of electoral results for the Division of Banks in Australian federal elections from the division's creation in 1949 until the present.
This is a list of electoral results for the Division of Batman in Australian federal elections from the division's creation in 1906 until its abolition in 2019.
This is a list of electoral results for the Division of Melbourne in Australian federal elections from the division's creation in 1901 until the present.
This is a list of electoral results for the Division of Port Adelaide in Australian federal elections from the division's creation in 1949 until its abolition in 2019.
}} This is a list of electoral division results for the Australian 2013 federal election in the state of Victoria.
The Australian Equality Party (Marriage) was an Australian political party founded by Jason Tuazon-McCheyne. The AEP had a platform that promoted equality and human rights, particularly in relation to the gay, lesbian, bisexual, transgender, intersex and queer (GLBTIQ) community. The party's goal was to get AEP Leader, Jason Tuazon-McCheyne, elected to the Senate at the 2016 Federal Election. The party was deregistered voluntarily on 26 March 2018.
This is a list of electoral division results for the 2016 Australian federal election in the state of Victoria.
The Division of Macnamara is an Australian Electoral Division in the state of Victoria, which was contested for the first time at the 2019 federal election. The division is named in honour of Dame Jean Macnamara, a medical researcher and doctor who specialised in the polio virus and was involved in children's health initiatives.
The Division of Fraser is an Australian electoral division in the state of Victoria, which was contested for the first time at the 2019 federal election.
This is a list of electoral results for the Division of Macnamara in Australian federal elections from the division's creation in 2019 until the present.
This is a list of electoral division results for the 2019 Australian federal election in the state of Victoria. Victoria bucked the national trend, seeing a swing from the Coalition to Labor, whereas the swing across Australia was from Labor to the Coalition.
Joshua Solomon Burns is an Australian politician. Representing the Australian Labor Party, he was elected as the member for the division of Macnamara in Melbourne at the 2019 Australian federal election.
Steph Hodgins-May is a Greenpeace activist and a candidate for the Australian Greens in multiple federal elections.