Electoral results for the Division of Calwell

Last updated

This is a list of electoral results for the Division of Calwell in Australian federal elections from the division's creation in 1984 until the present.

Contents

Members

MemberPartyTerm
  Andrew Theophanous Labor 1984–2000
  Independent 2000–2001
  Maria Vamvakinou Labor 2001–present

Election results

Elections in the 2020s

2022

2022 Australian federal election: Calwell [1]
PartyCandidateVotes%±%
Labor Maria Vamvakinou 33,75245.17−9.26
Liberal Tim Staker-Gunn17,77023.78−0.51
Greens Natalie Abboud6,9269.27+2.54
United Australia Joshua Naim6,5828.81+5.34
One Nation Mark Preston5,1356.87+6.87
Victorian Socialists Jerome Small3,2374.33−0.45
Australian Federation Maria Bengtsson1,3191.77+1.77
Total formal votes74,72194.34+3.68
Informal votes4,4845.66−3.68
Turnout 79,20574.17
Labor Maria Vamvakinou 45,27061.98−7.64
Liberal Tim Staker-Gunn27,77438.02+7.64
Labor hold Swing −7.64
Results are not final. Last updated on 27 May 2022 at 11:00 pm AEST.

Elections in the 2010s

2019

2019 Australian federal election: Calwell [2]
PartyCandidateVotes%±%
Labor Maria Vamvakinou 47,11553.88−4.80
Liberal Genevieve Hamilton21,97825.13−0.52
Greens Polly Morgan5,8936.74−1.27
Victorian Socialists Jerome Small3,9844.56+4.56
United Australia Prakul Chhabra3,0373.47+3.47
CEC Keith Kerr2,8513.26+3.26
Conservative National Adam Vail1,7712.03+2.03
Socialist Equality Peter Byrne8230.94+0.94
Total formal votes87,45290.78−2.34
Informal votes8,8849.22+2.34
Turnout 96,33689.61+4.25
Labor Maria Vamvakinou 60,16468.80−0.93
Liberal Genevieve Hamilton27,28831.20+0.93
Labor hold Swing −0.93

2016

2016 Australian federal election: Calwell [3]
PartyCandidateVotes%±%
Labor Maria Vamvakinou 51,04056.81+7.00
Liberal John Hsu (disendorsed) [1] 24,85527.66−0.83
Greens Natalie Abboud7,6098.47+3.08
Animal Justice Megan Searls3,2293.59+3.59
Independent Michael Lakkis3,1153.47+3.47
Total formal votes89,84893.46+1.38
Informal votes6,2866.54−1.38
Turnout 96,13487.87−3.06
Labor Maria Vamvakinou 60,97867.87+4.01
Liberal John Hsu28,87032.13−4.01
Labor hold Swing +4.01

Notes

1 The Liberal candidate John Hsu resigned from the party's ticket in June 2016. However, due to the AEC's nomination deadlines, Mr Hsu's name still appeared under the Liberal Party ticket on the ballot paper.

2013

2013 Australian federal election: Calwell [4]
PartyCandidateVotes%±%
Labor Maria Vamvakinou 42,81949.81−7.80
Liberal Ali Khan24,49028.49+2.97
Greens Joanna Nevill4,6325.39−5.80
Palmer United Bryce Letcher3,7284.34+4.34
Sex Party Nevena Spirovska2,3672.75+2.75
Family First Paul Graham2,1752.53−2.15
Christians Maria Bengtsson2,1212.47+2.47
Katter's Australian Brett Watson1,9152.23+2.23
Democratic Labour Omar Jabir1,3101.52+1.52
Rise Up Australia Charles Rozario4150.48+0.48
Total formal votes85,97292.08−0.91
Informal votes7,3987.92+0.91
Turnout 93,37090.93−1.23
Labor Maria Vamvakinou 54,90663.86−6.20
Liberal Ali Khan31,06636.14+6.20
Labor hold Swing −6.20

2010

2010 Australian federal election: Calwell [5]
PartyCandidateVotes%±%
Labor Maria Vamvakinou 49,58056.63−3.59
Liberal Wayne Tseng22,55625.76−0.79
Greens Lenka Thompson10,38611.86+7.50
Family First Jeff Truscott3,8514.40+0.06
Socialist Equality Peter Byrne1,1811.35+1.03
Total formal votes87,55493.47−1.68
Informal votes6,1146.53+1.68
Turnout 93,66892.45−2.39
Labor Maria Vamvakinou 61,04569.72+0.39
Liberal Wayne Tseng26,50930.28−0.39
Labor hold Swing +0.39

Elections in the 2000s

2007

2007 Australian federal election: Calwell
PartyCandidateVotes%±%
Labor Maria Vamvakinou 51,95260.22+10.21
Liberal Dianne Livett22,90626.55−10.62
Greens Brook Shaune3,7614.36−0.90
Family First Arthur Buller3,7474.34+1.98
CEC Sleiman Yohanna1,8172.11−0.09
Democrats Vanessa Musolino7990.93−0.56
Independent Philip Cutler6240.72+0.72
Independent Don Hampshire3910.45+0.45
Socialist Equality Frank Gaglioti2730.32+0.32
Total formal votes86,27095.15+0.39
Informal votes4,3994.85−0.39
Turnout 90,66994.82−0.53
Two-party-preferred result
Labor Maria Vamvakinou 59,80769.33+11.14
Liberal Dianne Livett26,46330.67−11.14
Labor hold Swing +11.14

2004

2004 Australian federal election: Calwell
PartyCandidateVotes%±%
Labor Maria Vamvakinou 39,69250.01−2.31
Liberal Dianne Livett29,50437.17+8.60
Greens Mohamad Alman4,1755.26+1.91
Family First Gary Canham1,8702.36+2.36
CEC Sleiman Yohanna1,7452.20+1.72
Independent Denis Towers1,2021.51+1.51
Democrats Jonathon Gatt1,1801.49−2.91
Total formal votes79,36894.76+0.33
Informal votes4,3915.24−0.33
Turnout 83,75995.35+0.73
Two-party-preferred result
Labor Maria Vamvakinou 46,18458.19−7.04
Liberal Dianne Livett33,18441.81+7.04
Labor hold Swing −7.04

2001

2001 Australian federal election: Calwell
PartyCandidateVotes%±%
Labor Maria Vamvakinou 45,20351.85−10.50
Liberal Darren Buller22,02025.26−1.06
Independent Andrew Theophanous 8,3929.63+9.63
Democrats Robert Livesay3,3563.85−2.84
No GST John Abbotto3,0743.53+3.53
Greens Bee Barker2,1052.41+2.41
Independent D. Dervish2,0032.30+2.30
Mohamed Bochi5550.64+0.64
CEC Sleiman Yohanna4650.53+0.53
Total formal votes87,17393.56−3.00
Informal votes6,0056.44+3.00
Turnout 93,17895.28+0.73
Two-party-preferred result
Labor Maria Vamvakinou 59,04467.73−1.25
Liberal Darren Buller28,12932.27+1.25
Labor hold Swing −1.25

Elections in the 1990s

1998

1998 Australian federal election: Calwell
PartyCandidateVotes%±%
Labor Andrew Theophanous 50,02262.36+1.02
Liberal Trevor Blake21,11126.32−2.52
Democrats Robert Livesay5,3636.69−0.25
Unity Benal Keceli2,9683.70+3.70
Natural Law Michael Harris7550.94+0.21
Total formal votes80,21996.55+0.31
Informal votes2,8643.45−0.31
Turnout 83,08395.15−0.48
Two-party-preferred result
Labor Andrew Theophanous 55,33468.98+1.78
Liberal Trevor Blake24,88531.02−1.78
Labor hold Swing +1.78

1996

1996 Australian federal election: Calwell
PartyCandidateVotes%±%
Labor Andrew Theophanous 43,98661.33−1.55
Liberal Bill Willis20,67928.83−0.83
Democrats Robert Livesay4,9756.94+4.04
Sue Phillips1,5542.17+2.17
Natural Law Richard Barnes5220.73+0.13
Total formal votes71,71696.24−0.23
Informal votes2,8003.76+0.23
Turnout 74,51695.63−0.46
Two-party-preferred result
Labor Andrew Theophanous 48,06767.19+0.08
Liberal Bill Willis23,46732.81−0.08
Labor hold Swing +0.08

1993

1993 Australian federal election: Calwell
PartyCandidateVotes%±%
Labor Andrew Theophanous 48,74964.53+19.01
Liberal Dianne Livett21,75228.79−4.01
Democrats David Mackay2,1402.83−9.20
Independent Veronica Rodenburg1,3731.82+1.82
AAFI Rod Spencer1,0131.34+1.34
Natural Law Sandy Price5220.69+0.69
Total formal votes75,54996.26+1.82
Informal votes2,9363.74−1.82
Turnout 78,48596.09
Two-party-preferred result
Labor Andrew Theophanous 51,67268.44+11.37
Liberal Dianne Livett23,83131.56−11.37
Labor hold Swing +11.37

1990

1990 Australian federal election: Calwell
PartyCandidateVotes%±%
Labor Andrew Theophanous 29,46645.5−12.6
Liberal Dianne Livett21,23232.8+2.7
Democrats Doug Lorman7,79112.0+2.1
Independent Jack Culpin 4,4936.9+6.9
Call to Australia Rob Lukanic1,7512.7+2.7
Total formal votes64,73394.4
Informal votes3,8155.6
Turnout 68,54895.2
Two-party-preferred result
Labor Andrew Theophanous 36,87557.1−8.5
Liberal Dianne Livett27,74442.9+8.5
Labor hold Swing −8.5

Elections in the 1980s

1987

1987 Australian federal election: Calwell
PartyCandidateVotes%±%
Labor Andrew Theophanous 36,61461.1−7.7
Liberal Chris Dimitrijevic16,24427.1+2.2
Democrats Louise Stewart5,9389.9+5.2
National Ivan Pavlekovich-Smith1,1301.9+1.9
Total formal votes59,92690.1
Informal votes6,5559.9
Turnout 66,48196.0
Two-party-preferred result
Labor Andrew Theophanous 41,07768.6−3.6
Liberal Chris Dimitrijevic18,80731.4+3.6
Labor hold Swing −3.6

1984

1984 Australian federal election: Calwell
PartyCandidateVotes%±%
Labor Andrew Theophanous 36,66068.8+0.6
Liberal Graham Andersen13,27724.9+0.1
Democrats Lesley Ellen2,5024.7+0.0
Democratic Labor Martin Mulholland8701.6+1.6
Total formal votes53,30987.0
Informal votes7,97913.0
Turnout 61,28895.4
Two-party-preferred result
Labor Andrew Theophanous 38,47472.2+0.0
Liberal Graham Andersen14,83027.8−0.0
Labor notional  hold Swing +0.0

Related Research Articles

Division of Corangamite Australian federal electoral division

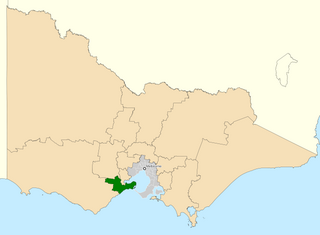
The Division of Corangamite is an Australian electoral division in the state of Victoria. The division was proclaimed in 1900, and was one of the original 65 divisions to be contested at the first federal election. It is named for Lake Corangamite, although the lake no longer falls within the division's boundaries.

Division of Calwell Australian federal electoral division

The Division of Calwell is an Australian Electoral Division in the state of Victoria.

Division of Melbourne Australian federal electoral division

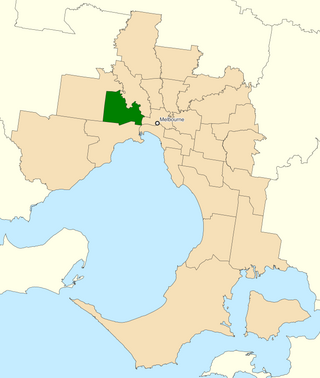
The Division of Melbourne is an Australian electoral division in the State of Victoria, represented since the 2010 election by Adam Bandt, leader of the Australian Greens.
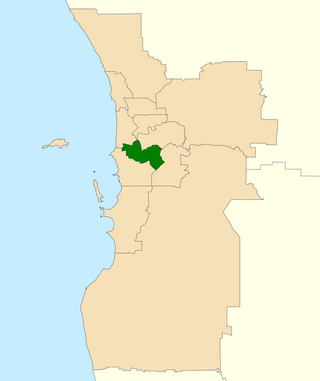
This is a list of electoral results for the Division of Chisholm in Australian federal elections from the division's creation in 1949 until the present.

This is a list of electoral results for the Division of Corangamite in Australian federal elections from the division's creation in 1901 until the present.

This is a list of electoral results for the Division of Corio in Australian federal elections from the division's creation in 1901 until the present.

This is a list of electoral results for the Division of Deakin in Australian federal elections from the division's creation in 1937 until the present.

This is a list of electoral results for the Division of Dunkley in Australian federal elections from the division's creation in 1984 until the present.

This is a list of electoral results for the Division of Gellibrand in Australian federal elections from the division's creation in 1949 until the present.

This is a list of electoral results for the Division of Higgins in Australian federal elections from the division's creation in 1949 until the present.

This is a list of electoral results for the Division of Hotham in Australian federal elections from the division's creation in 1969 until the present.

This is a list of electoral results for the Division of Indi in Australian federal elections from the division's creation in 1901 until the present.

This is a list of electoral results for the Division of Isaacs in Australian federal elections from the division's creation in 1969 until the present.

This is a list of electoral results for the Division of Kooyong in Australian federal elections from the division's creation in 1901 until the present.

This is a list of electoral results for the Division of Mallee in Australian federal elections from the division's creation in 1949 until the present.

This is a list of electoral results for the Division of Maribyrnong in Australian federal elections from the division's creation in 1906 until the present.

This is a list of electoral results for the Division of Wannon in Australian federal elections from the division's creation in 1901 until the present.

Results of the 2016 Australian federal election in Victoria

This is a list of electoral division results for the 2016 Australian federal election in the state of Victoria.

Division of Fraser (Victoria) Australian federal electoral division

The Division of Fraser is an Australian electoral division in the state of Victoria, which was contested for the first time at the 2019 federal election.

Results of the 2019 Australian federal election in Victoria

This is a list of electoral division results for the 2019 Australian federal election in the state of Victoria. Victoria bucked the national trend, seeing a swing from the Coalition to Labor, whereas the swing across Australia was from Labor to the Coalition.

References

  1. Calwell, VIC, 2022 Tally Room, Australian Electoral Commission.
  2. Calwell, VIC, Tally Room 2019, Australian Electoral Commission.
  3. Calwell, VIC, Virtual Tally Room 2016, Australian Electoral Commission.
  4. 2013 results for Calwell, AEC.
  5. "2010 results for Calwell". AEC.