![]() | |||||||||||||||||||||||||||||||||||||||||||||||||
| |||||||||||||||||||||||||||||||||||||||||||||||||
All 39 Victorian seats in the Australian House of Representatives and 6 seats in the Australian Senate | |||||||||||||||||||||||||||||||||||||||||||||||||
---|---|---|---|---|---|---|---|---|---|---|---|---|---|---|---|---|---|---|---|---|---|---|---|---|---|---|---|---|---|---|---|---|---|---|---|---|---|---|---|---|---|---|---|---|---|---|---|---|---|
| |||||||||||||||||||||||||||||||||||||||||||||||||
![]() Results by division for the House of Representatives, shaded by winning party's margin of victory. |
![]() 2022 Australian federal election |
---|
National results |
State and territory results |
This is a list of electoral division results for the 2022 Australian federal election in the state of Victoria.
Party | Votes | % | Swing (pp) | Seats | Change (seats) [a] | |||
---|---|---|---|---|---|---|---|---|
Liberal Party of Australia | 1,105,718 | 29.51 | −5.37 | 8 | ![]() | |||
National Party of Australia | 133,562 | 3.57 | −0.13 | 3 | ![]() | |||
Liberal/National Coalition | 1,239,280 | 33.08 | −5.18 | 11 | ![]() | |||
Australian Labor Party | 1,230,842 | 32.85 | −4.01 | 24 | ![]() | |||
Australian Greens | 514,893 | 13.74 | +1.85 | 1 | ![]() | |||
United Australia Party | 177,745 | 4.74 | +1.10 | 0 | ![]() | |||
Pauline Hanson's One Nation | 143,558 | 3.83 | +2.88 | 0 | ![]() | |||
Liberal Democratic Party | 94,626 | 2.53 | +2.53 | 0 | ![]() | |||
Animal Justice Party | 28,205 | 0.75 | −0.37 | 0 | ![]() | |||
Victorian Socialists | 27,226 | 0.73 | +0.39 | 0 | ![]() | |||
Australian Federation Party | 20,439 | 0.55 | +0.55 | 0 | ![]() | |||
Derryn Hinch's Justice Party | 6,494 | 0.17 | −0.56 | 0 | ![]() | |||
Socialist Alliance | 5,540 | 0.15 | +0.15 | 0 | ![]() | |||
The Great Australian Party | 4,880 | 0.13 | +0.06 | 0 | ![]() | |||
TNL | 2,405 | 0.06 | +0.06 | 0 | ![]() | |||
Fusion | 2,238 | 0.06 | +0.06 | 0 | ![]() | |||
Australian Citizens Party | 2,017 | 0.05 | −0.04 | 0 | ![]() | |||
Reason Party | 1,458 | 0.04 | −0.20 | 0 | ![]() | |||
Sustainable Australia | 443 | 0.01 | −0.17 | 0 | ![]() | |||
Australian Values Party | 152 | 0.00 | +0.00 | 0 | ![]() | |||
Independent | 243,992 | 6.51 | +2.59 | 3 | ![]() | |||
Total | 3,746,433 | 100.00 | 39 | ![]() | ||||
Invalid/blank votes | 185,174 | 4.71 | +0.05 | – | – | |||
Turnout | 3,931,607 | 90.59 | −2.03 | – | – | |||
Registered voters | 4,339,960 | – | – | – | – | |||
Two-party-preferred vote | ||||||||
Labor | 2,054,061 | 54.83 | +1.69 | |||||
Liberal/National Coalition | 1,692,372 | 45.17 | −1.69 | |||||
Source: AEC for both votes and seats |
Party | Candidate | Votes | % | ±% | |
---|---|---|---|---|---|
Liberal | Alan Tudge | 42,260 | 43.05 | −11.64 | |
Labor | Mary Doyle | 31,949 | 32.55 | +2.74 | |
Greens | Asher Cookson | 11,855 | 12.08 | +3.22 | |
United Australia | Rebekah Spelman | 5,990 | 6.10 | +2.49 | |
One Nation | Craig Ibbotson | 3,022 | 3.08 | +3.08 | |
Liberal Democrats | Liam Roche | 2,111 | 2.15 | +2.15 | |
TNL | Ryan Bruce | 973 | 0.99 | +0.99 | |
Total formal votes | 98,160 | 96.73 | +0.41 | ||
Informal votes | 3,320 | 3.27 | −0.41 | ||
Turnout | 101,480 | 92.50 | −1.79 | ||
Two-party-preferred result | |||||
Liberal | Alan Tudge | 51,840 | 52.81 | −7.32 | |
Labor | Mary Doyle | 46,320 | 47.19 | +7.32 | |
Liberal hold | Swing | −7.32 |
Party | Candidate | Votes | % | ±% | |
---|---|---|---|---|---|
Labor | Catherine King | 43,171 | 44.74 | −2.15 | |
Liberal | Ben Green | 26,142 | 27.09 | −4.57 | |
Greens | John Barnes | 14,076 | 14.59 | +5.61 | |
United Australia | Terri Pryse-Smith | 3,693 | 3.83 | −0.77 | |
One Nation | Rosalie Taxis | 3,476 | 3.60 | +3.60 | |
Liberal Democrats | Julia McGrath | 3,216 | 3.33 | +3.33 | |
Independent | Alex Graham | 2,044 | 2.12 | +0.85 | |
Federation | Kerryn Sedgman | 682 | 0.71 | +0.71 | |
Total formal votes | 96,500 | 94.97 | −0.83 | ||
Informal votes | 5,109 | 5.03 | +0.83 | ||
Turnout | 101,609 | 91.90 | −1.92 | ||
Two-party-preferred result | |||||
Labor | Catherine King | 60,770 | 62.97 | +2.74 | |
Liberal | Ben Green | 35,730 | 37.03 | −2.74 | |
Labor hold | Swing | +2.74 |
Party | Candidate | Votes | % | ±% | |
---|---|---|---|---|---|
Labor | Lisa Chesters | 42,883 | 42.98 | −0.63 | |
Liberal | Darin Schade | 26,576 | 26.63 | −5.15 | |
Greens | Cate Sinclair | 14,026 | 14.06 | +3.15 | |
One Nation | Ben Mihail | 5,508 | 5.52 | −0.72 | |
Independent | James Laurie | 4,319 | 4.33 | +4.33 | |
United Australia | Elijah Suares | 3,579 | 3.59 | −0.74 | |
Liberal Democrats | Matt Bansemer | 2,888 | 2.89 | +2.89 | |
Total formal votes | 99,779 | 96.36 | +0.46 | ||
Informal votes | 3,764 | 3.64 | −0.46 | ||
Turnout | 103,543 | 92.16 | −2.15 | ||
Two-party-preferred result | |||||
Labor | Lisa Chesters | 61,968 | 62.11 | +3.26 | |
Liberal | Darin Schade | 37,811 | 37.89 | −3.26 | |
Labor hold | Swing | +3.26 |
Party | Candidate | Votes | % | ±% | |
---|---|---|---|---|---|
Labor | Julian Hill | 39,516 | 41.47 | −6.57 | |
Liberal | James Moody | 28,837 | 30.26 | −5.43 | |
Greens | Matthew Kirwan | 9,273 | 9.73 | +2.10 | |
United Australia | Matt Babet | 8,299 | 8.71 | +4.61 | |
Liberal Democrats | Christine Skrobo | 4,821 | 5.06 | +5.06 | |
One Nation | Hayley Deans | 4,544 | 4.77 | +3.75 | |
Total formal votes | 95,290 | 95.66 | +0.76 | ||
Informal votes | 4,321 | 4.34 | −0.76 | ||
Turnout | 99,611 | 88.34 | −3.67 | ||
Two-party-preferred result | |||||
Labor | Julian Hill | 53,920 | 56.59 | −0.69 | |
Liberal | James Moody | 41,370 | 43.41 | +0.69 | |
Labor hold | Swing | −0.69 |
Party | Candidate | Votes | % | ±% | |
---|---|---|---|---|---|
Labor | Maria Vamvakinou | 38,127 | 44.86 | −9.57 | |
Liberal | Tim Staker-Gunn | 20,111 | 23.66 | −0.63 | |
Greens | Natalie Abboud | 8,277 | 9.74 | +3.01 | |
United Australia | Joshua Naim | 7,578 | 8.92 | +5.45 | |
One Nation | Mark Preston | 5,957 | 7.01 | +7.01 | |
Victorian Socialists | Jerome Small | 3,433 | 4.04 | −0.74 | |
Federation | Maria Bengtsson | 1,512 | 1.78 | +1.78 | |
Total formal votes | 84,995 | 93.69 | +3.03 | ||
Informal votes | 5,724 | 6.31 | −3.03 | ||
Turnout | 90,719 | 85.02 | −1.04 | ||
Two-party-preferred result | |||||
Labor | Maria Vamvakinou | 53,032 | 62.39 | −7.23 | |
Liberal | Tim Staker-Gunn | 31,963 | 37.61 | +7.23 | |
Labor hold | Swing | −7.23 |
Party | Candidate | Votes | % | ±% | |
---|---|---|---|---|---|
Liberal | Aaron Violi | 36,347 | 36.49 | −8.74 | |
Labor | Bill Brindle | 24,779 | 24.87 | −3.78 | |
Greens | Jenny Game | 12,894 | 12.94 | +1.99 | |
Independent | Claire Ferres Miles | 8,307 | 8.34 | +8.34 | |
United Australia | Anthony Bellve | 4,834 | 4.85 | +2.24 | |
Independent Australia One | Craig Cole | 3,455 | 3.47 | +3.47 | |
One Nation | Paul Murphy | 3,260 | 3.27 | +3.23 | |
Liberal Democrats | Trevor Smith | 2,008 | 2.02 | +2.02 | |
Animal Justice | Andrew Klop | 1,844 | 1.85 | −1.23 | |
Justice | Peter Sullivan | 1,207 | 1.21 | −2.11 | |
Federation | Chris Field | 686 | 0.69 | +0.69 | |
Total formal votes | 99,621 | 93.74 | +0.18 | ||
Informal votes | 6,652 | 6.26 | −0.18 | ||
Turnout | 106,273 | 93.00 | −2.52 | ||
Two-party-preferred result | |||||
Liberal | Aaron Violi | 51,283 | 51.48 | −3.14 | |
Labor | Bill Brindle | 48,338 | 48.52 | +3.14 | |
Liberal hold | Swing | −3.14 |
Party | Candidate | Votes | % | ±% | |
---|---|---|---|---|---|
Labor | Carina Garland | 38,692 | 40.09 | +3.77 | |
Liberal | Gladys Liu | 35,038 | 36.30 | −7.70 | |
Greens | Sarah Newman | 12,130 | 12.57 | +1.94 | |
United Australia | Melanie Kempson | 2,295 | 2.38 | +0.22 | |
Liberal Democrats | Ethelyn King | 1,620 | 1.68 | +1.68 | |
Independent | Dominique Murphy | 1,590 | 1.65 | +1.65 | |
One Nation | Aaron Tyrrell | 1,377 | 1.43 | +1.43 | |
Animal Justice | Rod Whitfield | 1,122 | 1.16 | −0.09 | |
Justice | Thomas Stanfield | 946 | 0.98 | −0.45 | |
Independent | Wayne Tseng | 757 | 0.78 | +0.78 | |
Federation | Anthea Antonie | 567 | 0.59 | +0.59 | |
Australian Citizens | Ryan Dare | 384 | 0.40 | +0.40 | |
Total formal votes | 96,518 | 95.30 | −0.44 | ||
Informal votes | 4,763 | 4.70 | +0.44 | ||
Turnout | 101,281 | 92.20 | −2.61 | ||
Two-party-preferred result | |||||
Labor | Carina Garland | 54,448 | 56.41 | +6.86 | |
Liberal | Gladys Liu | 42,070 | 43.59 | −6.86 | |
Labor gain from Liberal | Swing | +6.86 |
Party | Candidate | Votes | % | ±% | |
---|---|---|---|---|---|
Labor | Ged Kearney | 38,754 | 41.34 | −5.52 | |
Greens | Celeste Liddle | 25,648 | 27.36 | +6.43 | |
Liberal | Jadon Atkinson | 15,329 | 16.35 | −3.25 | |
United Australia | Adam La Rosa | 4,170 | 4.45 | +2.48 | |
Victorian Socialists | Kath Larkin | 3,250 | 3.47 | −0.75 | |
One Nation | William Turner | 2,807 | 2.99 | +2.99 | |
Animal Justice | Rabin Bangaar | 2,207 | 2.35 | −0.20 | |
Fusion | Adrian Whitehead | 1,585 | 1.69 | +1.69 | |
Total formal votes | 93,750 | 95.74 | +0.66 | ||
Informal votes | 4,169 | 4.26 | −0.66 | ||
Turnout | 97,919 | 90.16 | −2.18 | ||
Notional two-party-preferred count | |||||
Labor | Ged Kearney | 70,743 | 75.46 | −0.75 | |
Liberal | Jadon Atkinson | 23,007 | 24.54 | +0.75 | |
Two-candidate-preferred result | |||||
Labor | Ged Kearney | 55,006 | 58.67 | −6.16 | |
Greens | Celeste Liddle | 38,744 | 41.33 | +6.16 | |
Labor hold | Swing | −6.16 |
Party | Candidate | Votes | % | ±% | |
---|---|---|---|---|---|
Labor | Libby Coker | 38,573 | 38.20 | +2.41 | |
Liberal | Stephanie Asher | 34,463 | 34.13 | −8.26 | |
Greens | Alex Marshall | 15,349 | 15.20 | +6.49 | |
United Australia | Daniel Abou-Zeid | 3,233 | 3.20 | +1.02 | |
One Nation | Luke Sorensen | 2,548 | 2.52 | +2.52 | |
Liberal Democrats | Paul Barker | 2,526 | 2.50 | +2.50 | |
Animal Justice | Meg Watkins | 1,986 | 1.97 | −0.17 | |
Justice | Jean-Marie D'Argent | 1,421 | 1.41 | −1.22 | |
Federation | Stephen Juhasz | 868 | 0.86 | +0.86 | |
Total formal votes | 100,967 | 96.11 | +0.06 | ||
Informal votes | 4,088 | 3.89 | −0.06 | ||
Turnout | 105,055 | 93.26 | +1.01 | ||
Two-party-preferred result | |||||
Labor | Libby Coker | 58,160 | 57.60 | +6.55 | |
Liberal | Stephanie Asher | 42,807 | 42.40 | −6.55 | |
Labor hold | Swing | +6.55 |
Party | Candidate | Votes | % | ±% | |
---|---|---|---|---|---|
Labor | Richard Marles | 40,846 | 42.13 | −5.47 | |
Liberal | Manish Patel | 23,822 | 24.57 | −9.28 | |
Greens | Simon Northeast | 14,450 | 14.91 | +1.84 | |
United Australia | Shane Murdock | 4,781 | 4.93 | −0.55 | |
One Nation | Robert Jones | 3,788 | 3.91 | +3.91 | |
Liberal Democrats | Max Payne | 3,383 | 3.49 | +3.49 | |
Socialist Alliance | Sue Bull | 2,444 | 2.52 | +2.52 | |
Animal Justice | Naomi Adams | 2,350 | 2.42 | +2.42 | |
Federation | Jessica Taylor | 1,080 | 1.11 | +1.11 | |
Total formal votes | 96,944 | 94.78 | −1.66 | ||
Informal votes | 5,341 | 5.22 | +1.66 | ||
Turnout | 102,285 | 90.91 | −2.97 | ||
Two-party-preferred result | |||||
Labor | Richard Marles | 60,919 | 62.84 | +2.52 | |
Liberal | Manish Patel | 36,025 | 37.16 | −2.52 | |
Labor hold | Swing | +2.52 |
Party | Candidate | Votes | % | ±% | |
---|---|---|---|---|---|
Liberal | Michael Sukkar | 41,626 | 41.51 | −6.21 | |
Labor | Matt Gregg | 32,844 | 32.76 | +0.40 | |
Greens | Rob Humphreys | 13,904 | 13.87 | +4.58 | |
United Australia | Bianca Gidley | 2,836 | 2.83 | +0.76 | |
One Nation | Natasha Coughlan | 2,306 | 2.30 | +2.30 | |
Liberal Democrats | Harrison Carr | 1,843 | 1.84 | +1.84 | |
Animal Justice | Katherine Dolheguy | 1,650 | 1.65 | −0.31 | |
Independent | Qian Liu | 1,271 | 1.27 | +1.27 | |
Justice | Judith Thompson | 1,080 | 1.08 | −2.23 | |
Federation | Samantha Bastin | 909 | 0.91 | +0.91 | |
Total formal votes | 100,269 | 95.78 | −0.15 | ||
Informal votes | 4,419 | 4.22 | +0.15 | ||
Turnout | 104,688 | 93.09 | −2.08 | ||
Two-party-preferred result | |||||
Liberal | Michael Sukkar | 50,322 | 50.19 | −4.50 | |
Labor | Matt Gregg | 49,947 | 49.81 | +4.50 | |
Liberal hold | Swing | −4.50 |
Party | Candidate | Votes | % | ±% | |
---|---|---|---|---|---|
Labor | Peta Murphy | 38,506 | 40.23 | +1.71 | |
Liberal | Sharn Coombes | 31,108 | 32.50 | −7.38 | |
Greens | Liam O'Brien | 9,898 | 10.34 | +1.95 | |
United Australia | Adrian Irvine | 4,846 | 5.06 | +2.46 | |
Independent | Darren Bergwerf | 3,698 | 3.86 | +3.86 | |
One Nation | Scott Middlebrook | 2,689 | 2.81 | +2.81 | |
Liberal Democrats | Damian Willis | 2,398 | 2.51 | +2.51 | |
Animal Justice | Elizabeth Johnston | 2,013 | 2.10 | −0.96 | |
Federation | Kathryn Woods | 566 | 0.59 | +0.59 | |
Total formal votes | 95,722 | 95.27 | +0.41 | ||
Informal votes | 4,750 | 4.73 | −0.41 | ||
Turnout | 100,472 | 90.06 | −2.30 | ||
Two-party-preferred result | |||||
Labor | Peta Murphy | 53,865 | 56.27 | +3.53 | |
Liberal | Sharn Coombes | 41,857 | 43.73 | −3.53 | |
Labor hold | Swing | +3.53 |
Party | Candidate | Votes | % | ±% | |
---|---|---|---|---|---|
Liberal | Zoe McKenzie | 43,013 | 43.49 | −3.23 | |
Labor | Surbhi Snowball | 21,487 | 21.73 | −3.01 | |
Greens | Colin Lane | 9,293 | 9.40 | +2.59 | |
Independent | Despi O'Connor | 7,163 | 7.24 | +7.24 | |
Independent | Sarah Russell | 5,189 | 5.25 | +5.25 | |
United Australia | Alex van der End | 4,472 | 4.52 | +2.00 | |
One Nation | Cyndi Marr | 3,373 | 3.41 | +3.41 | |
Liberal Democrats | Chrysten Abraham | 2,366 | 2.39 | +2.39 | |
Animal Justice | Pamela Engelander | 2,060 | 2.08 | −0.30 | |
Federation | Jefferson Earl | 486 | 0.49 | +0.49 | |
Total formal votes | 98,902 | 94.56 | +0.50 | ||
Informal votes | 5,687 | 5.44 | −0.50 | ||
Turnout | 104,589 | 91.41 | −1.82 | ||
Two-party-preferred result | |||||
Liberal | Zoe McKenzie | 56,075 | 56.70 | +1.06 | |
Labor | Surbhi Snowball | 42,827 | 43.30 | −1.06 | |
Liberal hold | Swing | +1.06 |
Party | Candidate | Votes | % | ±% | |
---|---|---|---|---|---|
Labor | Daniel Mulino | 38,732 | 42.05 | −8.73 | |
Liberal | David Wood | 22,730 | 24.68 | +0.73 | |
Greens | Bella Mitchell-Sears | 17,078 | 18.54 | +4.66 | |
Victorian Socialists | Catherine Robertson | 4,429 | 4.81 | +4.81 | |
United Australia | Keith Raymond | 4,088 | 4.44 | −2.05 | |
One Nation | Sabine de Pyle | 2,695 | 2.93 | +2.93 | |
Liberal Democrats | Anthony Cursio | 2,349 | 2.55 | +2.55 | |
Total formal votes | 92,101 | 95.58 | +0.39 | ||
Informal votes | 4,258 | 4.42 | −0.39 | ||
Turnout | 96,359 | 86.84 | −3.26 | ||
Two-party-preferred result | |||||
Labor | Daniel Mulino | 61,251 | 66.50 | −1.55 | |
Liberal | David Wood | 30,850 | 33.50 | +1.55 | |
Labor hold | Swing | −1.55 |
Party | Candidate | Votes | % | ±% | |
---|---|---|---|---|---|
Labor | Tim Watts | 39,382 | 42.72 | −6.30 | |
Liberal | Monica Clark | 24,869 | 26.97 | −3.80 | |
Greens | Suzette Rodoreda | 15,241 | 16.53 | +2.67 | |
United Australia | Abraham Isac | 5,080 | 5.51 | −0.14 | |
One Nation | Rob Braddock | 2,802 | 3.04 | +3.04 | |
Liberal Democrats | Chloe Glasson | 2,185 | 2.37 | +2.37 | |
Victorian Socialists | Andrew Charles | 1,503 | 1.63 | +1.63 | |
Federation | Sharynn Moors | 1,135 | 1.23 | +1.23 | |
Total formal votes | 92,197 | 95.12 | −1.25 | ||
Informal votes | 4,729 | 4.88 | +1.25 | ||
Turnout | 96,926 | 89.67 | −1.22 | ||
Two-party-preferred result | |||||
Labor | Tim Watts | 56,738 | 61.54 | −1.48 | |
Liberal | Monica Clark | 35,459 | 38.46 | +1.48 | |
Labor hold | Swing | −1.48 |
Party | Candidate | Votes | % | ±% | |
---|---|---|---|---|---|
National | Darren Chester | 54,635 | 54.14 | +0.14 | |
Labor | Jannette Langley | 19,404 | 19.23 | −3.97 | |
One Nation | Greg Hansford | 9,443 | 9.36 | +9.36 | |
Greens | Marjorie Thorpe | 8,545 | 8.47 | +2.43 | |
United Australia | Gregory Forster | 4,593 | 4.55 | +0.15 | |
Liberal Democrats | Jim McDonald | 4,286 | 4.25 | +4.25 | |
Total formal votes | 100,906 | 97.04 | +2.26 | ||
Informal votes | 3,073 | 2.96 | −2.26 | ||
Turnout | 103,979 | 90.89 | −1.49 | ||
Two-party-preferred result | |||||
National | Darren Chester | 71,205 | 70.57 | +3.90 | |
Labor | Jannette Langley | 29,701 | 29.43 | −3.90 | |
National hold | Swing | +3.90 |
Party | Candidate | Votes | % | ±% | |
---|---|---|---|---|---|
Liberal | Tim Wilson | 39,607 | 40.38 | −12.29 | |
Independent | Zoe Daniel | 33,815 | 34.47 | +34.47 | |
Labor | Martyn Abbott | 10,799 | 11.01 | −17.30 | |
Greens | Alana Galli-McRostie | 7,683 | 7.83 | −6.21 | |
Liberal Democrats | David Segal | 2,072 | 2.11 | +2.11 | |
United Australia | Catherine Reynolds | 1,840 | 1.88 | −0.08 | |
One Nation | Lisa Stark | 1,239 | 1.26 | +1.26 | |
Justice | Ellie Sullivan | 589 | 0.60 | +0.60 | |
Sustainable Australia | Brandon Hoult | 443 | 0.45 | −1.21 | |
Total formal votes | 98,087 | 96.57 | −1.22 | ||
Informal votes | 3,487 | 3.43 | +1.22 | ||
Turnout | 101,574 | 92.65 | −1.07 | ||
Notional two-party-preferred count | |||||
Liberal | Tim Wilson | 53,750 | 54.80 | −2.99 | |
Labor | Martyn Abbott | 44,337 | 45.20 | +2.99 | |
Two-candidate-preferred result | |||||
Independent | Zoe Daniel | 51,861 | 52.87 | +52.87 | |
Liberal | Tim Wilson | 46,226 | 47.13 | −10.66 | |
Independent gain from Liberal |
Party | Candidate | Votes | % | ±% | |
---|---|---|---|---|---|
Labor | Brendan O'Connor | 38,178 | 41.30 | −10.13 | |
Liberal | John Fletcher | 25,350 | 27.42 | −0.56 | |
Greens | Praise Morris | 8,325 | 9.01 | +1.58 | |
United Australia | Michael Virag | 7,082 | 7.66 | +0.36 | |
One Nation | Daniel Connor | 6,719 | 7.27 | +7.27 | |
Independent | Steven Loncar | 2,341 | 2.53 | +2.53 | |
Victorian Socialists | Belle Gibson | 2,064 | 2.23 | +2.23 | |
Great Australian | Tony Dobran | 1,312 | 1.42 | +0.64 | |
Federation | Paul Lassig | 1,063 | 1.15 | +1.15 | |
Total formal votes | 92,434 | 92.88 | −1.04 | ||
Informal votes | 7,089 | 7.12 | +1.04 | ||
Turnout | 99,523 | 89.77 | −1.24 | ||
Two-party-preferred result | |||||
Labor | Brendan O'Connor | 55,434 | 59.97 | −4.27 | |
Liberal | John Fletcher | 37,000 | 40.03 | +4.27 | |
Labor hold | Swing | −4.27 |
Party | Candidate | Votes | % | ±% | |
---|---|---|---|---|---|
Labor | Sam Rae | 32,020 | 36.73 | −7.44 | |
Liberal | Enamul Haque | 22,960 | 26.34 | −3.01 | |
Greens | Lynda Wheelock | 7,785 | 8.93 | +1.56 | |
Independent | Jarrod Bingham | 6,908 | 7.92 | +1.50 | |
United Australia | Andrew Cuthbertson | 6,131 | 7.03 | +0.71 | |
One Nation | Nick Suduk | 4,872 | 5.59 | +3.88 | |
Federation | Michael Williams | 1,926 | 2.21 | +2.21 | |
Great Australian | Michael Lacey | 1,827 | 2.10 | +2.10 | |
TNL | Max Martucci | 1,432 | 1.64 | +1.64 | |
Victorian Socialists | Jack Hynes | 889 | 1.02 | +1.02 | |
Australian Citizens | Glenn Vessey | 434 | 0.50 | +0.50 | |
Total formal votes | 87,184 | 91.85 | −2.61 | ||
Informal votes | 7,735 | 8.15 | +2.61 | ||
Turnout | 94,919 | 89.14 | −0.81 | ||
Two-party-preferred result | |||||
Labor | Sam Rae | 50,241 | 57.63 | −2.59 | |
Liberal | Enamul Haque | 36,943 | 42.37 | +2.59 | |
Labor hold | Swing | −2.59 |
Party | Candidate | Votes | % | ±% | |
---|---|---|---|---|---|
Liberal | Katie Allen | 38,859 | 40.69 | −5.84 | |
Labor | Michelle Ananda-Rajah | 27,187 | 28.46 | +2.39 | |
Greens | Sonya Semmens | 21,632 | 22.65 | −0.06 | |
Liberal Democrats | Matthew Ford | 2,648 | 2.77 | +2.77 | |
United Australia | Ingram Spencer | 1,917 | 2.01 | +0.84 | |
Reason | Andrew Johnson | 1,458 | 1.53 | +1.53 | |
Animal Justice | Alicia Walker | 1,295 | 1.36 | −0.40 | |
Federation | Suzie Menoudakis | 515 | 0.54 | +0.54 | |
Total formal votes | 95,511 | 97.18 | −0.31 | ||
Informal votes | 2,774 | 2.82 | +0.31 | ||
Turnout | 98,285 | 91.23 | −2.45 | ||
Two-party-preferred result | |||||
Labor | Michelle Ananda-Rajah | 49,726 | 52.06 | +4.67 | |
Liberal | Katie Allen | 45,785 | 47.94 | −4.67 | |
Labor gain from Liberal | Swing | +4.67 |
Party | Candidate | Votes | % | ±% | |
---|---|---|---|---|---|
Labor | Cassandra Fernando | 36,326 | 40.86 | −9.68 | |
Liberal | Ranj Perera | 26,274 | 29.56 | −6.21 | |
United Australia | Gerardine Hansen | 8,592 | 9.67 | +3.52 | |
Greens | Sujit Mathew | 7,583 | 8.53 | +1.37 | |
One Nation | Sandy Ambard | 4,295 | 4.83 | +4.70 | |
Independent | Ravi Ragupathy | 2,673 | 3.01 | +3.01 | |
Liberal Democrats | Matthew Nunez-Silva | 2,423 | 2.73 | +2.73 | |
Federation | Gregory Saldana | 730 | 0.82 | +0.82 | |
Total formal votes | 88,896 | 93.45 | −2.38 | ||
Informal votes | 6,227 | 6.55 | +2.38 | ||
Turnout | 95,123 | 88.57 | −0.94 | ||
Two-party-preferred result | |||||
Labor | Cassandra Fernando | 50,777 | 57.12 | −1.51 | |
Liberal | Ranj Perera | 38,119 | 42.88 | +1.51 | |
Labor hold | Swing | −1.51 |
Party | Candidate | Votes | % | ±% | |
---|---|---|---|---|---|
Labor | Clare O'Neil | 47,135 | 47.04 | −3.72 | |
Liberal | Savitri Bevinakoppa | 25,273 | 25.22 | −8.15 | |
Greens | Louisa Willoughby | 12,408 | 12.38 | +3.44 | |
Liberal Democrats | Edward Sok | 6,591 | 6.58 | +6.58 | |
United Australia | Bruce Ridgway | 5,869 | 5.86 | +2.17 | |
One Nation | Roger Tull | 2,926 | 2.92 | +2.92 | |
Total formal votes | 100,202 | 96.45 | +0.85 | ||
Informal votes | 3,688 | 3.55 | −0.85 | ||
Turnout | 103,890 | 89.58 | −2.81 | ||
Two-party-preferred result | |||||
Labor | Clare O'Neil | 64,382 | 64.25 | +3.07 | |
Liberal | Savitri Bevinakoppa | 35,820 | 35.75 | −3.07 | |
Labor hold | Swing | +3.07 |
Party | Candidate | Votes | % | ±% | |
---|---|---|---|---|---|
Independent | Helen Haines | 41,319 | 40.68 | +8.33 | |
Liberal | Ross Lyman | 30,995 | 30.52 | −4.57 | |
Labor | Nadia David | 8,723 | 8.59 | −3.50 | |
One Nation | Beth Stevens | 5,366 | 5.28 | +5.28 | |
National | Liz Fisher | 3,854 | 3.79 | −5.66 | |
Greens | Benjamin Gilbert | 3,626 | 3.57 | −0.64 | |
United Australia | Stephen Williams | 2,558 | 2.52 | −1.42 | |
Liberal Democrats | Julian Fidge | 2,300 | 2.26 | +2.26 | |
Animal Justice | Angel Aleksov | 1,749 | 1.72 | +1.72 | |
Justice | Lachlan O'Connell | 1,074 | 1.06 | −1.80 | |
Total formal votes | 101,564 | 94.53 | −1.11 | ||
Informal votes | 5,880 | 5.47 | +1.11 | ||
Turnout | 107,444 | 91.48 | −2.88 | ||
Notional two-party-preferred count | |||||
Liberal | Ross Lyman | 56,123 | 55.26 | −7.47 | |
Labor | Nadia David | 45,441 | 44.74 | +7.47 | |
Two-candidate-preferred result | |||||
Independent | Helen Haines | 59,861 | 58.94 | +7.55 | |
Liberal | Ross Lyman | 41,703 | 41.06 | −7.55 | |
Independent hold | Swing | +7.55 |
Party | Candidate | Votes | % | ±% | |
---|---|---|---|---|---|
Labor | Mark Dreyfus | 39,228 | 39.95 | −4.95 | |
Liberal | Robbie Beaton | 31,306 | 31.89 | −3.36 | |
Greens | Alex Breskin | 12,621 | 12.85 | +1.78 | |
United Australia | Scott McCamish | 4,855 | 4.94 | +0.95 | |
Liberal Democrats | Sarah O'Donnell | 4,785 | 4.87 | +4.87 | |
One Nation | Boris Sokiransky | 3,130 | 3.19 | +3.19 | |
Animal Justice | Alix Livingstone | 2,259 | 2.30 | −1.30 | |
Total formal votes | 98,184 | 96.67 | +0.80 | ||
Informal votes | 3,382 | 3.33 | −0.80 | ||
Turnout | 101,566 | 91.77 | −1.73 | ||
Two-party-preferred result | |||||
Labor | Mark Dreyfus | 55,818 | 56.85 | +0.39 | |
Liberal | Robbie Beaton | 42,366 | 43.15 | −0.39 | |
Labor hold | Swing | +0.39 |
Party | Candidate | Votes | % | ±% | |
---|---|---|---|---|---|
Labor | Kate Thwaites | 41,412 | 40.90 | +0.00 | |
Liberal | Sahil Tomar | 29,535 | 29.17 | −10.04 | |
Greens | Liz Chase | 16,855 | 16.65 | +2.26 | |
Liberal Democrats | Maya Tesa | 3,760 | 3.71 | +3.71 | |
United Australia | Allison Zelinka | 3,493 | 3.45 | −0.04 | |
Independent | Zahra Mustaf | 3,150 | 3.11 | +3.11 | |
One Nation | John Booker | 2,274 | 2.25 | +2.25 | |
Federation | Brendan Palmarini | 764 | 0.75 | +0.75 | |
Total formal votes | 101,243 | 96.20 | −0.74 | ||
Informal votes | 4,003 | 3.80 | +0.74 | ||
Turnout | 105,246 | 93.00 | −2.26 | ||
Two-party-preferred result | |||||
Labor | Kate Thwaites | 63,122 | 62.35 | +6.46 | |
Liberal | Sahil Tomar | 38,121 | 37.65 | −6.46 | |
Labor hold | Swing | +6.46 |
Party | Candidate | Votes | % | ±% | |
---|---|---|---|---|---|
Liberal | Josh Frydenberg | 43,736 | 42.66 | −6.51 | |
Independent | Monique Ryan | 41,303 | 40.29 | +40.29 | |
Labor | Peter Lynch | 7,091 | 6.92 | −10.60 | |
Greens | Piers Mitchem | 6,461 | 6.30 | −14.78 | |
Liberal Democrats | Alexandra Thom | 1,080 | 1.05 | +1.05 | |
United Australia | Scott Hardiman | 1,011 | 0.99 | −0.22 | |
One Nation | Josh Coyne | 741 | 0.72 | +0.72 | |
Animal Justice | Rachael Nehmer | 500 | 0.49 | −0.65 | |
Independent | Will Anderson | 265 | 0.26 | +0.26 | |
Justice | Michele Dale | 177 | 0.17 | +0.12 | |
Australian Values | David Connolly | 152 | 0.15 | +0.15 | |
Total formal votes | 102,517 | 97.11 | +0.08 | ||
Informal votes | 3,046 | 2.89 | −0.08 | ||
Turnout | 105,563 | 93.44 | −2.39 | ||
Notional two-party-preferred count | |||||
Liberal | Josh Frydenberg | 55,542 | 54.18 | −2.21 | |
Labor | Peter Lynch | 46,975 | 45.82 | +2.21 | |
Two-candidate-preferred result | |||||
Independent | Monique Ryan | 54,276 | 52.94 | +52.94 | |
Liberal | Josh Frydenberg | 48,241 | 47.06 | −8.36 | |
Independent gain from Liberal |
Party | Candidate | Votes | % | ±% | |
---|---|---|---|---|---|
Labor | Joanne Ryan | 39,047 | 44.11 | −7.47 | |
Liberal | Ravi Gaddipati | 22,083 | 24.95 | −5.13 | |
Greens | Jack Boddeke | 9,192 | 10.38 | +2.41 | |
United Australia | Juanita Paterson | 6,340 | 7.16 | +2.27 | |
One Nation | James Ingarfill | 3,489 | 3.94 | +3.94 | |
Liberal Democrats | Patrizia Barcatta | 3,403 | 3.84 | +3.84 | |
Independent (United People's Party) | Aijaz Moinuddin | 2,535 | 2.86 | +1.72 | |
Victorian Socialists | Claudio Uribe | 1,482 | 1.67 | +1.67 | |
Federation | Peter Malliaros | 951 | 1.07 | +1.07 | |
Total formal votes | 88,522 | 93.90 | −1.62 | ||
Informal votes | 5,752 | 6.10 | +1.62 | ||
Turnout | 94,274 | 88.15 | −0.62 | ||
Two-party-preferred result | |||||
Labor | Joanne Ryan | 55,613 | 62.82 | +0.36 | |
Liberal | Ravi Gaddipati | 32,909 | 37.18 | −0.36 | |
Labor hold | Swing | +0.36 |
Party | Candidate | Votes | % | ±% | |
---|---|---|---|---|---|
Liberal | Jason Wood | 41,786 | 45.58 | −0.20 | |
Labor | Abi Kumar | 23,918 | 26.09 | −7.55 | |
Greens | Michael Schilling | 9,980 | 10.89 | +3.32 | |
United Australia | Merryn Mott | 6,182 | 6.74 | +3.80 | |
One Nation | Hadden Ervin | 4,555 | 4.97 | −0.62 | |
Animal Justice | Helen Jeges | 2,450 | 2.67 | +2.67 | |
Liberal Democrats | Michael Abelman | 1,911 | 2.08 | +2.08 | |
Federation | Rebecca Skinner | 890 | 0.97 | +0.97 | |
Total formal votes | 91,672 | 95.34 | −0.11 | ||
Informal votes | 4,483 | 4.66 | +0.11 | ||
Turnout | 96,155 | 90.89 | +1.67 | ||
Two-party-preferred result | |||||
Liberal | Jason Wood | 53,803 | 58.69 | +3.56 | |
Labor | Abi Kumar | 37,869 | 41.31 | −3.56 | |
Liberal hold | Swing | +3.56 |
Party | Candidate | Votes | % | ±% | |
---|---|---|---|---|---|
Labor | Josh Burns | 29,552 | 31.77 | +0.93 | |
Greens | Steph Hodgins-May | 27,587 | 29.65 | +5.46 | |
Liberal | Colleen Harkin | 26,976 | 29.00 | −9.72 | |
United Australia | Jane Hickey | 2,062 | 2.22 | +1.01 | |
Liberal Democrats | Rob McCathie | 1,946 | 2.09 | +2.09 | |
Independent | John Myers | 1,835 | 1.97 | +1.97 | |
Animal Justice | Ben Schultz | 1,724 | 1.85 | −0.08 | |
One Nation | Debera Anne | 1,349 | 1.45 | +1.45 | |
Total formal votes | 93,031 | 96.57 | +0.36 | ||
Informal votes | 3,302 | 3.43 | −0.36 | ||
Turnout | 96,333 | 87.10 | −2.84 | ||
Two-party-preferred result | |||||
Labor | Josh Burns | 57,911 | 62.25 | +7.34 | |
Liberal | Colleen Harkin | 35,120 | 37.75 | −7.34 | |
Labor hold | Swing | +7.34 |
Party | Candidate | Votes | % | ±% | |
---|---|---|---|---|---|
National | Anne Webster | 50,187 | 49.09 | +22.65 | |
Labor | Carole Hart | 17,133 | 16.76 | +0.22 | |
Independent | Sophie Baldwin | 10,256 | 10.03 | +10.03 | |
United Australia | Stuart King | 9,271 | 9.07 | +5.56 | |
One Nation | Vanessa Atkinson | 6,901 | 6.75 | +6.75 | |
Greens | Sam McColl | 5,463 | 5.34 | +1.68 | |
Independent | Claudia Haenel | 2,196 | 2.15 | +2.15 | |
Australian Citizens | Chris Lahy | 822 | 0.80 | +0.38 | |
Total formal votes | 102,229 | 94.36 | +5.22 | ||
Informal votes | 6,113 | 5.64 | −5.22 | ||
Turnout | 108,342 | 90.19 | −4.09 | ||
Two-party-preferred result | |||||
National | Anne Webster | 70,523 | 68.99 | +3.31 | |
Labor | Carole Hart | 31,706 | 31.01 | −3.31 | |
National hold | Swing | +3.31 |
Party | Candidate | Votes | % | ±% | |
---|---|---|---|---|---|
Labor | Bill Shorten | 39,792 | 42.35 | −2.38 | |
Liberal | Mira D'Silva | 25,493 | 27.13 | −7.64 | |
Greens | Rhonda Pryor | 15,278 | 16.26 | +0.59 | |
Liberal Democrats | Cameron Smith | 3,577 | 3.81 | +3.81 | |
United Australia | Darren Besanko | 3,433 | 3.65 | +0.30 | |
One Nation | Jodie Tindal | 2,227 | 2.37 | +2.37 | |
Victorian Socialists | Daniel Dadich | 1,837 | 1.95 | +1.62 | |
Great Australian | Mark Hobart | 1,741 | 1.85 | +1.85 | |
Federation | Alexander Ansalone | 590 | 0.63 | +0.63 | |
Total formal votes | 93,968 | 95.03 | −1.40 | ||
Informal votes | 4,917 | 4.97 | +1.40 | ||
Turnout | 98,885 | 90.77 | −2.73 | ||
Two-party-preferred result | |||||
Labor | Bill Shorten | 58,679 | 62.45 | +2.14 | |
Liberal | Mira D'Silva | 35,289 | 37.55 | −2.14 | |
Labor hold | Swing | +2.14 |
Party | Candidate | Votes | % | ±% | |
---|---|---|---|---|---|
Labor | Rob Mitchell | 35,238 | 36.81 | −2.98 | |
Liberal | Richard Welch | 31,796 | 33.22 | −1.77 | |
Greens | Neil Barker | 13,524 | 14.13 | +4.66 | |
United Australia | Paul McRae | 5,474 | 5.72 | +2.46 | |
One Nation | Chris Bradbury | 5,387 | 5.63 | +0.51 | |
Liberal Democrats | John Herron | 2,579 | 2.69 | +2.69 | |
Federation | Christopher Neil | 1,721 | 1.80 | +1.80 | |
Total formal votes | 95,719 | 96.07 | +1.01 | ||
Informal votes | 3,918 | 3.93 | −1.01 | ||
Turnout | 99,637 | 92.23 | +0.07 | ||
Two-party-preferred result | |||||
Labor | Rob Mitchell | 50,998 | 53.28 | −2.00 | |
Liberal | Richard Welch | 44,721 | 46.72 | +2.00 | |
Labor hold | Swing | −2.00 |
Party | Candidate | Votes | % | ±% | |
---|---|---|---|---|---|
Greens | Adam Bandt | 47,883 | 49.62 | +1.58 | |
Labor | Keir Paterson | 24,155 | 25.03 | +3.91 | |
Liberal | James Damches | 14,660 | 15.19 | −6.01 | |
Victorian Socialists | Colleen Bolger | 3,156 | 3.27 | +3.27 | |
United Australia | Justin Borg | 1,709 | 1.77 | +0.60 | |
Liberal Democrats | Richard Peppard | 1,596 | 1.65 | +1.65 | |
Animal Justice | Bruce Poon | 1,316 | 1.36 | −0.68 | |
Independent | Scott Robson | 1,094 | 1.13 | +1.13 | |
One Nation | Walter Stragan | 937 | 0.97 | +0.97 | |
Total formal votes | 96,506 | 96.99 | +0.01 | ||
Informal votes | 2,993 | 3.01 | −0.01 | ||
Turnout | 99,499 | 86.98 | −2.64 | ||
Notional two-party-preferred count | |||||
Labor | Keir Paterson | 75,191 | 77.91 | +10.11 | |
Liberal | James Damches | 21,315 | 22.09 | −10.11 | |
Two-candidate-preferred result | |||||
Greens | Adam Bandt | 58,050 | 60.15 | −12.44 | |
Labor | Keir Paterson | 38,456 | 39.85 | +39.85 | |
Greens hold |
Party | Candidate | Votes | % | ±% | |
---|---|---|---|---|---|
Liberal | Keith Wolahan | 42,526 | 42.10 | −8.77 | |
Labor | Naomi Oakley | 33,635 | 33.30 | +2.77 | |
Greens | Bill Pheasant | 14,289 | 14.14 | +4.01 | |
Liberal Democrats | Greg Cheesman | 3,646 | 3.61 | +3.61 | |
United Australia | Nathan Scaglione | 3,643 | 3.61 | +1.19 | |
One Nation | John Hayes | 2,312 | 2.29 | +2.29 | |
Federation | Sanjeev Sabhlok | 968 | 0.96 | +0.96 | |
Total formal votes | 101,019 | 96.79 | +0.42 | ||
Informal votes | 3,355 | 3.21 | −0.42 | ||
Turnout | 104,374 | 92.58 | −2.65 | ||
Two-party-preferred result | |||||
Liberal | Keith Wolahan | 51,198 | 50.68 | −6.34 | |
Labor | Naomi Oakley | 49,821 | 49.32 | +6.34 | |
Liberal hold | Swing | −6.34 |
Party | Candidate | Votes | % | ±% | |
---|---|---|---|---|---|
Liberal | Russell Broadbent | 36,546 | 37.79 | −8.19 | |
Labor | Jessica O'Donnell | 24,759 | 25.60 | −4.30 | |
Independent | Deb Leonard | 10,372 | 10.72 | +10.72 | |
Greens | Mat Morgan | 9,533 | 9.86 | +2.69 | |
One Nation | Allan Hicken | 7,289 | 7.54 | +0.22 | |
United Australia | Christine McShane | 3,991 | 4.13 | +0.18 | |
Liberal Democrats | Meg Edwards | 3,548 | 3.67 | +3.67 | |
Federation | David Welsh | 674 | 0.70 | +0.70 | |
Total formal votes | 96,712 | 95.32 | −0.33 | ||
Informal votes | 4,752 | 4.68 | +0.33 | ||
Turnout | 101,464 | 91.34 | −1.20 | ||
Two-party-preferred result | |||||
Liberal | Russell Broadbent | 51,156 | 52.90 | −3.96 | |
Labor | Jessica O'Donnell | 45,556 | 47.10 | +3.96 | |
Liberal hold | Swing | −3.96 |
Party | Candidate | Votes | % | ±% | |
---|---|---|---|---|---|
National | Sam Birrell | 24,886 | 26.14 | −25.13 | |
Independent | Rob Priestly | 24,287 | 25.51 | +25.51 | |
Liberal | Steve Brooks | 17,187 | 18.06 | +18.06 | |
Labor | Bill Lodwick | 10,970 | 11.52 | −7.89 | |
One Nation | Rikkie-Lee Tyrrell | 6,219 | 6.53 | −4.76 | |
United Australia | Robert Peterson | 3,821 | 4.01 | −1.32 | |
Liberal Democrats | Tim Laird | 3,366 | 3.54 | +3.54 | |
Greens | Ian Christoe | 3,058 | 3.21 | −1.00 | |
Fusion | Andrea Otto | 653 | 0.69 | +0.69 | |
Australian Citizens | Jeff Davy | 377 | 0.40 | +0.40 | |
Federation | Eleonor Tabone | 367 | 0.39 | +0.39 | |
Total formal votes | 95,191 | 92.11 | −0.43 | ||
Informal votes | 8,159 | 7.89 | +0.43 | ||
Turnout | 103,350 | 90.35 | −2.98 | ||
Notional two-party-preferred count | |||||
National | Sam Birrell | 63,918 | 67.15 | −2.88 | |
Labor | Bill Lodwick | 31,273 | 32.85 | +2.88 | |
Two-candidate-preferred result | |||||
National | Sam Birrell | 51,221 | 53.81 | −16.22 | |
Independent | Rob Priestly | 43,970 | 46.19 | +46.19 | |
National hold |
Party | Candidate | Votes | % | ±% | |
---|---|---|---|---|---|
Labor | Andrew Giles | 42,147 | 46.25 | −14.17 | |
Liberal | Virosh Perera | 19,780 | 21.71 | −0.60 | |
Greens | Patchouli Paterson | 9,953 | 10.92 | +4.25 | |
United Australia | Yassin Albarri | 7,444 | 8.17 | +3.13 | |
One Nation | Ursula van Bree | 5,907 | 6.48 | +6.48 | |
Liberal Democrats | Eric Koelmeyer | 3,422 | 3.76 | +3.76 | |
Victorian Socialists | Cameron Rowe | 2,469 | 2.71 | +2.71 | |
Total formal votes | 91,122 | 94.31 | −0.47 | ||
Informal votes | 5,494 | 5.69 | +0.47 | ||
Turnout | 96,616 | 88.98 | −3.25 | ||
Two-party-preferred result | |||||
Labor | Andrew Giles | 59,761 | 65.58 | −6.08 | |
Liberal | Virosh Perera | 31,361 | 34.42 | +6.08 | |
Labor hold | Swing | −6.08 |
Party | Candidate | Votes | % | ±% | |
---|---|---|---|---|---|
Liberal | Dan Tehan | 44,948 | 44.46 | −6.63 | |
Independent | Alex Dyson | 19,504 | 19.29 | +9.64 | |
Labor | Gilbert Wilson | 19,303 | 19.09 | −6.85 | |
Greens | Hilary McAllister | 6,444 | 6.37 | −0.39 | |
United Australia | Craige Kensen | 3,308 | 3.27 | −2.27 | |
One Nation | Ronnie Graham | 3,275 | 3.24 | +3.24 | |
Independent | Graham Garner | 2,346 | 2.32 | +2.32 | |
Liberal Democrats | Amanda Mead | 1,973 | 1.95 | +1.95 | |
Total formal votes | 101,101 | 94.75 | −1.47 | ||
Informal votes | 5,603 | 5.25 | +1.47 | ||
Turnout | 106,704 | 92.22 | −2.84 | ||
Notional two-party-preferred count | |||||
Liberal | Dan Tehan | 59,722 | 59.07 | −1.10 | |
Labor | Gilbert Wilson | 41,379 | 40.93 | +1.10 | |
Two-candidate-preferred result | |||||
Liberal | Dan Tehan | 54,517 | 53.92 | −6.24 | |
Independent | Alex Dyson | 46,584 | 46.08 | +46.08 | |
Liberal hold |
Party | Candidate | Votes | % | ±% | |
---|---|---|---|---|---|
Labor | Peter Khalil | 35,449 | 38.87 | −5.39 | |
Greens | Sarah Jefford | 25,793 | 28.28 | +2.01 | |
Liberal | Tom Wright | 15,771 | 17.29 | −0.76 | |
United Australia | Irene Zivkovic | 3,352 | 3.68 | +0.54 | |
Socialist Alliance | Sue Bolton | 3,096 | 3.39 | +3.39 | |
Victorian Socialists | Emma Black | 2,714 | 2.98 | −1.53 | |
One Nation | Jill Tindal | 2,554 | 2.80 | +2.80 | |
Animal Justice | Leah Horsfall | 1,680 | 1.84 | −1.92 | |
Federation | Sam Sergi | 789 | 0.87 | +0.87 | |
Total formal votes | 91,198 | 94.95 | −0.77 | ||
Informal votes | 4,855 | 5.05 | +0.77 | ||
Turnout | 96,053 | 88.61 | −2.55 | ||
Notional two-party-preferred count | |||||
Labor | Peter Khalil | 69,104 | 75.77 | +0.06 | |
Liberal | Tom Wright | 22,094 | 24.23 | −0.06 | |
Two-candidate-preferred result | |||||
Labor | Peter Khalil | 53,415 | 58.57 | +0.10 | |
Greens | Sarah Jefford | 37,783 | 41.43 | −0.10 | |
Labor hold | Swing | +0.10 |
The Division of Corangamite is an Australian electoral division in the state of Victoria. The division was proclaimed in 1900, and was one of the original 65 divisions to be contested at the first federal election. It is named for Lake Corangamite, although the lake no longer falls within the division's boundaries.
The Division of Ballarat is an Australian electoral division in the state of Victoria. The division was proclaimed in 1900, and was one of the original 65 divisions to be contested at the first federal election. It was named for the provincial city of the same name by Scottish squatter Archibald Yuille, who established the first settlement − his sheep run called Ballaarat − in 1837, with the name derived from a local Wathawurrung word for the area, balla arat, thought to mean "resting place".
The Division of Batman was an Australian Electoral Division in the state of Victoria. It took its name from John Batman, one of the founders of the city of Melbourne. The division was created in 1906, replacing the Division of Northern Melbourne, and was abolished in 2019 and replaced by the Division of Cooper.
The Division of Chisholm is an Australian Electoral Division in Victoria located in the eastern suburbs of Melbourne. The Division was created in 1949 and is named after Caroline Chisholm, a social worker and promoter of women's immigration. The Division is an Inner Metropolitan area.
The Division of Corio is an Australian electoral division in the state of Victoria. The division was proclaimed in 1900, and was one of the original 65 divisions to be contested at the first federal election. Named for Corio Bay, it has always been based on the city of Geelong, although in the past it stretched as far east as the outer western suburbs of Melbourne.
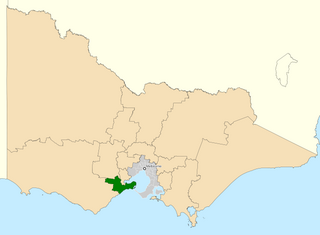
The Division of Dunkley is an Australian electoral division in the state of Victoria. The division is located south-east of Melbourne on the Mornington Peninsula. It covers an area of approximately 152 square kilometres (59 sq mi) from Seaford in the north to Mount Eliza in the south and Langwarrin South in the southeast. Following the 2024 Dunkley by-election, Jodie Belyea currently represents the seat.
The Division of Gellibrand is an Australian Electoral Division in Victoria. The division was created in 1949 and is named after Joseph Gellibrand, a pioneer settler of the Melbourne area. It is located in the industrial inner western suburbs of Melbourne and includes Altona, Altona North, Altona Meadows, Kingsville, Laverton, Newport, Seabrook, Seaholme, Seddon, South Kingsville, Spotswood, Williamstown, Williamstown North and Yarraville; and parts of Brooklyn, Footscray, Laverton North, Point Cook, West Footscray and Williams Landing.
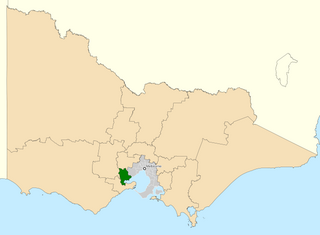
The Division of Holt is an Australian Electoral Division in Victoria. It is located in the outer south-eastern suburbs of Melbourne, including Blind Bight, Botanic Ridge, Cannons Creek, Clyde, Cranbourne, Devon Meadows, Hampton Park, Junction Village, Lynbrook, and Warneet; and parts of Clyde North, Lyndhurst, Narre Warren South, Pearcedale and Tooradin.
The Division of Wills is an Australian electoral division of Victoria. It is currently represented by Peter Khalil of the Australian Labor Party.
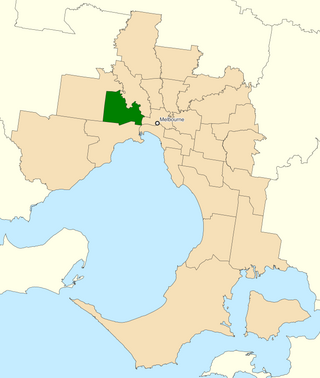
The Division of Jagajaga is an Australian Electoral Division in the state of Victoria. It is located in the north-eastern suburbs of Melbourne, and lies north of the Yarra River. It covers an area of approximately 137 square kilometres and comprises the suburbs of Bellfield, Briar Hill, Eaglemont, Eltham, Eltham North, Greensborough, Heidelberg, Heidelberg Heights, Heidelberg West, Ivanhoe, Ivanhoe East, Lower Plenty, Montmorency, North Warrandyte, Plenty, Rosanna, St Helena, Viewbank, Yallambie, Watsonia and Watsonia North; and parts of Bundoora, and Macleod.
The Division of Lalor "law-lor" is an Australian Electoral Division in the state of Victoria. Located in the south-western suburbs of Melbourne, it includes the south-western hub of Werribee as well as the suburbs of Hoppers Crossing, Tarneit, Truganina, Wyndham Vale and part of Point Cook.
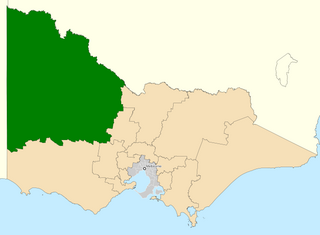
The Division of Mallee is an Australian Electoral Division in the state of Victoria. It is located in the far north-west of the state, adjoining the border with South Australia in the west, and the Murray River in the north. At 81,962 square kilometres (31,646 sq mi), it is the largest Division in Victoria. It includes the centres of Mildura, Ouyen, Swan Hill, St Arnaud, Warracknabeal, Stawell, Horsham and Maryborough.
The Division of Mitchell is an Australian electoral division in the state of New South Wales.
This is a list of electoral results for the Division of Wills in Australian federal elections from the division's creation in 1949 until the present.
The Division of Monash is an Australian Electoral Division in the state of Victoria, which was contested for the first time at the 2019 federal election.
The Division of Fraser is an Australian electoral division in the state of Victoria, which was contested for the first time at the 2019 federal election.
This is a list of electoral division results for the 2019 Australian federal election in the state of Victoria. Victoria bucked the national trend, seeing a swing from the Coalition to Labor, whereas the swing across Australia was from Labor to the Coalition.
The Division of Hawke is an Australian electoral division in the state of Victoria, which was contested for the first time at the 2022 Australian federal election. The electorate is centred on the localities of Bacchus Marsh, Ballan, Melton and Sunbury to the west and north-west of Melbourne.
The number of seats won by each party in the Australian House of Representatives at the 2022 federal election were: Coalition 58, Labor 77, Australian Greens 4, Centre Alliance 1, Katter's Australian Party 1, and Independents 10.
This is a list of electoral results for the Division of Hawke in Australian federal elections from the division's creation in 2022 until the present.