Results of the 2022 Australian federal election (House of Representatives)

Last updated

Contents

2022 Australian federal election
(House of Representatives)
Flag of Australia (converted).svg
  2019 21 May 2022 (2022-05-21)

All 151 seats in the Australian House of Representatives
76 seats needed for a majority
Turnout89.82%
PartyLeader%Seats+/–
Labor Anthony Albanese 32.58%77+9
Liberal Scott Morrison 23.89%27−17
Liberal National David Crisafulli [lower-alpha 1] 8.03%21−2
National Barnaby Joyce 3.61%100
Greens Adam Bandt 12.22%4+3
Katter's Australian Bob Katter [lower-alpha 2] 0.38%10
Centre Alliance Rebekha Sharkie [lower-alpha 3] 0.25%10
Independent [lower-alpha 4] 5.29%10+7
This lists parties that won seats. See the complete results below.
Prime Minister beforePrime Minister after
Scott Morrison 2014 crop.jpg Scott Morrison
Coalition
Anthony Albanese
Labor
Anthony Albanese portrait (cropped).jpg

The number of seats won by each party in the Australian House of Representatives at the 2022 federal election were: Coalition 58, Labor 77, Australian Greens 4, Centre Alliance 1, Katter's Australian Party 1, and Independents 10. [1]

This election was held using instant-runoff voting. In almost all the districts, the candidate who led in the first count was elected. Overall, only in 13 districts did a candidate who did not lead in the first count succeed in taking a seat in the end.

Australia

Government (77)

.mw-parser-output .legend{page-break-inside:avoid;break-inside:avoid-column}.mw-parser-output .legend-color{display:inline-block;min-width:1.25em;height:1.25em;line-height:1.25;margin:1px 0;text-align:center;border:1px solid black;background-color:transparent;color:black}.mw-parser-output .legend-text{}
Labor (77)

Opposition (58)
Coalition

Liberal (27)

LNP (Qld) (21)

National (10)

Crossbench (16)

Independent (10)

Greens (4)

Centre Alliance (1)

Katter's Australian (1) Aus House of Reps June 2022.svg
Government (77)
  Labor (77)

Opposition (58)
Coalition
  Liberal (27)
  LNP (Qld) (21)
  National (10)

Crossbench (16)
  Independent (10)
  Greens (4)
  Centre Alliance (1)
  Katter's Australian (1)
House of Representatives (IRV – Turnout 89.82% (CV) [2] [3]
Australian House of Representatives 2022.svg
PartyPrimary voteSeats
Votes %Swing (pp)SeatsChange
 
  Liberal 3,502,71323.89−4.0927Decrease2.svg 17
  Liberal National (Qld) 1,172,5158.00−0.6821Decrease2.svg 2
  National 528,4423.60−0.9010Steady2.svg
  Country Liberal (NT)29,6640.20−0.070Steady2.svg
Liberal/National Coalition 5,233,33435.70−5.7358Decrease2.svg 19
  Labor 4,776,03032.58−0.7677Increase2.svg9
  Greens 1,795,98512.25+1.854Increase2.svg 3
  One Nation 727,4644.96+1.890Steady2.svg
  United Australia 604,5364.12+0.690Steady2.svg
  Liberal Democrats 252,9631.73+1.490Steady2.svg
  Animal Justice 87,4510.60–0.220Steady2.svg
  Australian Federation 57,5550.39+0.390Steady2.svg

  Katter's Australian 55,8630.38−0.111Steady2.svg

  Centre Alliance 36,5000.25−0.081Steady2.svg

  Western Australia 33,2630.23+0.050Steady2.svg
  Great Australian 30,3920.21+0.170Steady2.svg
  Victorian Socialists 27,2260.19+0.100Steady2.svg
  Informed Medical Options 25,8500.18+0.170Steady2.svg
  Jacqui Lambie Network 23,7300.16+0.160Steady2.svg
  Australian Christians 19,8670.14−0.030Steady2.svg
  Shooters, Fishers and Farmers 18,4220.13–0.160Steady2.svg
  Fusion 13,3190.09+0.090Steady2.svg
  Socialist Alliance 11,9710.08+0.060Steady2.svg
  Indigenous-Aboriginal 7,3260.05+0.050Steady2.svg
  Justice 6,4940.04–0.150Steady2.svg
  TNL 6,3310.04+0.040Steady2.svg
  Legalise Cannabis 6,0250.04+0.040Steady2.svg
  Australian Values 5,6220.04+0.040Steady2.svg
  Australian Citizens 4,8860.03+0.010Steady2.svg
  Local 4,2540.03+0.030Steady2.svg
  Sustainable Australia 3,8660.03–0.220Steady2.svg
  Democratic Alliance 2,2150.02+0.020Steady2.svg
  Reason 1,4580.01–0.050Steady2.svg
  Australian Progressives 1,0630.01–0.040Steady2.svg
  Australian Democrats 6510.00–0.010Steady2.svg

  Independents 776,1695.29+1.9210Increase2.svg 7

Total14,659,042100.00151Steady2.svg
Two-party-preferred vote
Labor 7,642,16152.13+3.66
Liberal/National Coalition 7,016,88147.87−3.66
Invalid/blank votes802,3375.19–0.35
Turnout15,461,37989.82–2.07
Registered voters17,213,433
Source: AEC for both votes and seats

Maps

States

New South Wales

2022 Australian federal election
(New South Wales)
Flag of New South Wales.svg
  2019 21 May 2022

All 47 New South Wales seats in the Australian House of Representatives
and 6 seats in the Australian Senate
 First partySecond party
  Anthony Albanese portrait (cropped).jpg Prime Minister of Australia Scott Morrison.jpg
Leader Anthony Albanese Scott Morrison
Party Labor Liberal/National coalition
Last election24 seats22 seats
Seats won2616
Seat changeIncrease2.svg 2Decrease2.svg 6
Popular vote1,552,6841,699,324
Percentage33.38%36.54%
SwingDecrease2.svg 1.18Decrease2.svg 6.01
TPP 51.42%48.58%
TPP swingIncrease2.svg 3.20Decrease2.svg 3.20

2022 Australian federal election in New South Wales.svg
Results by division for the House of Representatives, shaded by winning party's margin of victory.
House of Representatives (IRV) – Turnout 90.63% (CV)
PartyVotes %Swing (pp)SeatsChange (seats)
   Liberal Party of Australia 1,316,13428.30−4.499Decrease2.svg 6
  National Party of Australia 383,1898.24−1.527Steady2.svg 0
Liberal/National Coalition 1,699,32436.54−6.0116Decrease2.svg 6
  Australian Labor Party 1,552,68433.38−1.1826Increase2.svg 2
  Australian Greens 466,06910.02+1.310Steady2.svg
  Pauline Hanson's One Nation 224,9654.84+3.530Steady2.svg
  United Australia Party 183,1743.94+0.560Steady2.svg
  Liberal Democratic Party 96,8982.08+1.650Steady2.svg
  Animal Justice Party 16,9790.37−0.290Steady2.svg
  Shooters, Fishers and Farmers Party 14,7270.32−0.080Steady2.svg
  Informed Medical Options Party 14,1710.30+0.270Steady2.svg
  Fusion 8,5200.18+0.180Steady2.svg
  Indigenous-Aboriginal Party of Australia 7,3260.16+0.160Steady2.svg
  Sustainable Australia 3,4230.07−0.530Steady2.svg
  Australian Federation Party 2,6470.06+0.060Steady2.svg
  Australian Citizens Party 2,3720.05+0.050Steady2.svg
  TNL 1,7040.04+0.040Steady2.svg
  Socialist Alliance 1,5180.03+0.030Steady2.svg
  Drew Pavlou Democratic Alliance 1,2080.03+0.030Steady2.svg
  Australian Democrats 6510.01+0.010Steady2.svg
  Independent 351,6207.56+2.945Increase2.svg 4
 Non Affiliated9610.02+0.020Steady2.svg
Total4,650,940100.0047Steady2.svg
Invalid/blank votes308,6446.22−0.79
Turnout4,959,58490.70−1.46
Registered voters5,467,993
Two-party-preferred vote
Labor 2,391,30151.42+3.20
Liberal/National Coalition 2,259,63948.58−3.20
Source: AEC for both and


Victoria

2022 Australian federal election
(Victoria)
Flag of Victoria (Australia).svg
  2019 21 May 2022

All 39 Victorian seats in the Australian House of Representatives
and 6 seats in the Australian Senate
 First partySecond partyThird party
  Anthony Albanese portrait (cropped).jpg Prime Minister of Australia Scott Morrison.jpg Adam-Bandt-profile-2021 (Cropped).png
Leader Anthony Albanese Scott Morrison Adam Bandt
Party Labor Liberal/National coalition Greens
Last election21 seats15 seats1 seat
Seats won24 seats11 seats1 seat
Seat changeIncrease2.svg 3Decrease2.svg 4Steady2.svg
Popular vote1,230,8421,239,280514,893
Percentage32.85%33.08%13.74%
SwingDecrease2.svg 4.01Decrease2.svg 5.18Increase2.svg 1.85
TPP 54.83%45.17%
TPP swingIncrease2.svg 1.69Decrease2.svg 1.69

2022 Australian federal election in Victoria.svg
Results by division for the House of Representatives, shaded by winning party's margin of victory.
House of Representatives (IRV) [4] – Turnout 90.59% (CV)
PartyVotes %Swing (pp)SeatsChange (seats) [lower-alpha 6]
   Liberal Party of Australia 1,105,71829.51−5.378Decrease2.svg 4
  National Party of Australia 133,5623.57−0.133Steady2.svg 0
Liberal/National Coalition 1,239,28033.08−5.1811Decrease2.svg 4
  Australian Labor Party 1,230,84232.85−4.0124Increase2.svg 3
  Australian Greens 514,89313.74+1.851Steady2.svg
  United Australia Party 177,7454.74+1.100Steady2.svg
  Pauline Hanson's One Nation 143,5583.83+2.880Steady2.svg
  Liberal Democratic Party 94,6262.53+2.530Steady2.svg
  Animal Justice Party 28,2050.75−0.370Steady2.svg
  Victorian Socialists 27,2260.73+0.390Steady2.svg
  Australian Federation Party 20,4390.55+0.550Steady2.svg
  Derryn Hinch's Justice Party 6,4940.17−0.560Steady2.svg
  Socialist Alliance 5,5400.15+0.150Steady2.svg
  The Great Australian Party 4,8800.13+0.060Steady2.svg
  TNL 2,4050.06+0.060Steady2.svg
  Fusion 2,2380.06+0.060Steady2.svg
  Australian Citizens Party 2,0170.05−0.040Steady2.svg
  Reason Party 1,4580.04−0.200Steady2.svg
  Sustainable Australia 4430.01−0.170Steady2.svg
  Australian Values Party 1520.00+0.000Steady2.svg
  Independent 243,9926.51+2.593Increase2.svg 2
Total3,746,433100.0039Increase2.svg1
Invalid/blank votes185,1744.71+0.05
Turnout3,931,60790.59−2.03
Registered voters4,339,960
Two-party-preferred vote
Labor 2,023,88054.58+1.44
Liberal/National Coalition 1,684,52845.42−1.44
Source: AEC for both votes and seats


Queensland

2022 Australian federal election
(Queensland)
Flag of Queensland.svg
  2019 21 May 2022

All 30 Queensland seats in the Australian House of Representatives
and 6 seats in the Australian Senate
 First partySecond party
  Prime Minister of Australia Scott Morrison.jpg Anthony Albanese portrait (cropped).jpg
Leader Scott Morrison Anthony Albanese
Party Liberal/National coalition Labor
Last election23 seats6 seats
Seats won21 seats5 seats
Seat changeDecrease2.svg 2Decrease2.svg 1
Popular vote1,172,515811,069
Percentage39.64%27.42%
SwingDecrease2.svg 4.06Increase2.svg 0.74
TPP 54.05%45.95%
TPP swingDecrease2.svg 4.39Increase2.svg 4.39

 Third partyFourth party
  Adam-Bandt-profile-2021 (Cropped).png Bob Katter 2016.png
Leader Adam Bandt Bob Katter
Party Greens Katter's Australian
Last election0 seats1 seat
Seats won3 seats1 seat
Seat changeIncrease2.svg 3Steady2.svg
Popular vote382,90055,863
Percentage12.94%1.89%
SwingIncrease2.svg 2.62Decrease2.svg 0.58

2022 Australian federal election in Queensland.svg
Results by division for the House of Representatives, shaded by winning party's margin of victory.
House of Representatives (IRV) – Turnout 88.16% (CV)
PartyVotes %Swing (pp)SeatsChange (seats)
  Liberal National Party (Qld) 1,172,51539.64−4.0621Decrease2.svg 2
  Australian Labor Party 811,06927.42+0.745Decrease2.svg 1
  Australian Greens 382,90012.94+2.623Increase2.svg 3
  Pauline Hanson's One Nation 221,6407.49−1.370Steady2.svg
  United Australia Party 149,2555.05+1.540Steady2.svg
  Katter's Australian Party 55,8631.89−0.581Steady2.svg
  Liberal Democratic Party 28,7370.97+0.520Steady2.svg
  Animal Justice Party 24,8130.84+0.400Steady2.svg
  Informed Medical Options Party 10,8940.37+0.370Steady2.svg
  Australian Federation Party 8,1950.28+0.280Steady2.svg
  The Great Australian Party 7,7750.26+0.260Steady2.svg
  Legalise Cannabis 6,0250.20+0.200Steady2.svg
  Australian Values Party 5,4700.18+0.180Steady2.svg
  Socialist Alliance 3,7290.13+0.080Steady2.svg
  Shooters, Fishers and Farmers Party 3,6950.12+0.120Steady2.svg
  TNL 1,9710.07+0.070Steady2.svg
  Fusion 9300.03+0.030Steady2.svg
  Australian Progressives 6060.02−0.010Steady2.svg
  Independent 61,9442.09+0.820Steady2.svg
Total2,958,026100.0030Steady2.svg
Invalid/blank votes128,7324.17−0.78
Turnout3,086,75888.16–3.06
Registered voters3,501,287
Two-party-preferred vote
  Liberal National 1,598,80254.05–4.39
  Labor 1,359,22445.95+4.39
Source: AEC for both votes and seats


Western Australia

2022 Australian federal election
(Western Australia)
Flag of Western Australia.svg
  2019 21 May 2022 Next  

All 15 Western Australian seats in the Australian House of Representatives
and 6 (of 12) Western Australian seats in the Australian Senate
 First partySecond party
  Anthony Albanese portrait (cropped).jpg Prime Minister of Australia Scott Morrison.jpg
Leader Anthony Albanese Scott Morrison
Party Labor Liberal/National coalition
Last election5 seats11 seats
Seats won95
Seat changeIncrease2.svg 4Decrease2.svg 6
Popular vote542,667512,414
Percentage36.84%34.78%
SwingIncrease2.svg 7.04Decrease2.svg 10.44
TPP 55.00%45.00%
TPP swingIncrease2.svg 10.55Decrease2.svg 10.55

2022 Australian federal election in Western Australia.svg
Results by division for the House of Representatives, shaded by winning party's margin of victory.
House of Representatives (IRV) – Turnout 87.99% (CV)
PartyVotes %Swing (pp)SeatsChange (seats)
  Labor 542,66736.84+7.049Increase2.svg 4
   Liberal 503,25434.16−9.635Decrease2.svg 6
  National 9,1600.62−0.810Steady2.svg
Coalition total 512,41434.78−10.445Decrease2.svg 6
  Greens 184,09412.50+0.880Steady2.svg
  One Nation 58,2263.95−1.360Steady2.svg
  United Australia 33,8632.30+0.270Steady2.svg
  Western Australia 33,2632.26+0.460Steady2.svg
  Christians 19,8671.35−0.350Steady2.svg
  Great Australian 16,5531.12+1.060Steady2.svg
  Australian Federation 15,9201.08+1.080Steady2.svg
  Liberal Democrats 12,8970.88+0.880Steady2.svg
  Animal Justice 5,5240.37+0.280Steady2.svg
  Socialist Alliance 1,1840.08+0.010Steady2.svg
  Informed Medical Options 7850.05+0.050Steady2.svg
  Independents 35,9682.44+1.341Increase2.svg 1
Total1,473,225100.0015Decrease2.svg 1
Invalid/blank votes86,0575.52+0.08
Turnout1,559,28287.99−2.06
Registered voters1,772,065
Two-party-preferred vote
  Labor 810,20655.00+10.55
  Liberal 663,01945.00−10.55
Source: AEC for both votes and seats


South Australia

2022 Australian federal election
(South Australia)
Flag of South Australia.svg
  2019 21 May 2022

All 10 South Australian seats in the Australian House of Representatives
and 6 seats in the Australian Senate
 First partySecond partyThird party
  Anthony Albanese portrait (cropped).jpg Prime Minister of Australia Scott Morrison.jpg
CA
Leader Anthony Albanese Scott Morrison No leader
Party Labor Liberal/National coalition Centre Alliance
Last election5 seats4 seats 1 seat
Seats won631
Seat changeIncrease2.svg 1Decrease2.svg 1Steady2.svg
Popular vote378,329390,19536,500
Percentage34.46%35.54%3.32%
SwingDecrease2.svg 0.92Decrease2.svg 5.29Decrease2.svg 1.06
TPP 53.97%46.03%
TPP swingIncrease2.svg 3.26Decrease2.svg 3.26

2022 Australian federal election in South Australia.svg
Results by division for the House of Representatives, shaded by winning party's margin of victory.
House of Representatives (IRV) – Turnout 91.07% (CV)
PartyVotes %SwingSeatsChange
   Liberal 387,66435.31–5.263Decrease2.svg 1
  National 2,5310.23–0.030Steady2.svg
Liberal/National Coalition 390,19535.54−5.293Decrease2.svg 1
  Labor 378,32934.46–0.926Increase2.svg 1
  Greens 140,22712.77+3.160Steady2.svg
  One Nation 53,0574.83+3.990Steady2.svg
  United Australia 42,6883.89–0.400Steady2.svg
  Centre Alliance 36,5003.32–1.061Steady2.svg
  Australian Federation 10,3540.94+0.940Steady2.svg
  Animal Justice 7,1580.65–2.130Steady2.svg
  Liberal Democrats 5,2480.48+0.480Steady2.svg
  Fusion 1,6310.15+0.150Steady2.svg
  Great Australian 1,1840.11+0.110Steady2.svg
  Democratic Alliance 1,0070.09+0.090Steady2.svg
  Progressives 4570.04–0.010Steady2.svg
  TNL 2510.02+0.020Steady2.svg
  Independents 29,5002.69+1.480Steady2.svg
Total1,097,78610
Invalid/blank votes59,2225.12+0.31
Turnout1,157,00891.07–2.00
Registered voters1,270,400
Two-party-preferred vote
  Labor 592,51253.97+3.26
  Liberal 505,27446.03–3.26
Source: AEC for both votes and seats


Tasmania

2022 Australian federal election
(Tasmania)
Flag of Tasmania.svg
  2019 21 May 2022

All 5 Tasmanian seats in the Australian House of Representatives
and 6 seats in the Australian Senate
 First partySecond party
  Anthony Albanese portrait (cropped).jpg Prime Minister of Australia Scott Morrison.jpg
Leader Anthony Albanese Scott Morrison
Party Labor Liberal
Last election2 seats2 seats
Seats won22
Seat changeSteady2.svgSteady2.svg
Popular vote95,322115,184
Percentage27.26%32.94%
SwingDecrease2.svg 6.35Increase2.svg 2.31
TPP 54.33%45.67%
TPP swingDecrease2.svg 1.63Increase2.svg 1.63

2022 Australian federal election in Tasmania.svg
Results by division for the House of Representatives, shaded by winning party's margin of victory.
House of Representatives (IRV) – Turnout 92.43% (CV)
PartyVotes %Swing (pp)SeatsChange (seats)
  Liberal Party of Australia 115,18432.94+2.312Steady2.svg
  Australian Labor Party 95,32227.26−6.352Steady2.svg
  Australian Greens 41,97212.00+1.880Steady2.svg
  Jacqui Lambie Network 23,7306.79+6.790Steady2.svg
  Pauline Hanson's One Nation 13,9703.99+1.200Steady2.svg
  United Australia Party 6,4371.84−3.010Steady2.svg
  Liberal Democratic Party 5,0641.45+1.450Steady2.svg
  Animal Justice Party 4,7721.36+0.880Steady2.svg
  Local Party 4,2541.22+1.220Steady2.svg
  Independent 38,99311.50−1.841Steady2.svg
Total349,6985Steady2.svg
Invalid/blank votes21,7345.85+1.46
Turnout371,43292.43–1.91
Registered voters401,852
Two-party-preferred vote
  Labor 189,99354.33−1.63
  Liberal 159,70545.67+1.63
Source: AEC for both votes and seats

Territories

Australian Capital Territory

2022 Australian federal election
(Australian Capital Territory)
Flag of the Australian Capital Territory.svg
  2019 21 May 2022

All 3 Australian Capital Territory seats in the Australian House of Representatives
and all 2 seats in the Australian Senate
 First partySecond party
  Anthony Albanese portrait (cropped).jpg Prime Minister of Australia Scott Morrison.jpg
Leader Anthony Albanese Scott Morrison
Party Labor Liberal
Last election3 seats0 seats
Seats won3 seats0 seats
Seat changeSteady2.svgSteady2.svg
Popular vote126,59574,759
Percentage44.89%26.51%
SwingIncrease2.svg 3.80Decrease2.svg 4.81
TPP 66.95%33.05%
TPP swingIncrease2.svg 5.34Decrease2.svg 5.34

2022 Australian federal election in the Australian Capital Territory.svg
Results by division for the House of Representatives, shaded by winning party's margin of victory.
House of Representatives (IRV) – Turnout 92.07% (CV)
PartyVotes %Swing (pp)SeatsChange (seats)
  Australian Labor Party 126,59544.89+3.803Steady2.svg
  Liberal Party of Australia 74,75926.51−4.810Steady2.svg
  Australian Greens 52,64818.67+1.820Steady2.svg
  United Australia Party 6,8642.43−0.250Steady2.svg
  Pauline Hanson's One Nation 6,6302.35+2.350Steady2.svg
  Liberal Democratic Party 1,7060.60–0.350Steady2.svg
  Independent 12,7954.54+0.120Steady2.svg
Total281,997100.003Steady2.svg
Invalid/blank votes7,1162.46−1.03
Turnout289,11392.07–1.08
Registered voters314,025
Two-party-preferred vote
  Labor 188,79966.95+5.34
  Liberal 93,19833.05–5.34
Source: AEC for both votes and seats

Northern Territory

2022 Australian federal election
(Northern Territory)
Flag of the Northern Territory.svg
  2019 21 May 2022

All 2 Northern Territory seats in the Australian House of Representatives
and all 2 seats in the Australian Senate
 First partySecond party
  Anthony Albanese portrait (cropped).jpg Prime Minister of Australia Scott Morrison.jpg
Leader Anthony Albanese Scott Morrison
Party Labor Coalition
Last election2 seats0 seats
Seats won20
Seat changeSteady2.svgSteady2.svg
Popular vote38,52229,664
Percentage38.16%29.39%
SwingDecrease2.svg 4.11Decrease2.svg 8.13
TPP 55.54%44.46%
TPP swingIncrease2.svg 1.34Decrease2.svg 1.34

2022 Australian federal election in the Northern Territory.svg
Results by division for the House of Representatives, shaded by winning party's margin of victory.
House of Representatives (IRV) – Turnout 73.08% (CV)
PartyVotes %Swing (pp)SeatsChange (seats)
  Australian Labor Party 38,52238.16−4.112Steady2.svg
  Country Liberal Party 29,66429.39−8.130Steady2.svg
  Australian Greens 13,18213.06+2.910Steady2.svg
  Liberal Democratic Party 7,7877.71+7.710Steady2.svg
  Pauline Hanson's One Nation 5,4185.37+5.370Steady2.svg
  United Australia Party 4,5104.47+1.620Steady2.svg
  Australian Citizens Party 4970.49+0.490Steady2.svg
  Independent 1,3571.34−3.300Steady2.svg
Total100,937100.002Steady2.svg
Invalid/blank votes5,6585.31+0.62
Turnout106,59573.08–4.86
Registered voters145,851
Two-party-preferred vote
  Labor 56,06555.54+1.34
  Liberal 44,87244.46–1.34
Source: AEC for both votes and seats

Two party preferred preference flow

House of Representatives (IRV – Turnout 89.82% (CV) [5] [6]
PartyCoalitionLabor
Votes %±Votes %±
  Greens 257,56614.34%–3.451,538,41985.66%+3.45
  One Nation 467,76864.30%–0.92259,69635.70%+0.92
  United Australia Party 373,98861.86%–3.36230,54838.14%+3.36
  Liberal Democratic Party 181,65971.81%–5.4371,30428.19%+5.43
  Animal Justice Party 31,73636.29%–2.1355,71563.71%+2.13
  Australian Federation Party 32,46656.41%25,08943.59%

  Katter's Australian 34,25161.31%–5.7321,61238.69%+5.73

  Centre Alliance 14,51339.76%+6.8621,98760.24%–6.86

  Western Australia Party 14,74144.32%–4.5618,52255.68%+4.56
  The Great Australian Party 15,89152.29%–0.7814,50147.71%+0.78
  Victorian Socialists 4,50716.55%+4.1422,71983.45%–4.14
  Informed Medical Options Party 13,89653.76%+17.3711,95446.24%–17.37
  Jacqui Lambie Network 9,70940.91%14,02159.09%
  Australian Christians 15,17576.38%–4.414,69223.62%+4.41
  Shooters, Fishers and Farmers Party 10,79858.61%–0.457,62441.39%+0.45
  Fusion 4,09130.72%–1.829,22869.28%+1.82
  Socialist Alliance 3,03525.35%+5.058,93674.65%–5.05
  Indigenous-Aboriginal Party of Australia 3,49547.71%3,83152.29%
  Derryn Hinch's Justice Party 3,12848.17%+1.933,36651.83%–1.93
  TNL 2,26835.82%4,06364.18%
  Legalise Cannabis 2,57442.72%3,45157.28%
  Australian Values Party 3,07654.71%2,54645.29%
  Australian Citizens Party 2,17144.43%+18.012,71555.57%–18.01
  Local Party 99723.44%3,25776.56%
  Sustainable Australia 1,35134.95%–11.062,51565.05%+11.06
  Drew Pavlou Democratic Alliance 94042.44%1,27557.56%
  Reason Party 28119.27%–11.941,17780.73%+11.94
  Australian Progressives 25123.61%–9.1681276.39%+9.16
  Australian Democrats 22234.10%+3.1542965.90%–3.15

  Independents 281,21136.23%–4.37494,95863.77%+4.37

Total14,659,042100.00151Steady2.svg
Two-party-preferred vote
Labor 7,642,16152.13+3.66
Liberal/National Coalition 7,016,88147.87−3.66
Invalid/blank votes802,3765.19–0.35
Turnout15,461,41889.82–2.07
Registered voters17,213,433
Source: AEC for both votes

Analysis

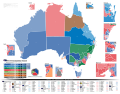
The vast majority of electorates outside Tasmania swung to Labor. This is especially true for inner-city seats. The vast majority of inner-city seats held by the Liberal Party were won by either Labor, teal independents or the Greens.

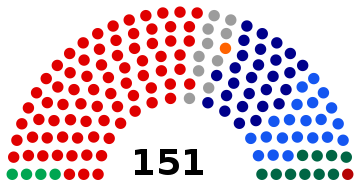
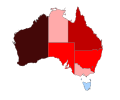
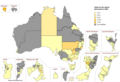
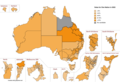
Despite losing the two-party preferred vote both nationally and in every state except Queensland, the Coalition won the first preference vote nationally and in every state except Western Australia and the two territories. Nevertheless, both major parties had swings against them nationally and in all but four states and territories; Labor's vote increased in Queensland, Western Australia and the Australian Capital Territory, while the Liberal Party's vote increased in Tasmania. Tasmania was also the only state that swung to the Coalition on a two-party preferred vote. Outside Tasmania, the Coalition's vote dropped more than Labor's.

The Coalition's losses in seats were limited to the Liberal Party, as the National Party retained all of its seats, despite both Coalition parties having swings against them in the vast majority of seats.

On a two-party preferred basis, few electorates swung to the Coalition outside Victoria and Tasmania. These were the electorates of Calare, Fowler, Gilmore, Lindsay, Page, Parkes, Paterson and Whitlam in New South Wales; Herbert in Queensland; and Lingiari in the Northern Territory.

While teal independents contested a number of Coalition-held seats in every state except Queensland, they were most successful in wealthy inner-city seats, usually held by Moderates, where they were elected on preferences. The seats they gained were all from Liberals: Mackellar, North Sydney and Wentworth in Sydney, Goldstein and Kooyong in Melbourne and Curtin in Perth. These seats are all economically liberal, but environmentally progressive, which has previously seen the Greens finish ahead of Labor in these seats. Furthermore, teals held three other seats before the election (which they subsequently retained): Warringah in Sydney, Clark in Hobart and Indi in regional Victoria. The absence of teal candidates in Queensland may have boosted the Greens vote in inner-city Brisbane, where they won three seats, Brisbane and Ryan from the LNP and Griffith from Labor, which they won in addition to retaining the seat of Melbourne.

Swing table

State/territoryTPP
ALPLNPSwing (to ALP)
Flag of the Australian Capital Territory.svg  Australian Capital Territory 66.95%33.05%+5.34
Flag of New South Wales.svg  New South Wales 51.42%48.58%+3.20
Flag of the Northern Territory.svg  Northern Territory 55.54%44.46%+1.34
Flag of Queensland.svg  Queensland 45.95%54.05%+4.39
Flag of South Australia.svg  South Australia 53.97%46.03%+3.26
Flag of Tasmania.svg  Tasmania 54.33%45.67%–1.63
Flag of Victoria (Australia).svg  Victoria 54.83%45.17%+1.64
Flag of Western Australia.svg  Western Australia 55.00%45.00%+10.55

Notes

  1. This party is a result of the merger between the Liberal and National Parties in Queensland in 2008. It is part of the Coalition, and its MPS sit in either the Liberal or National party rooms, meaning the LNP does not have its own federal leader. The party's leader in the Queensland Parliament, David Crisafulli, did not contest this election.
  2. In 2020 Katter officially handed leadership of the party to his son Robbie Katter, who sits in the Queensland Parliament and did not contest this election.
  3. Sharkie was the only candidate running for Centre Alliance in this election.
  4. 7 of the 10 elected independents were associated with the Teal independents movement, but they were elected as independents with no shared party or leader.
  5. 15 LNP MPs sit in the Liberal party room and 6 in the National party room
  6. Due to Victoria gaining an extra seat with the creation of the Division of Hawke, numbers of seats lost and gained do not add up.

Related Research Articles

<span class="mw-page-title-main">2001 Australian federal election</span> Election for the 40th Parliament of Australia

The 2001 Australian federal election was held in Australia on 10 November 2001. All 150 seats in the House of Representatives and 40 seats in the 76-member Senate were up for election. The incumbent Liberal Party of Australia led by Prime Minister of Australia John Howard and coalition partner the National Party of Australia led by John Anderson defeated the opposition Australian Labor Party led by Kim Beazley. Future Opposition Leader Peter Dutton entered parliament at this election. As of 2023 this was the most recent federal election to have a rematch, when Howard beat Beazley in the 1998 Australian federal election, and until the 2013 Australian federal election, to have both major party leaders running in previous federal elections as party leaders, and the last for both major party leaders to appear in consecutive federal elections as well.

<span class="mw-page-title-main">1998 Australian federal election</span> Election for the 39th Parliament of Australia

The 1998 Australian federal election was held to determine the members of the 39th Parliament of Australia. It was held on 3 October 1998. All 148 seats of the House of Representatives and 40 seats of the 76-seat Senate were up for election. The incumbent centre-right Liberal/National Coalition government led by Prime Minister John Howard of the Liberal Party and coalition partner Tim Fischer of the National Party defeated the centre-left Australian Labor Party opposition led by Opposition Leader Kim Beazley, despite losing the nationwide popular and two-party preferred vote. However, the Australian Labor Party gained seats from the previous election.

<span class="mw-page-title-main">2004 Australian federal election</span> Election for the 41st Parliament of Australia

The 2004 Australian federal election was held in Australia on 9 October 2004. All 150 seats in the House of Representatives and 40 seats in the 76-member Senate were up for election. The incumbent Liberal Party of Australia led by Prime Minister of Australia John Howard and coalition partner the National Party of Australia led by John Anderson defeated the opposition Australian Labor Party led by Mark Latham.

<span class="mw-page-title-main">Coalition (Australia)</span> Group of centre-right political parties in Australia

The Liberal–National Coalition, commonly known simply as the Coalition or the LNP, is an alliance of centre-right political parties that forms one of the two major groupings in Australian federal politics. The two partners in the Coalition are the Liberal Party of Australia and the National Party of Australia. Its main opponent is the Australian Labor Party (ALP); the two forces are often regarded as operating in a two-party system. The Coalition was last in government from 2013 to 2022. The group is led by Peter Dutton, who succeeded Scott Morrison after the 2022 federal election.

The 2004 Australian federal election was held on Saturday 9 October 2004 and it was the Howard government's opportunity to secure its fourth term of government. The Government consisting of the conservative coalition Liberal Party and National Party headed by John Howard and John Anderson respectively were opposed by Mark Latham and the Labor Party.

<span class="mw-page-title-main">Division of Kennedy</span> Australian federal electoral division

The Division of Kennedy is an Australian electoral division in the state of Queensland.

<span class="mw-page-title-main">Two-party-preferred vote</span> Result of election after distribution of preferences

In Australian politics, the two-party-preferred vote is the result of an election or opinion poll after preferences have been distributed to the highest two candidates, who in some cases can be independents. For the purposes of TPP, the Liberal/National Coalition is usually considered a single party, with Labor being the other major party. Typically the TPP is expressed as the percentages of votes attracted by each of the two major parties, e.g. "Coalition 50%, Labor 50%", where the values include both primary votes and preferences. The TPP is an indicator of how much swing has been attained/is required to change the result, taking into consideration preferences, which may have a significant effect on the result.

<span class="mw-page-title-main">2010 Australian federal election</span> Election for the 43rd Parliament of Australia

The 2010 Australian federal election was held on Saturday, 21 August 2010 to elect members of the 43rd Parliament of Australia. The incumbent centre-left Australian Labor Party led by Prime Minister Julia Gillard won a second term against the opposition centre-right Liberal Party of Australia led by Opposition Leader Tony Abbott and Coalition partner the National Party of Australia, led by Warren Truss, after Labor formed a minority government with the support of three independent MPs and one Australian Greens MP.

<span class="mw-page-title-main">2007 Australian Senate election</span> Australian federal election results

The following tables show state-by-state results in the Australian Senate at the 2007 federal election, 37 Coalition, 32 Labor, five Green, one Family First, and one independent, Nick Xenophon. Senators are elected for six-year terms, and took their seats from 1 July 2008, but senators representing the territories have three-year terms and take their seats immediately.

<span class="mw-page-title-main">How-to-vote card</span> Handed-out leaflets in Australian elections with voting instructions

How-to-vote cards (HTV) are small leaflets that are handed out by party supporters during elections in Australia. Voting in the Australian lower house uses a preferential voting system. Voters must rank every candidate on the ballot in order for their vote to count. There are often numerous candidates on the ballot, some with little public profile, so voters may find it difficult to decide on all of them. Parties produce how-to-vote cards ostensibly to help voters. They contain details about the candidate or party as well as instruction how to cast a ranked vote in the order that the party would prefer the voter follow. The flow of preferences can assist the party dispersing the cards directly and indirectly help allied parties.

The following tables show state-by-state results in the Australian House of Representatives at the 2010 federal election, Labor 72, Coalition 72, Nationals (WA) 1, Australian Greens 1, with 4 independents.

<span class="mw-page-title-main">2010 Australian Senate election</span> Australian federal election results

The following tables show state-by-state results in the Australian Senate at the 2010 federal election. Senators total 34 Coalition, 31 Labor, nine Green, one Democratic Labor Party, and one independent, Nick Xenophon. New Senators took their places from 1 July 2011.

<span class="mw-page-title-main">2004 Australian Senate election</span> Australian federal election results

The following tables show state-by-state results in the Australian Senate at the 2004 federal election. Senators total 37 coalition, 28 Labor, four Green, one Family First, two non-coalition National and four Democrats. Senator terms are six years, and took their seats from 1 July 2005, except the territories who took their seats immediately. This is the most recent time a Government has had a majority in the senate.

Katter's Australian Party (KAP) is an agrarian populist political party in Australia that advocates for a synthesis of agrarian socialist economic policies and conservative social policies. It was founded by Bob Katter, an independent and former Nationals MP for the seat of Kennedy, with a registration application lodged to the Australian Electoral Commission in 2011.

The following tables show state-by-state results in the Australian House of Representatives at the 2013 federal election, Coalition 90, Labor 55, Australian Greens 1, Palmer United Party 1, Katter's Australian Party 1, with 2 independents.

<span class="mw-page-title-main">2017 Queensland state election</span>

The 2017 Queensland state election was held on 25 November 2017 to elect all 93 members of the Legislative Assembly of Queensland, the unicameral Parliament of Queensland.

<span class="mw-page-title-main">2020 Queensland state election</span>

The 2020 Queensland state election was held on 31 October to elect all 93 members to the 57th Legislative Assembly of Queensland. The Labor Party was returned to government for a third-term, led by incumbent premier Annastacia Palaszczuk. With 47 seats needed to form a majority government, Labor won 52 seats, including all but five in Brisbane, while the Liberal National Party won 34 seats and formed opposition. On the crossbench, Katter's Australian Party retained its 3 seats, the Queensland Greens picked up South Brisbane for a total of 2, Pauline Hanson's One Nation retained Mirani and independent Sandy Bolton retained her seat of Noosa.

<span class="mw-page-title-main">2022 Australian federal election</span> Election for the 47th Parliament of Australia

The 2022 Australian federal election was held on Saturday 21 May 2022 to elect members of the 47th Parliament of Australia. The incumbent Liberal/National Coalition government, led by Prime Minister Scott Morrison, sought to win a fourth consecutive term in office but was defeated by the opposition Labor Party, led by Anthony Albanese. Up for election were all 151 seats in the lower house, the House of Representatives, as well as 40 of the 76 seats in the upper house, the Senate.

<span class="mw-page-title-main">2024 Queensland state election</span> Election for the 57th Parliament of Queensland

The 2024 Queensland state election is scheduled to be held on 26 October 2024 to elect all members to the Legislative Assembly of Queensland pursuant to the Constitution Amendment Act 2015. As a result of the 2016 Queensland term length referendum, the term of the parliament will run for four years.

<span class="mw-page-title-main">Results of the 2022 Australian federal election in Queensland</span> Federal election results in Queensland, Australia

This is a list of electoral division results for the 2022 Australian federal election in the state of Queensland.

References

  1. "House Party Representation Leading". Aec.gov.au. Retrieved 24 May 2022.
  2. "First preferences by party". Australian Electoral Commission. Retrieved 28 May 2022.
  3. "House Party Representation Leading". aec.gov.au. Retrieved 24 June 2022.
  4. "First preferences by party - VIC". Tally Room. Australian Electoral Commission. 27 May 2022. Retrieved 27 May 2022.
  5. "First preferences by party". Australian Electoral Commission. Retrieved 28 May 2022.
  6. "House Party Representation Leading". aec.gov.au. Retrieved 24 June 2022.