Results of the 1940 Australian federal election (House of Representatives)

Last updated

Australian federal election, 21 September 1940 [1]
House of Representatives
<< 19371943 >>

Contents

Enrolled voters4,239,486
Votes cast3,979,009 Turnout 93.86–1.31
Informal votes101,278Informal2.55–0.04
Summary of votes by party
PartyPrimary votes %SwingSeatsChange
  Labor 1,556,94140.16%–3.01%32+ 3
  United Australia 1,172,78830.24%–3.47%23– 5
  Country 524,04213.51%–2.04%13– 3
  Labor (N-C) 203,0815.24%+5.24%4+ 4
  State Labor 101,1912.61%+2.61%0± 0
  Defence Movement 15,3130.40%+0.40%0± 0
  Protestant Labor 8,3000.21%+0.21%0± 0
  Independent 289,3357.46%+2.57%2± 0
Total3,877,731  74 

This is a list of electoral division results for the Australian 1940 federal election.

New South Wales

Barton

1940 Australian federal election: Barton
PartyCandidateVotes%±%
Labor H. V. Evatt 35,42557.4+16.4
United Australia Albert Lane 21,84535.4−13.9
Labor (N-C) John Rose2,6434.3+4.3
State Labor Sam Lewis 1,1111.8+1.8
Independent John Mackay4840.8+0.8
Defence Movement Robert Mackie1550.3+0.3
Total formal votes61,66397.6
Informal votes1,5392.4
Turnout 63,20296.8
Two-party-preferred result
Labor H. V. Evatt 62.1+13.9
United Australia Albert Lane 37.9−13.9
Labor gain from United Australia Swing +13.9

Calare

1940 Australian federal election: Calare
PartyCandidateVotes%±%
Country Harold Thorby 17,22736.4−11.4
Labor John Breen 12,58926.6−21.2
Labor (N-C) John Heiss6,59213.9+13.9
State Labor Greg McGirr 5,50211.6+11.6
Country Herbert Hodby4,0278.5+8.5
Independent Richard Brazier1,4353.0+3.0
Total formal votes47,37295.9
Informal votes2,0174.1
Turnout 49,38994.0
Two-party-preferred result
Labor John Breen 25,27253.4+5.6
Country Harold Thorby 22,09046.6−5.6
Labor gain from Country Swing +5.6

Cook

1940 Australian federal election: Cook
PartyCandidateVotes%±%
Labor (N-C) Tom Sheehan 31,62558.4+58.4
Labor Jock Garden 17,63432.6−37.7
Independent Labor Cyril Glassop4,9019.0+9.0
Total formal votes54,16096.4
Informal votes2,0413.6
Turnout 56,20195.5
Two-party-preferred result
Labor (N-C) Tom Sheehan 63.6+63.6
Labor Jock Garden 36.4−33.9
Labor (N-C) gain from Labor Swing +33.9

Cowper

1940 Australian federal election: Cowper
PartyCandidateVotes%±%
Country Sir Earle Page 27,77353.7−9.5
Labor Myles Kelly11,35021.9−14.9
Independent Joseph McElhone8,39116.2+16.2
Independent John Cain4,2438.2+8.2
Total formal votes51,75798.3
Informal votes9091.7
Turnout 52,66695.0
Two-party-preferred result
Country Sir Earle Page 64.9+1.7
Labor Myles Kelly33.1−1.7
Country hold Swing −13.0

Dalley

1940 Australian federal election: Dalley
PartyCandidateVotes%±%
Labor (N-C) Sol Rosevear 20,72137.2+37.2
Labor Donald Cochrane 18,64333.5−24.2
United Australia Hubert O'Connell 14,73626.5−15.8
State Labor Edmund Ryan1,5642.8+2.8
Total formal votes55,66497.5
Informal votes1,4232.5
Turnout 57,08795.6
Two-party-preferred result
Labor (N-C) Sol Rosevear 31,84257.2+57.2
Labor Donald Cochrane 23,82242.8−14.9
Labor (N-C) gain from Labor Swing +14.9

Darling

1940 Australian federal election: Darling
PartyCandidateVotes%±%
Labor Joe Clark 29,12863.4−2.8
Independent Alexander Huie 10,64823.2−10.6
Labor (N-C) Les Murphy6,15813.4+13.4
Total formal votes45,93497.4
Informal votes1,2292.6
Turnout 47,16387.3
Two-party-preferred result
Labor Joe Clark 73.5+7.3
Independent Alexander Huie 26.5−7.3
Labor hold Swing +7.3

East Sydney

1940 Australian federal election: East Sydney
PartyCandidateVotes%±%
Labor Eddie Ward 23,68549.1-6.9
United Australia Lewis Nott 12,21125.3-9.7
Labor (N-C) Steve Gould5,54711.5+11.5
United Australia James Catts 2,5085.2+5.2
Independent Fred Aarons2,2644.7+4.7
Independent Diana Gould1,8673.9+3.9
AtokistLouis Phillips1870.4+0.4
Total formal votes48,26995.3
Informal votes2,3864.7
Turnout 50,65590.5
Two-party-preferred result
Labor Eddie Ward 66.1+8.1
United Australia Lewis Nott 33.9-8.1
Labor hold Swing +8.1

Eden-Monaro

1940 Australian federal election: Eden-Monaro
PartyCandidateVotes%±%
Labor Herb Turner16,73634.5-8.0
United Australia John Perkins 13,09227.0-30.5
United Australia Frank Louat 6,17312.7+12.7
United Australia Pat Osborne4,7639.8+9.8
Labor (N-C) Benjamin Kelly4,5759.4+9.4
United Australia Roy May1,1752.4+2.4
Independent George Alam1,0182.1+2.1
Independent Rupert Beale 9872.0+2.0
Total formal votes48,51995.5
Informal votes2,2634.5
Turnout 50,78295.1
Two-party-preferred result
United Australia John Perkins 26,57554.8-2.7
Labor Herb Turner21,94445.2+2.7
United Australia hold Swing -2.7

Gwydir

1940 Australian federal election: Gwydir
PartyCandidateVotes%±%
Labor William Scully 27,23155.4+3.0
Country Ben Wade 13,37327.2-4.6
Country Ernest Batchelor7,73815.8+15.8
Independent Frederick Deakins7881.6+1.6
Total formal votes49,13098.2
Informal votes8811.8
Turnout 50,01192.2
Two-party-preferred result
Labor William Scully 58.8+6.4
Country Ben Wade 41.2-6.4
Labor hold Swing +6.4

Hume

1940 Australian federal election: Hume
PartyCandidateVotes%±%
Country Thomas Collins 21,36942.2−11.9
Labor Clarence Nolan11,58422.9−23.0
Labor (N-C) Arthur Fuller 11,03721.8+21.8
Defence Movement Eric Roberts4,1888.3+8.3
State Labor John Fisher 2,4734.9+4.9
Total formal votes50,66198.0
Informal votes1,0262.0
Turnout 51,68793.8
Two-party-preferred result
Country Thomas Collins 25,79150.9−3.2
Labor Clarence Nolan24,87049.1+3.2
Country hold Swing −3.2

Hunter

1940 Australian federal election: Hunter
PartyCandidateVotes%±%
Labor Rowley James 38,92175.0-25.0
State Labor Bill Gollan12,95625.0+25.0
Total formal votes51,87797.1
Informal votes1,5242.9
Turnout 53,40195.3
Labor hold Swing -25.0

Lang

1940 Australian federal election: Lang
PartyCandidateVotes%±%
Labor (N-C) Dan Mulcahy 23,29838.0+38.0
United Australia Bertram Stevens 15,61525.4-9.7
Labor John Metcalfe12,48720.3-30.1
United Australia Matthew Calman5,6269.2+9.2
State Labor Arthur Robinson3,7386.1+6.1
United Australia Stanley Willmott6081.0+1.0
Total formal votes61,37296.7
Informal votes2,0643.3
Turnout 63,43697.4
Two-party-preferred result
Labor (N-C) Dan Mulcahy 40,51766.0+66.0
United Australia Bertram Stevens 20,85534.0-13.4
Labor (N-C) gain from Labor Swing +13.4

Macquarie

1940 Australian federal election: Macquarie
PartyCandidateVotes%±%
Labor Ben Chifley 22,66044.6-3.3
United Australia John Lawson 20,46840.3-11.8
Labor (N-C) Bernard Cunningham7,66015.1+15.1
Total formal votes50,78898.7
Informal votes6651.3
Turnout 51,45394.2
Two-party-preferred result
Labor Ben Chifley 29,49358.1+10.2
United Australia John Lawson 21,29541.9-10.2
Labor gain from United Australia Swing +10.2

Martin

1940 Australian federal election: Martin
PartyCandidateVotes%±%
United Australia William McCall 28,72750.1-6.0
Labor Raymond Watt20,03635.0-1.6
State Labor Rupert Lockwood 8,55514.9+14.9
Total formal votes57,31898.5
Informal votes8531.5
Turnout 58,17196.6
Two-party-preferred result
United Australia William McCall 52.6-7.7
Labor Raymond Watt47.4+7.7
United Australia hold Swing -7.7

New England

1940 Australian federal election: New England
PartyCandidateVotes%±%
Country Joe Abbott 16,89834.8+34.8
Labor Leigh Cuthbertson16,08533.1-5.9
Country Victor Thompson 11,63524.0-37.0
Country Donald Shand 3,9388.1+8.1
Total formal votes48,55698.0
Informal votes9662.0
Turnout 49,52295.0
Two-party-preferred result
Country Joe Abbott 29,44060.6-0.4
Labor Leigh Cuthbertson19,11639.4+0.4
Country hold Swing -0.4

Newcastle

1940 Australian federal election: Newcastle
PartyCandidateVotes%±%
Labor David Watkins 44,17074.4-4.9
State Labor Tom Hickey9,02915.2+15.2
Independent Arthur Clarke6,19010.4+10.4
Total formal votes59,38997.3
Informal votes1,6492.7
Turnout 61,03895.6
Two-party-preferred result
Labor David Watkins 78.6-0.7
State Labor Tom Hickey21.4+21.4
Labor hold Swing -0.7

North Sydney

1940 Australian federal election: North Sydney
PartyCandidateVotes%±%
United Australia Billy Hughes 38,38161.3-4.6
State Labor William Wilson10,96517.5+17.5
Labor James Dooley 9,70415.5-12.4
Labor (N-C) John Steel3,5265.6+5.6
Total formal votes62,57698.2
Informal votes1,1701.8
Turnout 63,74695.5
Two-party-preferred result
United Australia Billy Hughes 67.6-1.4
State Labor William Wilson32.4+32.4
United Australia hold Swing -1.4

Parkes

1940 Australian federal election: Parkes
PartyCandidateVotes%±%
United Australia Sir Charles Marr 28,90950.5-13.2
Labor Daniel Murphy21,56537.7+1.4
Independent David Knox6,78511.8+11.8
Total formal votes57,25998.6
Informal votes8331.4
Turnout 58,09295.6
Two-party-preferred result
United Australia Sir Charles Marr 57.4-6.3
Labor Daniel Murphy42.6+6.3
United Australia hold Swing -6.3

Parramatta

1940 Australian federal election: Parramatta
PartyCandidateVotes%±%
United Australia Sir Frederick Stewart 25,56142.4-25.5
Labor Albert Rowe 10,55317.5-8.9
United Australia Gordon Wallace 7,43712.3+12.3
United Australia Norman Rydge 7,18911.9+11.9
Labor (N-C) James Dalton5,6399.3+9.3
State Labor Bill Wood3,9526.6+6.6
Total formal votes60,33197.1
Informal votes1,8222.9
Turnout 62,15395.7
Two-party-preferred result
United Australia Sir Frederick Stewart 39,62465.7-4.1
Labor Albert Rowe 20,70734.3+4.1
United Australia hold Swing -4.1

Reid

1940 Australian federal election: Reid
PartyCandidateVotes%±%
Labor (N-C) Joe Gander 18,67731.9+31.9
Labor Charles Morgan 17,60130.0-30.3
Independent UAP Leslie Brown15,47226.4+26.4
State Labor Jack Hughes 6,21110.6+10.6
Independent Edward James6141.0+1.0
Total formal votes58,57596.0
Informal votes2,4524.0
Turnout 61,02795.8
Two-party-preferred result
Labor Charles Morgan 30,43652.0-8.3
Labor (N-C) Joe Gander 28,13948.0+48.0
Labor hold Swing -8.3

Richmond

1940 Australian federal election: Richmond
PartyCandidateVotes%±%
Country Larry Anthony 34,31164.9-5.7
Labor Jim Fredericks16,38031.0+1.7
State Labor Alexander Collingridge2,1464.1+4.1
Total formal votes52,83798.8
Informal votes6471.2
Turnout 53,48494.2
Two-party-preferred result
Country Larry Anthony 66.9-3.7
Labor Jim Fredericks32.1+3.7
Country hold Swing -3.7

Riverina

1940 Australian federal election: Riverina
PartyCandidateVotes%±%
Country Horace Nock 12,35526.6-7.3
Labor Joe Langtry 10,08321.7-18.6
Defence Movement John Hogan7,57116.3+16.3
Country Hugh Roberton 7,19915.5+15.5
Labor (N-C) William Quirk6,72414.5+14.5
Independent Ronald Cuttle1,4083.0+3.0
State Labor Charles Lenon1,1772.5+2.5
Total formal votes46,51795.4
Informal votes2,2614.6
Turnout 48,77892.6
Two-party-preferred result
Labor Joe Langtry 23,98051.6+8.8
Country Horace Nock 22,53748.4-8.8
Labor gain from Country Swing +8.8

Robertson

1940 Australian federal election: Robertson
PartyCandidateVotes%±%
Labor Thomas Williams 17,71233.2-11.0
United Australia Eric Spooner 14,80927.8+27.8
United Australia Sydney Gardner 9,14217.1+0.3
Labor (N-C) Michael McKeon4,7358.9+8.9
State Labor James Russell3,5036.6+6.6
Independent William Cox1,6403.1+3.1
United Australia Campbell Marshall1,6173.0+3.0
Independent Edward Down1610.3+0.3
Total formal votes53,31995.1
Informal votes2,7634.9
Turnout 56,08295.2
Two-party-preferred result
United Australia Eric Spooner 26,84550.3-2.8
Labor Thomas Williams 26,47449.7+2.8
United Australia hold Swing -2.8

Warringah

1940 Australian federal election: Warringah
PartyCandidateVotes%±%
United Australia Percy Spender 43,75968.8+29.2
Labor Bessie Frewin7,01211.0−3.0
State Labor Arthur Warren6,69710.5+10.5
Defence Movement Patrick Esplin3,3995.3+5.3
United Australia Joseph Hamlet2,7524.3+4.3
Total formal votes63,61997.7
Informal votes1,4942.3
Turnout 65,11394.3
Two-party-preferred result
United Australia Percy Spender 75.5+23.6
Labor Bessie Frewin24.5+24.5
United Australia gain from Independent Swing +23.6

Watson

1940 Australian federal election: Watson
PartyCandidateVotes%±%
United Australia John Jennings 27,58645.0-8.8
Labor Max Falstein 21,10134.5-11.7
Labor (N-C) Cecil Irwin6,69310.9+10.9
State Labor Richard Wilson5,8689.6+9.6
Total formal votes61,24897.9
Informal votes1,2902.1
Turnout 62,53894.7
Two-party-preferred result
Labor Max Falstein 31,83152.0+5.8
United Australia John Jennings 29,41748.0-5.8
Labor gain from United Australia Swing +5.8

Wentworth

1940 Australian federal election: Wentworth
PartyCandidateVotes%±%
United Australia Eric Harrison 26,96943.0-1.8
Labor Norman Smith14,50023.1-9.5
United Australia Norman Cowper 13,09920.9+20.9
State Labor Jim Morley6,24910.0+10.0
United Australia Richard Stranger1,0621.7+1.7
Ind. Nationalist George McDonald 7711.2+1.2
Total formal votes62,65096.7
Informal votes2,1393.3
Turnout 64,78994.5
Two-party-preferred result
United Australia Eric Harrison 41,21865.8-1.6
Labor Norman Smith21,43234.2+1.6
United Australia hold Swing -1.6

Werriwa

1940 Australian federal election: Werriwa
PartyCandidateVotes%±%
Labor Bert Lazzarini 24,76641.5−13.8
United Australia Charles Hardwick 7,95413.3−9.3
State Labor Rex Connor 7,51212.6+12.6
Labor (N-C) Con Quilkey6,30110.6+10.6
United Australia Walter Duncan 6,01010.1+10.1
United Australia Lyell Scott4,1707.0+7.0
United Australia Joseph Worland2,2783.8+3.8
United Australia Mont Sheppard7311.2+1.2
Total formal votes59,72294.8
Informal votes3,2775.2
Turnout 62,99994.3
Two-party-preferred result
Labor Bert Lazzarini 65.1+9.8
United Australia Charles Hardwick 34.9−9.8
Labor hold Swing +9.8

West Sydney

1940 Australian federal election: West Sydney
PartyCandidateVotes%±%
Labor (N-C) Jack Beasley 30,57062.8+62.8
Labor Henry Mulcahy10,71422.0-78.0
Independent Malinda Ivey2,9376.0+6.0
Independent Stan Moran2,4705.1+5.1
State Labor Peter Burke1,9834.1+4.1
Total formal votes48,67494.9
Informal votes2,6105.1
Turnout 51,28492.7
Two-party-preferred result
Labor (N-C) Jack Beasley 64.3+64.3
Labor Henry Mulcahy35.7-64.3
Labor (N-C) gain from Labor Swing +64.3

Victoria

Balaclava

1940 Australian federal election: Balaclava
PartyCandidateVotes%±%
United Australia Thomas White 43,87664.0+5.9
Labor Charles Sandford 17,13525.0+3.2
Independent Harry Moffat7,58611.1+11.1
Total formal votes68,59798.5
Informal votes1,0471.5
Turnout 69,64495.0
Two-party-preferred result
United Australia Thomas White 68.6+1.5
Labor Charles Sandford 31.4−1.5
United Australia hold Swing +1.5

Ballarat

1940 Australian federal election: Ballaarat
PartyCandidateVotes%±%
Labor Reg Pollard 22,71547.8−2.8
United Australia Edward Montgomery 19,08940.1−9.3
Independent Alex Russell 5,74912.1+12.1
Total formal votes47,55399.0
Informal votes4881.0
Turnout 48,04196.8
Two-party-preferred result
Labor Reg Pollard 23,91750.3−0.3
United Australia Edward Montgomery 23,63649.7+0.3
Labor hold Swing −0.3

Batman

1940 Australian federal election: Batman
PartyCandidateVotes%±%
Labor Frank Brennan 35,63659.7-3.7
United Australia Albert Peters24,08240.3+3.7
Total formal votes59,71898.2
Informal votes1,0801.8
Turnout 60,79896.4
Labor hold Swing -3.7

Bendigo

1940 Australian federal election: Bendigo
PartyCandidateVotes%±%
Country George Rankin 22,56149.3+17.7
Labor Bert de Grandi17,45338.1−1.4
Independent Country John Barton5,76912.6+12.6
Total formal votes45,78398.6
Informal votes6311.4
Turnout 46,41495.6
Two-party-preferred result
Country George Rankin 26,31457.5+0.6
Labor Bert de Grandi19,46942.5−0.6
Country hold Swing +0.6

Bourke

1940 Australian federal election: Bourke
PartyCandidateVotes%±%
Labor Maurice Blackburn 39,73666.2−1.9
United Australia Charles Lucas20,27833.8+1.9
Total formal votes60,01497.8
Informal votes1,3642.2
Turnout 61,37895.2
Labor hold Swing −1.9

Corangamite

1940 Australian federal election: Corangamite
PartyCandidateVotes%±%
United Australia Allan McDonald 26,66556.2+2.3
Labor Harold Miller20,80143.8−2.3
Total formal votes47,46699.2
Informal votes3710.8
Turnout 47,83795.7
United Australia hold Swing +2.3

Corio

1940 Australian federal election: Corio
PartyCandidateVotes%±%
Labor John Dedman 28,05652.6+9.1
United Australia Gerald Patterson 21,27139.9−16.6
Independent Harry Lyall4,0337.6+7.6
Total formal votes53,36099.1
Informal votes5010.9
Turnout 53,86196.6
Two-party-preferred result
Labor John Dedman 56.4+12.9
United Australia Gerald Patterson 43.6−12.9
Labor hold Swing +12.9

Deakin

1940 Australian federal election: Deakin
PartyCandidateVotes%±%
United Australia William Hutchinson 29,31854.8-4.9
Labor Frank Williamson17,26732.3-8.0
Independent Frank Fisher3,9837.4+7.4
Independent Dunean McCallum2,9695.5+5.5
Total formal votes53,53798.3
Informal votes9111.7
Turnout 54,44895.0
Two-party-preferred result
United Australia William Hutchinson 62.2+2.5
Labor Frank Williamson37.8-2.5
United Australia hold Swing +2.5

Fawkner

1940 Australian federal election: Fawkner
PartyCandidateVotes%±%
United Australia Harold Holt 38,38760.8-5.7
Labor Arthur Fraser22,55835.8+7.4
Independent Alexander Mills 2,1523.4+3.4
Total formal votes63,09798.0
Informal votes1,2932.0
Turnout 64,39093.9
Two-party-preferred result
United Australia Harold Holt 62.5+0.1
Labor Arthur Fraser37.5-0.1
United Australia hold Swing +0.1

Flinders

1940 Australian federal election: Flinders
PartyCandidateVotes%±%
United Australia Rupert Ryan 22,15439.7-13.3
Labor Frank Lee15,46527.7+27.7
Independent Edward Mann 14,92026.7+26.7
Independent Alexander Amess3,2455.8+5.8
Total formal votes55,78498.3
Informal votes9461.7
Turnout 56,73095.9
Two-party-preferred result
United Australia Rupert Ryan 32,59158.4-3.3
Labor Frank Lee23,19341.6+3.3
United Australia hold Swing -3.3

Gippsland

1940 Australian federal election: Gippsland
PartyCandidateVotes%±%
Country Thomas Paterson 20,54742.8-1.6
Labor James McKenna16,08233.5-5.4
Country George Bowden 8,00616.7+16.7
Independent Calvert Wyeth3,4027.1+7.1
Total formal votes48,03798.5
Informal votes7081.5
Turnout 48,74596.0
Two-party-preferred result
Country Thomas Paterson 27,25756.7-4.4
Labor James McKenna20,78043.3+4.4
Country hold Swing -4.4

Henty

1940 Australian federal election: Henty
PartyCandidateVotes%±%
Independent Arthur Coles 35,54254.6+54.6
Labor Arthur Haywood23,31935.8+3.3
Independent Eric Young4,9277.6+7.6
Independent Samuel Thomas7041.1+1.1
Independent Edward Riley5670.9+0.9
Total formal votes65,05997.9
Informal votes1,3682.1
Turnout 66,42796.7
Two-party-preferred result
Independent Arthur Coles 63.5+63.5
Labor Arthur Haywood36.5-3.2
Independent gain from United Australia Swing +3.2

Indi

1940 Australian federal election: Indi
PartyCandidateVotes%±%
Country John McEwen 30,67661.5+0.3
Labor Jack Devlin 19,21638.5−0.3
Total formal votes49,89298.8
Informal votes6081.2
Turnout 50,50095.2
Country hold Swing +0.3

Kooyong

1940 Australian federal election: Kooyong
PartyCandidateVotes%±%
United Australia Robert Menzies 44,16162.9+11.6
Labor Thomas Brennan 14,46720.6−4.1
Independent John Dale 7,38210.5+10.5
Independent Drysdale Bett2,5983.7+3.7
Independent Frank Hartnett1,1681.7+1.7
Independent Francis Foster3770.5+0.5
Total formal votes70,15398.3
Informal votes1,1841.7
Turnout 71,33795.3
Two-party-preferred result
United Australia Robert Menzies 70.1+12.8
Labor Thomas Brennan 29.9−12.8
United Australia hold Swing +12.8

Maribyrnong

1940 Australian federal election: Maribyrnong
PartyCandidateVotes%±%
Labor Arthur Drakeford 40,99064.6+2.3
United Australia Robert Vroland22,45535.4+0.5
Total formal votes63,44598.3
Informal votes1,1241.7
Turnout 64,56995.9
Labor hold Swing +0.9

Melbourne

1940 Australian federal election: Melbourne
PartyCandidateVotes%±%
Labor Arthur Calwell 28,59051.9-48.1
United Australia Richard Griffiths13,14023.9+23.9
Aust. Democratic LaborJames Baker7,89314.3+14.3
Independent Labor Edward Whitcombe5,4509.9+9.9
Total formal votes55,07396.1
Informal votes2,2543.9
Turnout 57,32795.9
Two-party-preferred result
Labor Arthur Calwell 71.1-28.9
United Australia Richard Griffiths28.9+28.9
Labor hold Swing -28.9

Melbourne Ports

1940 Australian federal election: Melbourne Ports
PartyCandidateVotes%±%
Labor Jack Holloway 38,85366.1-33.9
United Australia Raymond Trickey19,90733.9+33.9
Total formal votes58,76097.6
Informal votes1,4282.4
Total votes60,188 94.7
Labor hold Swing -33.9

Wannon

1940 Australian federal election: Wannon
PartyCandidateVotes%±%
Labor Don McLeod 24,53348.6+9.3
United Australia Thomas Scholfield 21,27142.2+4.9
Independent Country John Crawford2,4904.9+4.9
Independent Jabez Potts2,1644.3+4.3
Total formal votes50,45898.8
Informal votes6241.2
Turnout 51,08296.2
Two-party-preferred result
Labor Don McLeod 27,09853.7+5.0
United Australia Thomas Scholfield 23,36046.3-5.0
Labor gain from United Australia Swing +5.0

Wimmera

1940 Australian federal election: Wimmera
PartyCandidateVotes%±%
Independent Alexander Wilson 19,91544.0-7.9
Country Hugh McClelland 12,56127.8-20.3
Labor Michael Nolan11,22224.8+24.8
Independent Robert Johnstone1,5233.4+3.4
Total formal votes45,22198.6
Informal votes6361.4
Turnout 45,85796.2
Two-party-preferred result
Independent Alexander Wilson 29,91866.2+14.3
Country Hugh McClelland 15,30333.8-14.3
Independent hold Swing +14.3

Yarra

1940 Australian federal election: Yarra
PartyCandidateVotes%±%
Labor James Scullin 32,79057.4-6.6
United Australia Fred Edmunds 19,13233.5-2.5
Independent Ralph Gibson 5,1759.1+9.1
Total formal votes57,09797.0
Informal votes1,7563.0
Turnout 58,85394.9
Two-party-preferred result
Labor James Scullin 65.6+1.6
United Australia Fred Edmunds 34.4-1.6
Labor hold Swing +1.6

Queensland

Brisbane

1940 Australian federal election: Brisbane
PartyCandidateVotes%±%
Labor George Lawson 27,47450.4−1.1
United Australia John Fletcher 27,05549.6+5.3
Total formal votes54,52997.5
Informal votes1,3962.5
Turnout 55,92592.7
Labor hold Swing −3.2

Capricornia

1940 Australian federal election: Capricornia
PartyCandidateVotes%±%
Labor Frank Forde 33,21158.7+8.3
Country Edwin Hiskens23,33041.3+3.3
Total formal votes56,54198.7
Informal votes7331.3
Turnout 57,27494.7
Labor hold Swing +2.5

Darling Downs

1940 Australian federal election: Darling Downs
PartyCandidateVotes%±%
Country Arthur Fadden 29,36557.9-2.8
Labor Leslie Bailey21,31642.1+8.0
Total formal votes50,68198.7
Informal votes6751.3
Turnout 51,35697.0
Country hold Swing -5.4

Griffith

1940 Australian federal election: Griffith
PartyCandidateVotes%±%
Labor William Conelan 30,52950.5+2.2
United Australia Peter McCowan29,87949.5+8.3
Total formal votes60,40897.8
Informal votes1,3472.2
Turnout 61,75596.4
Labor hold Swing +0.2

Herbert

1940 Australian federal election: Herbert
PartyCandidateVotes%±%
Labor George Martens 24,71240.7-2.9
Country Thomas Mann21,54535.5+6.3
Independent Fred Paterson 11,10418.3+18.3
Independent RSLLouis Haydon3,3465.5+5.5
Total formal votes60,70796.3
Informal votes2,3653.7
Turnout 63,07292.3
Two-party-preferred result
Labor George Martens 34,26156.4-10.0
Country Thomas Mann26,44643.6+10.0
Labor hold Swing -10.0

Kennedy

1940 Australian federal election: Kennedy
PartyCandidateVotes%±%
Labor Bill Riordan 29,98864.2+0.2
Country Wilfrid Simmonds 16,70635.8+4.6
Total formal votes46,69497.5
Informal votes1,2092.5
Turnout 47,90388.7
Labor hold Swing -2.2

Lilley

1940 Australian federal election: Lilley
PartyCandidateVotes%±%
United Australia William Jolly 35,04758.1+1.5
Labor Gordon Lovell23,48538.9+0.9
Independent Charles Mitchell1,8003.0+3.0
Total formal votes60,33297.7
Informal votes1,3992.3
Turnout 61,73195.9
Two-party-preferred result
United Australia William Jolly 59.6-0.7
Labor Gordon Lovell40.4+0.7
United Australia hold Swing -0.7

Maranoa

1940 Australian federal election: Maranoa
PartyCandidateVotes%±%
Labor Frank Baker 24,10547.9+6.5
Country Bob McGeoch22,45244.6-3.8
Independent Henry Madden3,8087.6+7.6
Total formal votes50,36598.2
Informal votes9391.8
Turnout 51,30490.3
Two-party-preferred result
Labor Frank Baker 25,98751.6+5.9
Country Bob McGeoch24,37848.4-5.9
Labor gain from Country Swing +5.9

Moreton

1940 Australian federal election: Moreton
PartyCandidateVotes%±%
United Australia Josiah Francis 36,26559.3+4.0
Labor Henry Herbert24,93840.7+3.7
Total formal votes61,20398.0
Informal votes1,2682.0
Turnout 62,47195.8
United Australia hold Swing +0.2

Wide Bay

1940 Australian federal election: Wide Bay
PartyCandidateVotes%±%
Country Bernard Corser 28,69354.9+17.1
Labor Samuel Round15,30529.3+6.7
Protestant Labor John Rex8,30015.9+15.9
Total formal votes52,29898.5
Informal votes8251.5
Turnout 53,12394.7
Two-party-preferred result
Country Bernard Corser 58.9+8.4
Labor Samuel Round41.1+41.1
Country hold Swing +8.4

South Australia

Adelaide

1940 Australian federal election: Adelaide
PartyCandidateVotes%±%
United Australia Fred Stacey 29,39350.0+4.7
Labor Edgar Dawes 19,95033.9−20.8
Aust. Democratic LaborRaymond Davis4,9068.3+8.3
Independent Labor Bert Edwards 4,5877.8+7.8
Total formal votes58,83695.0
Informal votes3,0905.0
Turnout 61,92695.0
Two-party-preferred result
United Australia Fred Stacey 54.7+0.7
Labor Edgar Dawes 45.3−0.7
United Australia hold Swing +0.7

Barker

1940 Australian federal election: Barker
PartyCandidateVotes%±%
Country Archie Cameron 34,64958.6−5.0
Labor Cecil Skitch15,78626.7+26.7
Independent Charles Lloyd8,65914.7−21.7
Total formal votes59,09496.9
Informal votes1,8613.1
Turnout 60,95596.0
Two-party-preferred result
Country Archie Cameron 65.9+2.3
Labor Cecil Skitch34.1−2.3
Country hold Swing +2.3

Boothby

1940 Australian federal election: Boothby
PartyCandidateVotes%±%
United Australia John Price 37,21957.4+5.5
Labor Edwin Yates 18,13128.0−5.0
Independent William Adey 9,47914.6+14.6
Total formal votes64,82996.6
Informal votes2,2793.4
Turnout 67,10895.0
Two-party-preferred result
United Australia John Price 65.2+5.0
Labor Edwin Yates 34.8−5.0
United Australia hold Swing +5.0

Grey

1940 Australian federal election: Grey
PartyCandidateVotes%±%
Country Oliver Badman 25,68352.8+0.8
Labor Charles Davis 18,17837.4-0.4
Independent Percy McFarlane4,7909.8+9.8
Total formal votes48,65196.9
Informal votes1,5803.1
Turnout 50,23196.6
Two-party-preferred result
Country Oliver Badman 57.7+0.6
Labor Charles Davis 42.3-0.6
Country hold Swing +0.6

Hindmarsh

1940 Australian federal election: Hindmarsh
PartyCandidateVotes%±%
Labor Norman Makin 41,71865.7-5.0
United Australia Harry Hatwell 21,75834.3+5.0
Total formal votes63,47696.2
Informal votes2,5303.8
Turnout 66,00695.6
Labor hold Swing -5.0

Wakefield

1940 Australian federal election: Wakefield
PartyCandidateVotes%±%
United Australia Jack Duncan-Hughes 27,35753.4-10.0
Labor Sydney McHugh 23,87046.6+10.0
Total formal votes51,22797.1
Informal votes1,5472.9
Turnout 52,77496.3
United Australia gain from Labor Swing -10.0

Western Australia

Forrest

1940 Australian federal election: Forrest
PartyCandidateVotes%±%
Country John Prowse 24,61955.4+1.0
Labor Vane Green19,83244.6-1.0
Total formal votes44,45197.7
Informal votes1,0532.3
Turnout 45,50494.1
Country hold Swing +1.0

Fremantle

1940 Australian federal election: Fremantle
PartyCandidateVotes%±%
Labor John Curtin 27,29948.0-7.2
United Australia Frederick Lee26,27446.2+5.3
Independent UAP Gil Clarke3,3445.9+5.9
Total formal votes56,91797.4
Informal votes1,4992.6
Turnout 58,41694.7
Two-party-preferred result
Labor John Curtin 28,77950.6-6.6
United Australia Frederick Lee28,13849.4+6.6
Labor hold Swing -0.5

Kalgoorlie

1940 Australian federal election: Kalgoorlie
PartyCandidateVotes%±%
Labor Albert Green unopposed
Labor hold Swing

Perth

1940 Australian federal election: Perth
PartyCandidateVotes%±%
United Australia Walter Nairn 33,99962.4+2.4
Labor Gavan McMillan17,14431.5-2.6
Independent James Bolitho3,3266.1+6.1
Total formal votes54,46996.9
Informal votes1,7383.1
Turnout 56,20793.5
Two-party-preferred result
United Australia Walter Nairn 64.5+4.2
Labor Gavan McMillan35.5-4.2
United Australia hold Swing +4.2

Swan

1940 Australian federal election: Swan
PartyCandidateVotes%±%
Country Henry Gregory 15,99734.2+5.1
Labor Jim Dinan13,19328.2-13.7
Country Thomas Marwick 8,80018.8+18.8
Independent Claude Barker 7,75816.6+16.6
 British IsraelJohn Tregenza9862.1+2.1
Total formal votes46,73495.8
Informal votes2,0734.2
Turnout 48,80792.4
Two-party-preferred result
Country Henry Gregory 26,85557.5-0.6
Labor Jim Dinan19,87942.5+0.6
Country hold Swing -0.6

Tasmania

Bass

1940 Australian federal election: Bass
PartyCandidateVotes%±%
Labor Claude Barnard 12,00949.4−1.0
United Australia Algie Findlay5,63423.2+5.6
United Australia Desmond Oldham5,21521.5+21.5
Independent John Watson1,4526.0−4.5
Total formal votes24,31096.8
Informal votes8133.2
Turnout 25,12395.4
Two-party-preferred result
Labor Claude Barnard 54.2−1.5
United Australia Algie Findlay45.8+1.5
Labor hold Swing −1.5

Darwin

1940 Australian federal election: Darwin
PartyCandidateVotes%±%
United Australia George Bell 15,89659.2+6.7
Labor Eric Reece 10,96140.8-6.7
Total formal votes26,85797.4
Informal votes7072.6
Turnout 27,56494.0
United Australia hold Swing +6.7

Denison

1940 Australian federal election: Denison
PartyCandidateVotes%±%
United Australia Arthur Beck 12,96951.1+9.8
Labor Gerald Mahoney 12,43348.9+1.4
Total formal votes25,40296.7
Informal votes8803.3
Turnout 26,28293.0
United Australia gain from Labor Swing +5.0

Franklin

1940 Australian federal election: Franklin
PartyCandidateVotes%±%
Labor Charles Frost 14,32253.5-4.5
United Australia Hugh Warner12,46646.5+4.5
Total formal votes26,78896.7
Informal votes9133.3
Turnout 27,70196.0
Labor hold Swing -4.5

Wilmot

1940 Australian federal election: Wilmot
PartyCandidateVotes%±%
Labor Lancelot Spurr 10,11343.4-3.4
United Australia Allan Guy 8,30135.6+3.5
United Australia Frank Edwards 4,91321.1+21.1
Total formal votes23,32796.7
Informal votes7893.3
Turnout 24,11695.6
Two-party-preferred result
United Australia Allan Guy 12,84155.0-0.1
Labor Lancelot Spurr 10,48645.0+0.1
United Australia gain from Labor Swing -0.1

Northern Territory

Northern Territory

1940 Australian federal election: Northern Territory
PartyCandidateVotes%±%
Independent Adair Blain 1,62238.9+0.7
Labor Lindsay Craig1,32131.6-4.9
Independent Fred Colson84120.1+20.1
Independent Labor John McDonald3919.4+9.4
Total formal votes4,17597.9
Informal votes882.1
Turnout 4,26374.3
Two-party-preferred result
Independent Adair Blain 2,57961.8+9.8
Labor Lindsay Craig1,59638.2-9.8
Independent hold Swing +9.8

See also

Related Research Articles

<span class="mw-page-title-main">Australian Labor Party</span> Federal political party in Australia

The Australian Labor Party (ALP), also simply known as Labor, is the major centre-left political party in Australia, one of two major parties in Australian politics, along with the centre-right Liberal Party of Australia. The party has been governing federally since being elected at the 2022 election, and with political branches in each state and territory, they are currently in government in New South Wales, Queensland, South Australia, Victoria, Western Australia, the Australian Capital Territory, and the Northern Territory – Tasmania is the only state or territory where they currently form the opposition. It is the oldest political party in Australia, being established on 8 May 1901 at Parliament House, Melbourne, the meeting place of the first federal Parliament.

<span class="mw-page-title-main">Division of Barton</span> Australian federal electoral division

The Division of Barton is an Australian electoral division in the state of New South Wales.

The Division of Gwydir was an Australian electoral division in the state of New South Wales. The division was proclaimed in 1900, and was one of the original 65 divisions to be contested at the first federal election. As a result of the electoral redistribution of 13 September 2006, Gwydir was abolished and ceased to exist at the 2007 federal election.

<span class="mw-page-title-main">Lang Labor</span> Political party in Australia

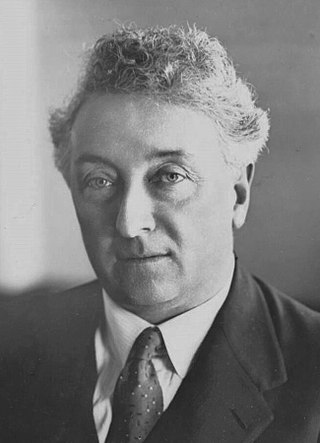
Lang Labor was a faction of the Australian Labor Party (ALP) consisting of the supporters of Jack Lang, who served two terms as Premier of New South Wales and was the party's state leader from 1923 to 1939.

The Australian Labor Party (Non-Communist), which operated from 1940 to 1941, was a breakaway from the Australian Labor Party (ALP), and was associated with the Lang Labor faction and former New South Wales premier Jack Lang.

The State Labor Party, also known as State Labor Party (Hughes-Evans), was an Australian political party which operated exclusively in the state of New South Wales (NSW) in the early 1940s. The party was initially a far-left faction of the Australian Labor Party, strongly opposed to the right-wing faction of the party dominated by Jack Lang, the NSW Premier between 1925 and 1927, and again between 1930 and 1932.

<span class="mw-page-title-main">1949 Australian federal election</span> Australian federal election

The 1949 Australian federal election was held in Australia on 10 December 1949. All 121 seats in the House of Representatives and 42 of the 60 seats in the Senate were up for election. The incumbent Labor Party, led by Prime Minister Ben Chifley, was defeated by the opposition Liberal–Country coalition under Robert Menzies in a landslide. Menzies became prime minister for a second time, his first period having ended in 1941. This election marked the end of the 8-year Curtin-Chifley Labor government that had been in power since 1941 and started the 23-year Liberal/Country Coalition government. This was the first time the Liberal party won government at the federal level.

<span class="mw-page-title-main">1943 Australian federal election</span> Australian federal election

The 1943 Australian federal election was held in Australia on 21 August 1943. All 74 seats in the House of Representatives and 19 of the 36 seats in the Senate were up for election. The incumbent Labor Party, led by Prime Minister John Curtin, defeated the opposition Country–UAP coalition led by Arthur Fadden in a landslide.

<span class="mw-page-title-main">1940 Australian federal election</span> Australian federal election

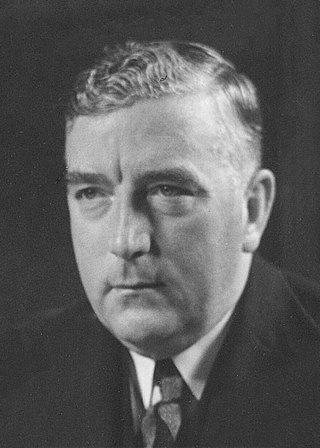
The 1940 Australian federal election was held in Australia on 21 September 1940. All 74 seats in the House of Representatives and 19 of the 36 seats in the Senate were up for election. The incumbent Coalition, consisting of the United Australia Party led by Prime Minister Robert Menzies and the Country Party led by Archie Cameron, defeated the opposition Labor Party under John Curtin despite losing the overall popular vote.

<span class="mw-page-title-main">1937 Australian federal election</span> Australian federal election

The 1937 Australian federal election was held in Australia on 23 October 1937. All 74 seats in the House of Representatives, and 19 of the 36 seats in the Senate were up for election. The incumbent UAP–Country coalition government, led by Prime Minister Joseph Lyons, defeated the opposition Labor Party under John Curtin.

<span class="mw-page-title-main">1928 Australian federal election</span> Australian federal election

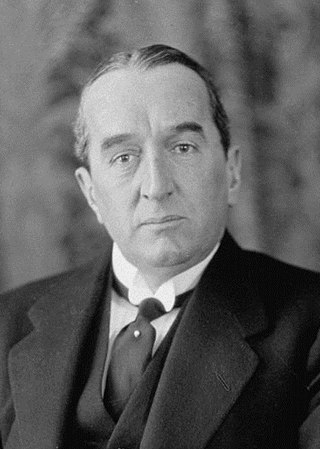
The 1928 Australian federal election was held in Australia on 17 November 1928. All 75 seats in the House of Representatives and 19 of the 36 seats in the Senate were up for election. The incumbent Nationalist–Country coalition, led by Prime Minister Stanley Bruce won a record fifth consecutive election defeating the opposition Labor Party led by James Scullin.
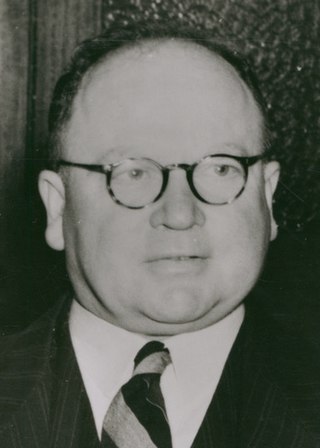
The Republican Party of Australia was a minor Australian political party dedicated to ending the country's monarchy and establishing a republic. It was formed in 1982 and registered by the Australian Electoral Commission on several occasions prior to being voluntarily deregistered in 2021. It was not linked with the Australian Republic Movement.

The Services Party of Australia was a minor Australian political party that was active in the mid-1940s. It received over 7% of the vote in Queensland at the 1946 federal election.

The Protestant People's Party (PPP) was a minor Australian political party which operated in the state of New South Wales (NSW) in the 1940s.

<span class="mw-page-title-main">Henry Gregory (politician)</span> Australian politician

Henry Gregory was an Australian politician. He was a Ministerialist member of the Western Australian Legislative Assembly from 1897 to 1911, representing the electorates of North Coolgardie (1897-1901) and Menzies (1901-1911). He was state Minister for Mines from 1901 to 1904 under George Leake and Walter James and Minister for Mines and Railways from 1905 to 1911 under Hector Rason, Newton Moore and Frank Wilson. He rose to become Treasurer from 1910 to 1911, a role that also entailed him acting as Premier if Wilson was absent, but lost his seat at the 1911 state election.

Members of the New South Wales Legislative Assembly who served in the 32nd parliament held their seats from 1938 to 1941. They were elected at the 1938 state election, and at by-elections. The Speaker was Reginald Weaver.

This is a list of members of the Victorian Legislative Assembly from 1940 to 1943, as elected at the 1940 state election:

This is a list of electoral division results for the Australian 1937 federal election.

References