Results of the 2001 Australian federal election (House of Representatives)

Last updated

2001 House of Representatives elections
Flag of Australia (converted).svg
  1998 10 November 2001 2004  

All 150 seats in the Australian House of Representatives
76 seats needed for a majority
Turnout94.3%
PartyLeader%Seats+/–
Liberal John Howard 37.08%68+4
Labor Kim Beazley 37.84%65-2
National John Anderson 5.61%13-3
Country Liberal N/A0.32%1+1
This lists parties that won seats. See the complete results below.
Prime Minister beforePrime Minister after
Howard John BANNER.jpg John Howard
Coalition
John Howard
Coalition
Howard John BANNER.jpg

The following tables show results for the Australian House of Representatives at the 2001 federal election held on 10 November 2001. The parliament increased from 148 to 150 seats, with a new seat in Western Australia and a new seat in the Northern Territory.

Contents

Australia

House of Reps (IRV) — 2001–04 – Turnout 94.85% (CV) — Informal 4.82% 2001 Australian House.svg
PartyVotes%SwingSeatsChange
   Liberal 4,254,07237.08+3.1968Increase2.svg 4
  National 643,9265.61+0.3213Decrease2.svg 3
  Country Liberal 36,9610.32–0.001Increase2.svg 1
Liberal–National coalition 4,934,95942.92+3.4182Increase2.svg 2
  Labor 4,341,42037.84−2.2665Decrease2.svg 2
  Democrats 620,1975.41+0.280Steady2.svg
  Greens 569,0744.96+2.820Steady2.svg
  One Nation 498,0324.34−4.090Steady2.svg
  Independents 332,1182.89+1.003Increase2.svg 2
Total11,474,074  150Increase2.svg 2
Two-party-preferred vote
  Coalition 5,655,79151.03+2.0182Increase2.svg 2
  Labor 5,427,56948.97−2.0165Decrease2.svg 2
Invalid/blank votes580,3624.81+1.04
Turnout12,054,45595.39
Registered voters12,636,631
Source: AEC Tally Room

Independents: Peter Andren, Tony Windsor, Bob Katter

States

New South Wales

2001 Australian federal election
(New South Wales)
Flag of New South Wales.svg
  1998 10 November 2001 2004  

All 50 New South Wales seats in the Australian House of Representatives
and 6 seats in the Australian Senate
 First partySecond party
  Howard John BANNER.jpg Kim Beazley crop.jpg
Leader John Howard Kim Beazley
Party Liberal/National coalition Labor
Last election27 seats22 seats
Seats won28 seats20 seats
Seat changeIncrease2.svg 1Decrease2.svg 2
Popular vote1,621,5801,380,822
Percentage42.80%36.45%
SwingIncrease2.svg 4.41Decrease2.svg 3.67
TPP 52.14%47.86%
TPP swingIncrease2.svg 3.68Decrease2.svg 3.68
Turnout 99.60% (CV) — Informal 3.40% [1]
PartyVotes%SwingSeatsChange
   Liberal 1,272,20833.583.0921Increase2.svg 3
  National 349,3729.221.327Decrease2.svg 2
Liberal/National Coalition 1,621,58042.804.4128Increase2.svg 1
  Labor 1,380,82236.45–3.6720Decrease2.svg 2
  One Nation 180,8124.77–4.19
  Greens 180,0794.752.09
  Democrats 160,7064.240.08
  Independent 148,0423.913.022Increase2.svg 1
  Christian Democrats 46,0591.220.19
  Unity 24,6530.65–0.90
  Against Further Immigration 12,0330.32
  Save the ADI Site 6,0290.16
  Citizens Electoral Council 5,7460.15
  No GST 4,8580.13
  Progressive Labour 4,4670.12
  Lower Excise Fuel 3,0980.08
  HEMP 2,1930.06
  Non-Custodial Parents 0,7690.02
  Fishing Party 0,7200.02
Total3,788,45950
Two-party-preferred vote
  Liberal/National Coalition 1,811,01952.14+3.6828Increase2.svg 1
  Labor 1,662,19048.46–3.6820Decrease2.svg 2
Invalid/blank votes217,0245.42+1.41
Turnout4,005,48395.27
Registered voters4,204,383
Source: AEC Tally Room

Victoria

2001 Australian federal election
(Victoria)
Flag of Victoria (Australia).svg
  1998 10 November 2001 2004  

All 37 Victoria seats in the Australian House of Representatives
and 6 seats in the Australian Senate
 First partySecond party
  Kim Beazley crop.jpg Howard John BANNER.jpg
Leader Kim Beazley John Howard
Party Labor Liberal/National coalition
Last election19 seats16 seats
Seats won20 seats15 seats
Seat changeIncrease2.svg 1Decrease2.svg 1
Popular vote1,230,7571,245,542
Percentage41.65%42.15%
SwingDecrease2.svg 2.72Increase2.svg 2.35
TPP 53.05%46.95%
TPP swingIncrease2.svg 1.65Decrease2.svg 1.65
Turnout 99.60% (CV) — Informal 3.40% [2]
PartyVotes%SwingSeatsChange
   Liberal 1,154,49339.071.9915Decrease2.svg 1
  National 91,0493.080.362Steady2.svg
Liberal/National Coalition 1,245,54242.152.3517Decrease2.svg 1
  Labor 1,230,75741.65–2.7220Increase2.svg 1
  Democrats 184,5826.250.23
  Greens 174,3995.903.81
  Independents 60,8010.02
  One Nation 37,8111.28–2.44
  Citizens Electoral Council 6,6920.230.08
  Christian Democrats 6,1880.210.08
  No GST 5,1040.17
  Liberals for Forests 1,9600.07
  Lower Excise Fuel 1,1940.04
Total2,955,03137
Two-party-preferred vote
  Labor 1,540,61452.14–1.3920Increase2.svg 1
  Liberal/National Coalition 1,414,41746.47+1.3917Decrease2.svg 1
Invalid/blank votes122,5253.68+0.47
Turnout2,955,03195.61
Registered voters3,218,746
Source: AEC Tally Room

Queensland

2001 Australian federal election
(Queensland)
Flag of Queensland.svg
  1998 10 November 2001 2004  

All 27 Queensland seats in the Australian House of Representatives
and 6 seats in the Australian Senate
 First partySecond party
  Howard John BANNER.jpg Kim Beazley crop.jpg
Leader John Howard Kim Beazley
Party Liberal/National coalition Labor
Last election14 seats8 seats
Seats won15 seats7 seats
Seat changeIncrease2.svg 1Decrease2.svg 1
Popular vote960,410730,920
Percentage45.60%34.70%
SwingIncrease2.svg 4.74Decrease2.svg 1.40
TPP 53.05%46.95%
TPP swingIncrease2.svg 1.65Decrease2.svg 1.65
Turnout 99.60% (CV) — Informal 3.40% [3]
PartyVotes%SwingSeatsChange
   Liberal 767,95936.465.6015Increase2.svg 1
  National 192,4519.14–0.864Decrease2.svg 1
Liberal/National Coalition 960,41045.60+4.7419Steady2.svg
  Labor 730,92034.70–1.407Decrease2.svg 1
  One Nation 148,9307.07–7.280Steady2.svg
  Independent 148,6207.061Increase2.svg 1
  Democrats 90,6794.310.29
  Greens 73,4673.491.11
  Citizens Electoral Council 2,8490.14
  HEMP 1,0840.05
  Outdoor Recreation 4850.02
Total2,106,25528
Two-party-preferred vote
  Liberal 1,110,90553.05+1.6519Increase2.svg 1
  Labor 919,86746.95–1.657Decrease2.svg 1
Invalid/blank votes106,9764.83+1.50
Turnout2,213,23195.42
Registered voters2,319,481
Source: AEC Tally Room

Western Australia

2001 Australian federal election
(Western Australia)
Flag of Western Australia.svg
  1998 10 November 2001 2004  

All 15 Western Australian seats in the Australian House of Representatives
and 6 seats in the Australian Senate
 First partySecond party
  Howard John BANNER.jpg Kim Beazley crop.jpg
Leader John Howard Kim Beazley
Party Liberal/National coalition Labor
Last election7 seats7 seats
Seats won8 seats7 seats
Seat changeIncrease2.svg 1Steady2.svg
Popular vote449,036402,927
Percentage41.39%37.14%
SwingIncrease2.svg 3.24Decrease2.svg 0.29
TPP 48.38%51.62%
TPP swingDecrease2.svg 1.08Increase2.svg 1.08
Turnout 99.60% (CV) — Informal 3.40% [4]
PartyVotes%SwingSeatsChange
  Liberal 449,03641.39+3.248Increase2.svg 1
  Labor 402,92737.14-0.297Steady2.svg
  One Nation 67,9926.27-3.01
  Greens 64,9395.99+0.93
  Democrats 50,5814.66+0.70
  Liberals for Forests 13,1161.21
  Christian Democrats 12,7921.18
  National 11,0521.02
  Independent 6,9570.64
  Citizens Electoral Council 2,9070.27
  Curtin Labor Alliance 2,4960.23
Total1,084,79515Increase2.svg 1
Two-party-preferred vote
  Liberal 48.38-1.088Increase2.svg 1
  Labor  51.621.087Steady2.svg

South Australia

2001 Australian federal election
(South Australia)
Flag of South Australia.svg
  1998 10 November 2001 2004  

All 5 South Australian seats in the Australian House of Representatives
and 6 seats in the Australian Senate
 First partySecond party
  Howard John BANNER.jpg Kim Beazley crop.jpg
Leader John Howard Kim Beazley
Party Liberal/National coalition Labor
Last election9 seats3 seats
Seats won9 seats3 seats
Seat changeSteady2.svgSteady2.svg
Popular vote430,442316,362
Percentage45.90%33.75%
SwingIncrease2.svg 3.85Decrease2.svg 0.74
TPP 54.08%45.92%
TPP swingIncrease2.svg 0.97Decrease2.svg 0.97
Turnout 99.60% (CV) — Informal 3.40% [5]
PartyVotes%SwingSeatsChange
  Liberal 430,44245.903.859Steady2.svg
  Labor 316,36233.74-0.743Steady2.svg
  Democrats 98,84910.540.40
  One Nation 44,5744.75-5.05
  Greens 34,1413.643.15
  Independents 7,9210.80
  No GST 4,2020.42+0.42
  Communist 0,6720.07
Total937,7085
Two-party-preferred vote
  Liberal 45.92-0.979Steady2.svg
  Labor  54.080.973Steady2.svg

Tasmania

2001 Australian federal election
(Tasmania)
Flag of Tasmania.svg
  1998 10 November 2001 2004  

All 5 Tasmanian seats in the Australian House of Representatives
and 6 seats in the Australian Senate
 First partySecond party
  Kim Beazley crop.jpg Howard John BANNER.jpg
Leader Kim Beazley John Howard
Party Labor Liberal/National coalition
Last election5 seats0 seats
Seats won5 seats0 seats
Seat changeSteady2.svgSteady2.svg
Popular vote145,305114,283
Percentage47.17%37.10%
SwingDecrease2.svg 1.73Decrease2.svg 1.07
TPP 57.32%42.68%
TPP swingIncrease2.svg 0.41Decrease2.svg 0.41
Turnout 99.60% (CV) — Informal 3.40% [6]
PartyVotes%SwingSeatsChange
  Labor 145,30547.17–1.735Steady2.svg
  Liberal 114,28337.10–1.070Steady2.svg
  Greens 24,0527.81+2.25
  Democrats 13,7854.48+1.22
  One Nation 8,8472.87+0.42
  Liberals for Forests 9661.59+1.59
  Tasmania First 6211.02–0.89
  Citizens Electoral Council 1590.26+0.26
Total308,0185
Two-party-preferred vote
  Labor 57.73+0.415Steady2.svg
  Liberal  42.27–0.410Steady2.svg

Territories

Australian Capital Territory

2001 Australian federal election
(Australian Capital Territory)
Flag of the Australian Capital Territory.svg
  1998 10 November 2001 2004  

All 2 Australian Capital Territory seats in the Australian House of Representatives
and all 2 seats in the Australian Senate
 First partySecond party
  Kim Beazley crop.jpg Howard John BANNER.jpg
Leader Kim Beazley John Howard
Party Labor Liberal/National coalition
Last election2 seats0 seats
Seats won2 seats0 seats
Seat changeSteady2.svgSteady2.svg
Popular vote95,21565,651
Percentage46.98%32.39%
SwingIncrease2.svg –3.66Increase2.svg 1.87
TPP 61.08%38.93%
TPP swingDecrease2.svg 1.36Increase2.svg 1.36

Turnout 96.48% (CV) — Informal 3.52% [7]
PartyVotes%SwingSeatsChange
  Labor 95,21546.98–3.662Steady2.svg
  Liberal 65,65132.391.870Steady2.svg
  Democrats 16,2668.030.63
  Greens 14,3357.072.89
  One Nation 5,5762.75–2.33
  Christian Democrats 5,6232.770.60
Total202,6662
Two-party-preferred vote
  Labor 61.08–1.362Steady2.svg
  Liberal  38.921.360Steady2.svg

Northern Territory

2001 Australian federal election
(Northern Territory)
Flag of the Northern Territory.svg
  1998 10 November 2001 2004  

All 2 Northern Territory seats in the Australian House of Representatives
and all 2 seats in the Australian Senate
 First partySecond party
  Kim Beazley crop.jpg Howard John BANNER.jpg
Leader Kim Beazley John Howard
Party Labor Liberal/National coalition
Last election1 seats0 seats
Seats won1 seats1 seats
Seat changeSteady2.svgIncrease2.svg 1
Popular vote39,11136,961
Percentage42.90%40.54%
SwingIncrease2.svg +0.6Increase2.svg 0.94
TPP 50.57%49.43%
TPP swingDecrease2.svg 1.92Increase2.svg 1.92

Turnout 95.36% (CV) — Informal 4.54% [8]
PartyVotes%SwingSeatsChange
  Labor 39,11142.900.601Steady2.svg
  Country Liberal 36,96140.540.941Increase2.svg 1
  Democrats 4,7955.260.14Steady2.svg
  Greens 3,6654.020.99Steady2.svg
  One Nation 3,4863.82-4.31Steady2.svg
  Independents 3,1433.452.33Steady2.svg
Total91,1612Increase2.svg 1
Two-party-preferred vote
  Labor 52.491.921Steady2.svg
  Country Liberal  47.51–1.921Increase2.svg 1

Related Research Articles

The Australian electoral system comprises the laws and processes used for the election of members of the Australian Parliament and is governed primarily by the Commonwealth Electoral Act 1918. The system presently has a number of distinctive features including compulsory enrolment; compulsory voting; majority-preferential instant-runoff voting in single-member seats to elect the lower house, the House of Representatives; and the use of the single transferable vote proportional representation system to elect the upper house, the Senate.

Electoral systems of the Australian states and territories are broadly similar to the electoral system used in federal elections in Australia.

<span class="mw-page-title-main">2001 Australian federal election</span> Election for the 40th Parliament of Australia

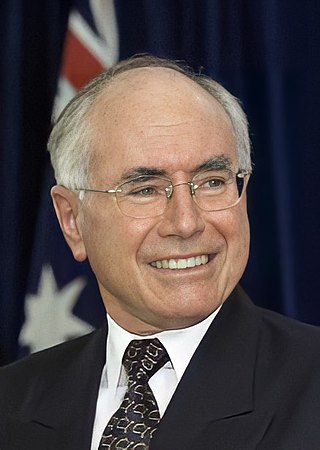
The 2001 Australian federal election was held in Australia on 10 November 2001. All 150 seats in the House of Representatives and 40 seats in the 76-member Senate were up for election. The incumbent Liberal Party of Australia led by Prime Minister of Australia John Howard and coalition partner the National Party of Australia led by John Anderson defeated the opposition Australian Labor Party led by Kim Beazley.

Elections in Australia take place periodically to elect the legislature of the Commonwealth of Australia, as well as for each Australian state and territory and for local government councils. Elections in all jurisdictions follow similar principles, although there are minor variations between them. The elections for the Australian Parliament are held under the federal electoral system, which is uniform throughout the country, and the elections for state and territory Parliaments are held under the electoral system of each state and territory.

<span class="mw-page-title-main">Divisions of the Australian House of Representatives</span> Federal electorates in Australia

In Australia, electoral districts for the Australian House of Representatives are called divisions or more commonly referred to as electorates or seats. There are currently 151 single-member electorates for the Australian House of Representatives.

The 2004 Australian Federal Election was held on Saturday 9 October 2004 and it was the Howard Government’s opportunity to secure its fourth term of government. The Government consisting of the conservative coalition Liberal Party and National Party headed by John Howard and John Anderson respectively were opposed by Mark Latham and the Labor Party.

<span class="mw-page-title-main">Division of Grey</span> Australian federal electoral division

The Division of Grey is an Australian electoral division in South Australia. The division was one of the seven established when the former Division of South Australia was redistributed on 2 October 1903 and is named for Sir George Grey, who was Governor of South Australia from 1841 to 1845.

Legalise Cannabis Australia, formerly the Help End Marijuana Prohibition (HEMP) Party, is an Australian political party. It has a number of policies that centre around the re-legalisation of cannabis for personal, medicinal and industrial uses in Australia.

Alfred Cove was an electoral district of the Legislative Assembly of Western Australia. It was located in Perth's southern suburbs, and named after the riverside suburb of Alfred Cove.

<span class="mw-page-title-main">Liberal Democratic Party (Australia)</span> Australian political party

The Liberal Democratic Party, shortened as LDP, Liberal Democrats, or Lib Dems, is an Australian political party founded in Canberra in 2001. The party espouses smaller government and supports policies that are based on classical liberal, libertarian principles, such as lower taxes, opposing restrictions on civil liberties, decentralisation, utilising nuclear energy, and the relaxation of smoking laws.

<span class="mw-page-title-main">Two-party-preferred vote</span> Result of election after distribution of preferences

In Australian politics, the two-party-preferred vote is the result of an election or opinion poll after preferences have been distributed to the highest two candidates, who in some cases can be independents. For the purposes of TPP, the Liberal/National Coalition is usually considered a single party, with Labor being the other major party. Typically the TPP is expressed as the percentages of votes attracted by each of the two major parties, e.g. "Coalition 50%, Labor 50%", where the values include both primary votes and preferences. The TPP is an indicator of how much swing has been attained/is required to change the result, taking into consideration preferences, which may have a significant effect on the result.

<span class="mw-page-title-main">2013 Australian federal election</span> Election for the 44th Parliament of Australia

The 2013 Australian federal election to elect the members of the 44th Parliament of Australia took place on 7 September 2013. The centre-right Liberal/National Coalition opposition led by Opposition leader Tony Abbott of the Liberal Party of Australia and Coalition partner the National Party of Australia, led by Warren Truss, defeated the incumbent centre-left Labor Party government of Prime Minister Kevin Rudd in a landslide. Labor had been in government for six years since being elected in the 2007 election. This election marked the end of the Rudd-Gillard-Rudd Labor government and the start of the 9 year long Abbott-Turnbull-Morrison Liberal-National Coalition government. Abbott was sworn in by the Governor-General, Quentin Bryce, as Australia's new Prime Minister on 18 September 2013, along with the Abbott Ministry. The 44th Parliament of Australia opened on 12 November 2013, with the members of the House of Representatives and territory senators sworn in. The state senators were sworn in by the next Governor-General Peter Cosgrove on 7 July 2014, with their six-year terms commencing on 1 July.

<span class="mw-page-title-main">Sustainable Australia Party</span> Political party in Australia

The Sustainable Australia Party, formerly the Sustainable Population Party, is an Australian political party. Formed in 2010, it describes itself as being "from the political centre".

<span class="mw-page-title-main">United Australia Party (2013)</span> Political party in Australia

The United Australia Party (UAP), formerly known as Clive Palmer's United Australia Party and the Palmer United Party (PUP), is a currently deregistered Australian political party formed by mining magnate Clive Palmer in April 2013. The party was deregistered by the Australian Electoral Commission in 2017, revived and re-registered in 2018, and voluntarily deregistered in 2022. The party fielded candidates in all 150 House of Representatives seats at the 2013 federal election. Palmer, the party's leader, was elected to the Division of Fairfax and it reached a peak of three senators following the rerun of the Western Australian senate election in 2014. When the party was revived under its original name in 2018, it was represented by ex-One Nation senator Brian Burston in the federal parliament.

The Voluntary Euthanasia Party (VEP) was a minor political party in Australia, founded in early 2013 by Corey McCann to advocate for legislative change to allow voluntary euthanasia in Australia. The party's inception was strongly supported by Dr Philip Nitschke, director of Exit International and Richard Mills, then President of Dying with Dignity NSW.

<span class="mw-page-title-main">2022 Australian federal election</span> Election for the 47th Parliament of Australia

The 2022 Australian federal election was held on Saturday 21 May 2022 to elect members of the 47th Parliament of Australia. The incumbent Liberal/National Coalition government, led by Prime Minister Scott Morrison, sought to win a fourth consecutive term in office but was defeated by the opposition, the Labor Party, led by Anthony Albanese. Up for election were all 151 seats in the lower house, the House of Representatives, and 40 of the 76 seats in the upper house, the Senate.

<span class="mw-page-title-main">Australian Federation Party</span> Political party in Australia

The Australian Federation Party (AFP), formerly known as the Country Alliance and the Australian Country Party, is an Australian political party. Founded in 2004 by four rural Victorians, the party lodged its initial registration with the Victorian Electoral Commission on 15 August 2005.

The number of seats won by each party in the Australian House of Representatives at the 2022 federal election were: Coalition 58, Labor 77, Australian Greens 4, Centre Alliance 1, Katter's Australian Party 1, and Independents 10.

This is a list of electoral division results for the Australian 2001 federal election for the Australian Capital Territory and the Northern Territory.

References

  1. "2001 First preference votes for New South Wales". Australian Electoral Commission. Retrieved 8 June 2022.
  2. "2001 First preference votes for Victoria". Australian Electoral Commission. Retrieved 8 June 2022.
  3. "2001 First preference votes for Queensland". Australian Electoral Commission. Retrieved 8 June 2022.
  4. "2001 First preference votes for Western Australia". Australian Electoral Commission. Retrieved 8 June 2022.
  5. "2001 First preference votes for South Australia". Australian Electoral Commission. Retrieved 8 June 2022.
  6. "2001 First preference votes for Tasmania". Australian Electoral Commission. Retrieved 8 June 2022.
  7. "2001 First preference votes for the Australian Capital Territory". Australian Electoral Commission. Retrieved 7 June 2022.
  8. "2001 First preference votes for the Northern Territory". Australian Electoral Commission. Retrieved 7 June 2022.