| ||||||||||||||||||||||||||||||||||
All 11 South Australian seats in the Australian House of Representatives and 6 seats in the Australian Senate | ||||||||||||||||||||||||||||||||||
---|---|---|---|---|---|---|---|---|---|---|---|---|---|---|---|---|---|---|---|---|---|---|---|---|---|---|---|---|---|---|---|---|---|---|
|
2004 Australian federal election |
---|
National results |
State and territory results |
This is a list of electoral division results for the Australian 2004 federal election in the state of South Australia. [1] [2] [3]
Party | Votes | % | Swing | Seats | Change | |||
---|---|---|---|---|---|---|---|---|
Liberal | 446,372 | 47.40 | + 1.49 | 8 | ||||
National | 9,611 | 1.02 | +1.02 | 0 | ||||
Labor | 346,071 | 36.75 | + 3.01 | 3 | ||||
Greens | 51,200 | 5.44 | +1.80 | 0 | ||||
Democrats | 17,682 | 1.88 | –8.66 | 0 | ||||
One Nation | 10,687 | 1.13 | –3.62 | 0 | ||||
Family First | 40,547 | 4.31 | +4.31 | 0 | ||||
Independents | 19,204 | 2.04 | +1.16 | 0 | ||||
Total | 997,102 | 11 | ||||||
Two-party-preferred vote | ||||||||
Liberal/National Coalition | 511,845 | 54.36 | +0.28 | 8 | ||||
Labor | 429,799 | 45.64 | –0.28 | 3 | ||||
Invalid/blank votes | 55,458 | 5.56 | +0.22 | |||||
Registered voters/turnout | 1,051,923 | 94.79 | ||||||
Source: AEC Tally Room |
Party | Candidate | Votes | % | ±% | |
---|---|---|---|---|---|
Liberal | Cameron Thompson | 42,683 | 52.19 | +8.28 | |
Labor | Shayne Neumann | 25,709 | 31.44 | +1.06 | |
One Nation | David Chidgey | 4,330 | 5.29 | −9.69 | |
Family First | Priscilla Smith | 2,982 | 3.65 | +3.65 | |
Greens | Sarai E O'Reilly-Reis | 2,406 | 2.94 | −0.20 | |
New Country | Alan Price | 1,691 | 2.07 | +2.07 | |
Democrats | Neal McKenzie | 1,049 | 1.28 | −2.32 | |
Great Australians | John Bennett | 473 | 0.58 | +0.56 | |
CEC | Rodney Stapleton | 458 | 0.56 | +0.29 | |
Total formal votes | 81,781 | 94.22 | −0.47 | ||
Informal votes | 5,019 | 5.78 | +0.47 | ||
Turnout | 86,800 | 94.83 | −1.09 | ||
Two-party-preferred result | |||||
Liberal | Cameron Thompson | 50,057 | 61.21 | +4.59 | |
Labor | Shayne Neumann | 31,724 | 38.79 | −4.59 | |
Liberal hold | Swing | +4.59 |
Party | Candidate | Votes | % | ±% | |
---|---|---|---|---|---|
Liberal | Ross Vasta | 34,334 | 44.13 | +1.74 | |
Labor | Con Sciacca | 33,261 | 42.75 | −2.08 | |
Greens | Elissa Jenkins | 3,836 | 4.93 | +1.92 | |
Family First | Trevor Hunt | 3,393 | 4.36 | +4.36 | |
One Nation | Barry Myatt | 1,436 | 1.85 | −1.87 | |
Democrats | Chad Smith | 1,090 | 1.40 | −3.09 | |
CEC | William Wheeler | 451 | 0.58 | +0.58 | |
Total formal votes | 77,801 | 94.36 | −1.35 | ||
Informal votes | 4,651 | 5.64 | +1.35 | ||
Turnout | 82,452 | 94.74 | −1.14 | ||
Two-party-preferred result | |||||
Liberal | Ross Vasta | 39,298 | 50.51 | +2.40 | |
Labor | Con Sciacca | 38,503 | 49.49 | −2.40 | |
Liberal gain from Labor | Swing | +2.40 |
Party | Candidate | Votes | % | ±% | |
---|---|---|---|---|---|
Liberal | Andrew Southcott | 43,640 | 50.62 | +2.48 | |
Labor | Chloë Fox | 30,893 | 35.84 | +9.92 | |
Greens | Adrian Miller | 6,131 | 7.11 | +3.93 | |
Family First | Paul Munn | 2,571 | 2.98 | +2.98 | |
Democrats | Robert Simms | 1,746 | 2.03 | −16.89 | |
Independent | Paul Starling | 646 | 0.75 | +0.21 | |
One Nation | Clarke Staker | 581 | 0.67 | −1.95 | |
Total formal votes | 86,208 | 95.59 | +0.13 | ||
Informal votes | 3,976 | 4.41 | −0.13 | ||
Turnout | 90,184 | 94.59 | −1.38 | ||
Two-party-preferred result | |||||
Liberal | Andrew Southcott | 47,730 | 55.37 | −2.00 | |
Labor | Chloë Fox | 38,478 | 44.63 | +2.00 | |
Liberal hold | Swing | −2.00 |
Party | Candidate | Votes | % | ±% | |
---|---|---|---|---|---|
Liberal | Barry Wakelin | 49,155 | 56.49 | +2.01 | |
Labor | John Hackett | 26,375 | 30.31 | -0.86 | |
Family First | Roger Kleinig | 4,397 | 5.05 | +5.05 | |
Greens | Felicity Martin | 2,872 | 3.30 | +0.87 | |
Democrats | Gil Robertson | 2,036 | 2.34 | -2.46 | |
One Nation | Peter Fitzpatrick | 1,903 | 2.19 | -4.93 | |
CEC | Paul Siebert | 270 | 0.31 | +0.31 | |
Total formal votes | 87,008 | 94.95 | -0.28 | ||
Informal votes | 4,631 | 5.05 | +0.28 | ||
Turnout | 91,639 | 94.19 | -0.99 | ||
Two-party-preferred result | |||||
Liberal | Barry Wakelin | 55,528 | 63.82 | +3.17 | |
Labor | John Hackett | 31,480 | 36.18 | -3.17 | |
Liberal hold | Swing | +3.17 |
Party | Candidate | Votes | % | ±% | |
---|---|---|---|---|---|
Liberal | Simon Birmingham | 39,869 | 45.88 | +0.81 | |
Labor | Steve Georganas | 36,786 | 42.33 | +3.54 | |
Greens | Tim White | 4,437 | 5.11 | +1.49 | |
Family First | Trevor Grace | 1,953 | 2.25 | +2.25 | |
Democrats | Nicole Prince | 1,366 | 1.57 | -7.46 | |
Independent | Joe Ienco | 1,130 | 1.30 | +1.30 | |
One Nation | Barbara Pannach | 490 | 0.56 | -2.85 | |
Independent | Tony Musolino | 478 | 0.55 | +0.55 | |
Independent | Bill Thomas | 397 | 0.46 | +0.46 | |
Total formal votes | 86,906 | 93.07 | -1.23 | ||
Informal votes | 6,470 | 6.93 | +1.23 | ||
Turnout | 93,376 | 94.71 | -1.82 | ||
Two-party-preferred result | |||||
Labor | Steve Georganas | 43,507 | 50.06 | +1.02 | |
Liberal | Simon Birmingham | 43,399 | 49.94 | -1.02 | |
Labor gain from Liberal | Swing | +1.02 |
Party | Candidate | Votes | % | ±% | |
---|---|---|---|---|---|
Liberal | Kym Richardson | 36,848 | 43.59 | +3.82 | |
Labor | David Cox | 35,748 | 42.29 | +3.41 | |
Family First | Andrew Cole | 4,767 | 5.64 | +5.64 | |
Greens | Yvonne Darlington | 4,478 | 5.30 | +1.96 | |
Democrats | Deirdre Albrighton | 1,825 | 2.16 | -9.70 | |
One Nation | Laurel Payne | 869 | 1.03 | -3.59 | |
Total formal votes | 84,535 | 94.23 | -0.26 | ||
Informal votes | 5,178 | 5.77 | +0.26 | ||
Turnout | 89,713 | 95.31 | -0.23 | ||
Two-party-preferred result | |||||
Liberal | Kym Richardson | 42,327 | 50.07 | +1.42 | |
Labor | David Cox | 42,208 | 49.93 | -1.42 | |
Liberal gain from Labor | Swing | +1.42 |
Party | Candidate | Votes | % | ±% | |
---|---|---|---|---|---|
Liberal | Trish Draper | 37,912 | 44.71 | -1.01 | |
Labor | Tony Zappia | 36,486 | 43.02 | +6.33 | |
Family First | Rob Pillar | 4,172 | 4.92 | +4.92 | |
Greens | Jon Moore | 3,213 | 3.79 | +1.47 | |
Democrats | Catherine Opitz | 1,484 | 1.75 | -8.67 | |
Independent | Jeanie Walker | 820 | 0.97 | +0.97 | |
One Nation | Victor Horvat | 715 | 0.84 | -3.87 | |
Total formal votes | 84,802 | 94.59 | -0.15 | ||
Informal votes | 4,851 | 5.41 | +0.15 | ||
Turnout | 89,653 | 95.47 | -0.67 | ||
Two-party-preferred result | |||||
Liberal | Trish Draper | 43,186 | 50.93 | -2.73 | |
Labor | Tony Zappia | 41,616 | 49.07 | +2.73 | |
Liberal hold | Swing | -2.73 |
Party | Candidate | Votes | % | ±% | |
---|---|---|---|---|---|
Liberal | Alexander Downer | 44,520 | 53.64 | +0.01 | |
Labor | James Murphy | 13,689 | 16.49 | -3.26 | |
Independent | Brian Deegan | 12,577 | 15.15 | +15.15 | |
Greens | Dennis Matthews | 6,305 | 7.60 | +2.13 | |
Family First | Kevin Cramp | 3,027 | 3.65 | +3.65 | |
Democrats | Kathy Brazher-de Laine | 1,505 | 1.81 | -11.90 | |
One Nation | Robert Fechner | 774 | 0.93 | -3.27 | |
Independent | Jon Grear | 606 | 0.73 | +0.73 | |
Total formal votes | 83,003 | 95.36 | +0.30 | ||
Informal votes | 4,039 | 4.64 | -0.30 | ||
Turnout | 87,042 | 95.21 | +0.56 | ||
Two-party-preferred result | |||||
Liberal | Alexander Downer | 52,780 | 63.59 | -0.72 | |
Labor | James Murphy | 30,223 | 36.41 | +0.72 | |
Two-candidate-preferred result | |||||
Liberal | Alexander Downer | 51,303 | 61.81 | -2.49 | |
Independent | Brian Deegan | 31,700 | 38.19 | +38.19 | |
Liberal hold | Swing | N/A |
Party | Candidate | Votes | % | ±% | |
---|---|---|---|---|---|
Labor | Rod Sawford | 46,692 | 54.51 | +2.47 | |
Liberal | Terry Inglis | 27,338 | 31.92 | +5.21 | |
Greens | Anne McMenamin | 4,641 | 5.42 | +1.56 | |
Family First | Richard Bunting | 4,085 | 4.77 | +4.77 | |
Democrats | Trevor Tucker | 1,710 | 2.00 | -7.97 | |
One Nation | Stan Batten | 1,191 | 1.39 | -4.17 | |
Total formal votes | 85,657 | 92.92 | +0.33 | ||
Informal votes | 6,522 | 7.08 | -0.33 | ||
Turnout | 82,179 | 94.34 | -0.73 | ||
Two-party-preferred result | |||||
Labor | Rod Sawford | 53,888 | 62.91 | -3.09 | |
Liberal | Terry Inglis | 31,769 | 37.09 | +3.09 | |
Labor hold | Swing | -3.09 |
Party | Candidate | Votes | % | ±% | |
---|---|---|---|---|---|
Liberal | Christopher Pyne | 45,007 | 51.66 | +0.98 | |
Labor | Tony Barca | 30,099 | 34.55 | +5.21 | |
Greens | Zane Young | 5,279 | 6.06 | +2.28 | |
Family First | Sally McPherson | 4,167 | 4.78 | +4.78 | |
Democrats | Kerrin Pine | 1,970 | 2.26 | -9.01 | |
One Nation | Brian Richards | 597 | 0.69 | -2.41 | |
Total formal votes | 87,119 | 94.96 | +0.77 | ||
Informal votes | 4,624 | 5.04 | -0.77 | ||
Turnout | 91,743 | 94.79 | -0.95 | ||
Two-party-preferred result | |||||
Liberal | Christopher Pyne | 49,481 | 56.80 | -1.69 | |
Labor | Tony Barca | 37,638 | 43.20 | +1.69 | |
Liberal hold | Swing | -1.69 |
Party | Candidate | Votes | % | ±% | |
---|---|---|---|---|---|
Liberal | David Fawcett | 35,320 | 43.81 | +4.73 | |
Labor | Martyn Evans | 34,159 | 42.37 | +3.40 | |
Family First | David Pointon | 4,379 | 5.43 | +5.43 | |
Greens | Patricia Murray | 3,346 | 4.15 | +1.00 | |
One Nation | David Dwyer | 2,066 | 2.56 | -4.34 | |
Democrats | Richard Way | 1,346 | 1.67 | -7.87 | |
Total formal votes | 80,616 | 93.52 | -0.05 | ||
Informal votes | 5,585 | 6.48 | +0.05 | ||
Turnout | 86,585 | 94.98 | +0.08 | ||
Two-party-preferred result | |||||
Liberal | David Fawcett | 40,848 | 50.67 | +1.93 | |
Labor | Martyn Evans | 39,768 | 49.33 | -1.93 | |
Liberal gain from Labor | Swing | +1.93 |
The Australian Democrats is a centrist political party in Australia. Founded in 1977 from a merger of the Australia Party and the New Liberal Movement, both of which were descended from Liberal Party dissenting splinter groups, it was Australia's largest minor party from its formation in 1977 through to 2004 and frequently held the balance of power in the Senate during that time.
The Australian electoral system comprises the laws and processes used for the election of members of the Australian Parliament and is governed primarily by the Commonwealth Electoral Act 1918. The system presently has a number of distinctive features including compulsory enrolment, compulsory voting, majority-preferential instant-runoff voting in single-member seats to elect the lower house, the House of Representatives, and the use of the single transferable vote proportional representation system to elect the upper house, the Senate.
Elections in Australia take place periodically to elect the legislature of the Commonwealth of Australia, as well as for each Australian state and territory and for local government councils. Elections in all jurisdictions follow similar principles, although there are minor variations between them. The elections for the Australian Parliament are held under the federal electoral system, which is uniform throughout the country, and the elections for state and territory Parliaments are held under the electoral system of each state and territory.
The Division of Higgins is an Australian Electoral Division in Victoria for the Australian House of Representatives. The division covers 41 km2 (16 sq mi) in Melbourne's south-eastern suburbs. The main suburbs include Armadale, Ashburton, Carnegie, Glen Iris, Kooyong, Malvern, Malvern East, Murrumbeena, Prahran and Toorak; along with parts of Camberwell, Ormond and South Yarra. Though historically a safe conservative seat, Higgins was won by the Liberal Party by a margin of just 3.9 percent over the Labor Party at the 2019 election, the closest result in the seat’s history. It then flipped to Labor in the 2022 election.
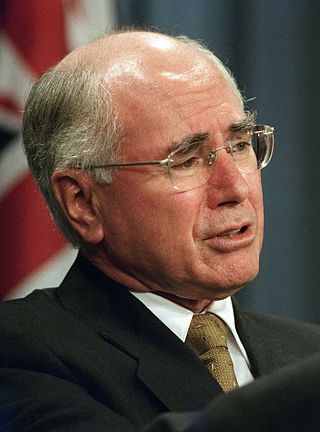
The 2004 Australian Federal Election was held on Saturday 9 October 2004 and it was the Howard Government’s opportunity to secure its 4th term of government after a tumultuous period in office. The Government consisting of the coalition Liberal Party and National Party headed by John Howard and John Anderson respectively were opposed by Mark Latham and the Labor Party. The issues that defined the election were The Iraq War, Australia’s economy, and the state of Australia’s social services
The Division of Dobell is an Australian electoral division in the state of New South Wales.
The Division of Boothby is an Australian federal electoral division in South Australia. The division was one of the seven established when the former Division of South Australia was redistributed on 2 October 1903 and is named after William Boothby (1829–1903), the Returning Officer for the first federal election.
The Division of Kingston is an Australian Electoral Division in South Australia covering the outer southern suburbs of Adelaide. The 171 km² seat stretches from Hallett Cove and O'Halloran Hill in the north to Sellicks Beach in the south, including the suburbs of Aberfoyle Park, Aldinga Beach, Christie Downs, Christies Beach, Flagstaff Hill, Hackham, Hallett Cove, Huntfield Heights, Lonsdale, Maslin Beach, Moana, Morphett Vale, Old Noarlunga, Onkaparinga Hills, Port Noarlunga, Reynella, Seaford, Sellicks Beach, Sheidow Park, Port Willunga, Trott Park, Woodcroft, and parts of Happy Valley and McLaren Flat.
The Division of Griffith is an electoral division for the Australian House of Representatives. The division covers the inner southern suburbs of Brisbane, Queensland.
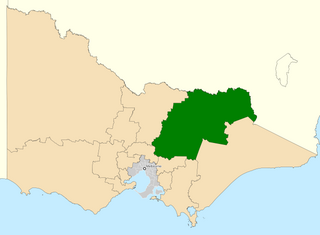
The Division of Indi is an Australian electoral division in the state of Victoria. The division is located in the north-east of the state, adjoining the border with New South Wales. The largest settlements in the division are the regional cities of Wodonga, Wangaratta, and Benalla. Other towns in the electorate include Rutherglen, Mansfield, Beechworth, Myrtleford, Bright, Alexandra, Tallangatta, Corryong and a number of other small villages. While Indi is one of the largest electorates in Victoria, much of it is located within the largely uninhabited Australian Alps. While Wodonga serves as a regional hub for much of the more heavily populated northern part of the electorate, the southern part is closer to Melbourne than Wodonga.
The Division of Richmond is an Australian electoral division in the state of New South Wales.
The Division of Watson is an Australian electoral division in the state of New South Wales.
In Australia, a redistribution is the process of redrawing the boundaries of electoral divisions for the House of Representatives arising from changes in population and changes in the number of representatives. There is no redistribution for the Senate as each State constitutes a division, though with multiple members. The Australian Electoral Commission (AEC), an independent statutory authority, oversees the apportionment and redistribution process for federal divisions, taking into account a number of factors. Politicians, political parties and the public may make submissions to the AEC on proposed new boundaries, but any interference with their deliberations is considered a serious offence.
Centre Alliance, formerly known as the Nick Xenophon Team (NXT), is a centrist political party in Australia based in the state of South Australia. It currently has one representative in the Parliament, namely Rebekha Sharkie in the House of Representatives.
The 2019 Australian federal election was held on Saturday 18 May 2019 to elect members of the 46th Parliament of Australia. The election had been called following the dissolution of the 45th Parliament as elected at the 2016 double dissolution federal election. All 151 seats in the House of Representatives and 40 of the 76 seats in the Senate were up for election.
This is a list of electoral division results for the Australian 2004 federal election in the state of Tasmania.
This is a list of electoral division results for the 2004 Australian federal election in the state of Western Australia.
This is a list of electoral division results in the Australian 2004 federal election for the state of New South Wales.
This is a list of electoral division results for the Australian 2004 federal election in the state of Queensland.
This is a list of electoral division results for the Australian 2004 federal election for the Australian Capital Territory and the Northern Territory.