| |||||||||||||||||||||||||||||||||||||
All 15 Western Australian seats in the Australian House of Representatives and 6 seats in the Australian Senate | |||||||||||||||||||||||||||||||||||||
---|---|---|---|---|---|---|---|---|---|---|---|---|---|---|---|---|---|---|---|---|---|---|---|---|---|---|---|---|---|---|---|---|---|---|---|---|---|
|
2004 Australian federal election |
---|
National results |
State and territory results |
This is a list of electoral division results for the 2004 Australian federal election in the state of Western Australia. [1] [2] [3]
Party | Votes | % | Swing | Seats | Change | ||
---|---|---|---|---|---|---|---|
Liberal | 528,016 | 48.13 | + 6.74 | 10 | 2 | ||
National | 6,895 | 0.63 | –0.39 | ||||
Liberal–National coalition | 534,911 | 48.76 | +6.35 | 10 | 2 | ||
Labor | 381,200 | 34.75 | –2.39 | 5 | 2 | ||
Greens | 84,100 | 7.67 | + 1.68 | ||||
One Nation | 27,650 | 2.52 | –3.75 | ||||
Christian Democratics | 24,650 | 2.25 | +1.07 | ||||
Democrats | 16,298 | 1.49 | –3.17 | ||||
Citizens Electoral Council | 6,539 | 0.60 | +0.33 | ||||
Family First | 2,619 | 0.24 | +0.24 | ||||
New Country | 2,625 | 0.24 | +0.25 | ||||
Socialist Alliance | 1,620 | 0.15 | +0.15 | ||||
Independents | 14,861 | 1.35 | + 0.82 | ||||
Total | 1,158,687 | 15 | |||||
Two-party-preferred vote | |||||||
Liberal/National Coalition | 607,829 | 55.40 | + 3.78 | 10 | 2 | ||
Labor | 489,244 | 44.60 | –3.78 | 5 | 2 | ||
Invalid/blank votes | 61,614 | 5.32 | +0.40 | ||||
Registered voters/turnout | 1,248,732 | 92.79 | |||||
Source: AEC Tally Room |
Party | Candidate | Votes | % | ±% | |
---|---|---|---|---|---|
Labor | Kim Beazley | 34,892 | 47.09 | −4.62 | |
Liberal | Phil Edman | 29,563 | 39.89 | +15.92 | |
Greens | Jean Jenkins | 3,578 | 4.83 | +1.35 | |
One Nation | Garth Stockden | 2,045 | 2.76 | −3.38 | |
Christian Democrats | Rajesh Vettoor | 1,581 | 2.13 | +1.26 | |
Independent | Gerard Kettle | 1,084 | 1.46 | +1.46 | |
Citizens Electoral Council | Rob Totten | 742 | 1.00 | +0.77 | |
Democrats | John Partridge | 619 | 0.84 | −1.55 | |
Total formal votes | 74,104 | 94.20 | −1.49 | ||
Informal votes | 4,566 | 5.80 | +1.49 | ||
Turnout | 78,670 | 93.41 | −1.79 | ||
Two-party-preferred result | |||||
Labor | Kim Beazley | 40,499 | 54.65 | −5.40 | |
Liberal | Phil Edman | 33,605 | 45.35 | +5.40 | |
Labor hold | Swing | −5.40 |
Party | Candidate | Votes | % | ±% | |
---|---|---|---|---|---|
Liberal | Don Randall | 39,354 | 52.74 | +10.90 | |
Labor | Kay Hallahan | 24,533 | 32.88 | −5.41 | |
Greens | Margo Beilby | 3,766 | 5.05 | −0.31 | |
One Nation | Angelo Dacheff | 2,035 | 2.73 | −4.46 | |
Christian Democrats | Vivian Hill | 1,802 | 2.41 | −0.16 | |
Independent | Margaret Dodd | 871 | 1.17 | +1.17 | |
Democrats | Tony Bennell | 864 | 1.16 | −2.65 | |
Family First | Bev Custers | 756 | 1.01 | +1.01 | |
Citizens Electoral Council | Brian McCarthy | 642 | 0.86 | −0.08 | |
Total formal votes | 74,623 | 94.29 | −0.57 | ||
Informal votes | 4,515 | 5.71 | +0.57 | ||
Turnout | 79,138 | 93.78 | −1.40 | ||
Two-party-preferred result | |||||
Liberal | Don Randall | 44,434 | 59.54 | +9.16 | |
Labor | Kay Hallahan | 30,189 | 40.46 | −9.16 | |
Liberal hold | Swing | +9.16 |
Party | Candidate | Votes | % | ±% | |
---|---|---|---|---|---|
Liberal | Luke Simpkins | 33,905 | 44.39 | +8.27 | |
Labor | Graham Edwards | 33,510 | 43.87 | −3.88 | |
Greens | Glen George | 4,272 | 5.59 | +1.53 | |
Christian Democrats | Richard Leeder | 1,873 | 2.45 | +0.91 | |
One Nation | Clem Winton | 1,538 | 2.01 | −3.67 | |
Democrats | Sarah Gilfillan | 1,002 | 1.31 | −2.97 | |
Citizens Electoral Council | Basil Atkins | 282 | 0.37 | +0.37 | |
Total formal votes | 76,382 | 94.99 | −0.34 | ||
Informal votes | 4,032 | 5.01 | +0.34 | ||
Turnout | 80,414 | 94.17 | −1.55 | ||
Two-party-preferred result | |||||
Labor | Graham Edwards | 38,784 | 50.78 | −4.73 | |
Liberal | Luke Simpkins | 37,598 | 49.22 | +4.73 | |
Labor hold | Swing | −4.73 |
Party | Candidate | Votes | % | ±% | |
---|---|---|---|---|---|
Liberal | Julie Bishop | 45,081 | 59.59 | +4.43 | |
Labor | Bill Kruse | 17,968 | 23.75 | +0.31 | |
Greens | Sonja Lundie-Jenkins | 8,689 | 11.48 | +2.23 | |
Democrats | Rob Olver | 1,688 | 2.23 | −4.18 | |
Christian Democrats | Gail Forder | 1,272 | 1.68 | +0.67 | |
One Nation | Albert Caine | 744 | 0.98 | −1.44 | |
Citizens Electoral Council | Colin Horne | 216 | 0.29 | +0.29 | |
Total formal votes | 75,658 | 96.48 | −0.22 | ||
Informal votes | 2,760 | 3.52 | +0.22 | ||
Turnout | 78,418 | 93.12 | −1.93 | ||
Two-party-preferred result | |||||
Liberal | Julie Bishop | 48,887 | 64.62 | +0.71 | |
Labor | Bill Kruse | 26,771 | 35.38 | −0.71 | |
Liberal hold | Swing | +0.71 |
Party | Candidate | Votes | % | ±% | |
---|---|---|---|---|---|
Liberal | Geoff Prosser | 41,422 | 53.42 | +7.39 | |
Labor | Tresslyn Smith | 21,655 | 27.93 | −2.68 | |
Greens | Kingsley Gibson | 6,549 | 8.45 | +1.28 | |
One Nation | Alan Giorgi | 2,667 | 3.44 | −6.61 | |
Democrats | Adam Welch | 1,311 | 1.69 | −1.63 | |
Family First | Linda Rose | 1,281 | 1.65 | +1.65 | |
Christian Democrats | Shane Flanegan | 1,242 | 1.60 | +1.60 | |
New Country | Ken Vagg | 1,075 | 1.39 | +1.39 | |
Citizens Electoral Council | Ian Tuffnell | 334 | 0.43 | +0.05 | |
Total formal votes | 77,536 | 94.50 | −0.45 | ||
Informal votes | 4,512 | 5.50 | +0.45 | ||
Turnout | 82,048 | 94.15 | −1.53 | ||
Two-party-preferred result | |||||
Liberal | Geoff Prosser | 46,871 | 60.45 | +2.84 | |
Labor | Tresslyn Smith | 30,665 | 39.55 | −2.84 | |
Liberal hold | Swing | +2.84 |
Party | Candidate | Votes | % | ±% | |
---|---|---|---|---|---|
Labor | Carmen Lawrence | 32,394 | 44.58 | −2.43 | |
Liberal | Carmelo Zagami | 26,118 | 35.94 | +5.54 | |
Greens | Nicola Paris | 8,562 | 11.78 | +2.72 | |
One Nation | Craig Mackintosh | 1,687 | 2.32 | −3.63 | |
Christian Democrats | Michelle Shave | 1,524 | 2.10 | +0.69 | |
Democrats | Delys Beaumont | 1,231 | 1.69 | −3.66 | |
Citizens Electoral Council | Damian Poole | 800 | 1.10 | +1.10 | |
Socialist Alliance | Ian Jamieson | 350 | 0.48 | +0.48 | |
Total formal votes | 72,666 | 93.15 | −1.14 | ||
Informal votes | 5,344 | 6.85 | +1.14 | ||
Turnout | 78,010 | 93.20 | −1.74 | ||
Two-party-preferred result | |||||
Labor | Carmen Lawrence | 41,970 | 57.76 | −2.91 | |
Liberal | Carmelo Zagami | 30,696 | 42.24 | +2.91 | |
Labor hold | Swing | -2.91 |
Party | Candidate | Votes | % | ±% | |
---|---|---|---|---|---|
Liberal | Stuart Henry | 32,457 | 45.37 | +6.04 | |
Labor | Sharryn Jackson | 27,395 | 38.29 | +0.06 | |
Greens | Jane Bremmer | 4,911 | 6.86 | +1.19 | |
One Nation | Paul Nield | 2,413 | 3.37 | −3.63 | |
Christian Democrats | Terry Ryan | 2,221 | 3.10 | +0.69 | |
Democrats | Nicola Hannah | 1,236 | 1.73 | −3.18 | |
Citizens Electoral Council | Simon Hall | 913 | 1.28 | +0.14 | |
Total formal votes | 71,546 | 95.02 | +0.82 | ||
Informal votes | 3,752 | 4.98 | −0.82 | ||
Turnout | 75,298 | 93.49 | −1.72 | ||
Two-party-preferred result | |||||
Liberal | Stuart Henry | 37,078 | 51.82 | +3.60 | |
Labor | Sharryn Jackson | 34,468 | 48.18 | −3.60 | |
Liberal gain from Labor | Swing | +3.60 |
Party | Candidate | Votes | % | ±% | |
---|---|---|---|---|---|
Liberal | Barry Haase | 29,475 | 45.46 | +2.86 | |
Labor | Tom Stephens | 20,691 | 31.92 | −3.14 | |
Independent | Graeme Campbell | 6,654 | 10.26 | +10.26 | |
Greens | Kado Muir | 4,101 | 6.33 | +2.55 | |
One Nation | Robin Scott | 1,511 | 2.33 | −6.27 | |
Christian Democrats | Craig Hendry | 827 | 1.28 | +1.28 | |
Independent | Brendon Cook | 506 | 0.78 | +0.78 | |
Democrats | Don Hoddy | 496 | 0.77 | −2.75 | |
Citizens Electoral Council | Lorraine Thomas | 318 | 0.49 | +0.33 | |
Independent | Nabil Haji Rowland | 252 | 0.39 | +0.39 | |
Total formal votes | 64,831 | 94.66 | +0.26 | ||
Informal votes | 3,656 | 5.34 | −0.26 | ||
Turnout | 68,487 | 83.53 | −3.28 | ||
Two-party-preferred result | |||||
Liberal | Barry Haase | 36,502 | 56.30 | +1.96 | |
Labor | Tom Stephens | 28,329 | 43.70 | −1.96 | |
Liberal hold | Swing | +1.96 |
Party | Candidate | Votes | % | ±% | |
---|---|---|---|---|---|
Liberal | Mal Washer | 37,739 | 55.34 | +6.35 | |
Labor | Kim Young | 21,446 | 31.45 | −2.22 | |
Greens | Thor Kerr | 4,829 | 7.08 | +1.66 | |
Christian Democrats | Evelynne Wong | 1,445 | 2.12 | +2.12 | |
One Nation | George Gault | 1,388 | 2.04 | −2.49 | |
Democrats | Kevin Payne | 1,160 | 1.70 | −3.29 | |
Citizens Electoral Council | Arthur Harvey | 189 | 0.28 | +0.28 | |
Total formal votes | 68,196 | 95.66 | −0.38 | ||
Informal votes | 3,092 | 4.34 | +0.38 | ||
Turnout | 71,288 | 93.90 | −1.62 | ||
Two-party-preferred result | |||||
Liberal | Mal Washer | 41,486 | 60.83 | +4.79 | |
Labor | Kim Young | 26,710 | 39.17 | −4.79 | |
Liberal hold | Swing | +4.79 |
Party | Candidate | Votes | % | ±% | |
---|---|---|---|---|---|
Liberal | Wilson Tuckey | 38,878 | 53.25 | +3.77 | |
Labor | Ursula Richards | 13,559 | 18.57 | −1.21 | |
National | Leigh Hardingham | 6,895 | 9.44 | +2.09 | |
Greens | Adrian Price | 4,910 | 6.73 | +2.00 | |
One Nation | Brian McRae | 3,177 | 4.35 | −7.42 | |
Christian Democrats | Justin Moseley | 2,060 | 2.82 | +0.66 | |
Independent | George Giudice | 2,013 | 2.76 | +2.76 | |
New Country | Jan Hough | 639 | 0.88 | +0.88 | |
Democrats | David Thackrah | 511 | 0.70 | −1.32 | |
Citizens Electoral Council | Callum Payne | 367 | 0.50 | +0.05 | |
Total formal votes | 73,009 | 94.51 | +0.43 | ||
Informal votes | 4,245 | 5.49 | −0.43 | ||
Turnout | 77,254 | 93.26 | −2.04 | ||
Two-party-preferred result | |||||
Liberal | Wilson Tuckey | 51,389 | 70.39 | +1.30 | |
Labor | Ursula Richards | 21,620 | 29.61 | −1.30 | |
Liberal hold | Swing | +1.30 |
Party | Candidate | Votes | % | ±% | |
---|---|---|---|---|---|
Liberal | Judi Moylan | 40,300 | 53.72 | +8.89 | |
Labor | David Ritter | 21,046 | 28.05 | −2.27 | |
Greens | Dominique Lieb | 5,891 | 7.85 | +0.63 | |
One Nation | David Gunnyon | 2,803 | 3.74 | −4.95 | |
Christian Democrats | Robert Merrells | 2,235 | 2.98 | +1.76 | |
Democrats | Donella McLean | 1,155 | 1.54 | −2.94 | |
New Country | Jeanette Radisich | 911 | 1.21 | +1.21 | |
Citizens Electoral Council | Ron McLean | 396 | 0.53 | +0.10 | |
Socialist Alliance | Annolies Truman | 286 | 0.38 | +0.38 | |
Total formal votes | 75,023 | 94.70 | −0.32 | ||
Informal votes | 4,201 | 5.30 | +0.32 | ||
Turnout | 79,224 | 93.67 | −1.30 | ||
Two-party-preferred result | |||||
Liberal | Judi Moylan | 47,219 | 62.94 | +6.06 | |
Labor | David Ritter | 27,804 | 37.06 | −6.06 | |
Liberal hold | Swing | +6.06 |
Party | Candidate | Votes | % | ±% | |
---|---|---|---|---|---|
Labor | Stephen Smith | 33,532 | 45.59 | −2.29 | |
Liberal | Alexander Lawrance | 27,127 | 36.88 | +4.55 | |
Greens | Alison Xamon | 7,045 | 9.58 | +2.22 | |
Christian Democrats | Augustine Loh | 1,807 | 2.46 | +2.46 | |
One Nation | Marie Edmonds | 1,463 | 1.99 | −2.40 | |
Democrats | Ray Bradbury | 1,344 | 1.83 | −5.45 | |
Socialist Alliance | Nikki Ulasowski | 984 | 1.34 | +1.34 | |
Citizens Electoral Council | Ross Russell | 247 | 0.34 | +0.34 | |
Total formal votes | 73,549 | 94.02 | −0.96 | ||
Informal votes | 4,680 | 5.98 | +0.96 | ||
Turnout | 78,229 | 92.93 | −1.92 | ||
Two-party-preferred result | |||||
Labor | Stephen Smith | 41,723 | 56.73 | −4.48 | |
Liberal | Alexander Lawrance | 31,826 | 43.27 | +4.48 | |
Labor hold | Swing | -4.48 |
Party | Candidate | Votes | % | ±% | |
---|---|---|---|---|---|
Liberal | Michael Keenan | 35,938 | 47.26 | +7.07 | |
Labor | Jann McFarlane | 29,616 | 38.94 | −2.30 | |
Greens | Katrina Bercov | 5,438 | 7.15 | +1.17 | |
Christian Democrats | Ray Moran | 1,472 | 1.94 | +0.61 | |
One Nation | Alex Patrick | 1,119 | 1.47 | −2.48 | |
Democrats | Giuseppe Coletti | 1,108 | 1.46 | −4.47 | |
Citizens Electoral Council | Leone Pearson | 691 | 0.91 | +0.91 | |
Independent | Marcus Anderson | 664 | 0.87 | +0.87 | |
Total formal votes | 76,046 | 94.08 | −0.52 | ||
Informal votes | 4,785 | 5.92 | +0.52 | ||
Turnout | 80,831 | 92.95 | −1.78 | ||
Two-party-preferred result | |||||
Liberal | Michael Keenan | 39,578 | 52.04 | +3.62 | |
Labor | Jann McFarlane | 36,468 | 47.96 | −3.62 | |
Liberal gain from Labor | Swing | +3.62 |
Party | Candidate | Votes | % | ±% | |
---|---|---|---|---|---|
Liberal | Andrew Murfin | 30,598 | 44.14 | +5.16 | |
Labor | Kim Wilkie | 27,675 | 39.92 | −1.35 | |
Greens | Dave Fort | 5,745 | 8.29 | +2.41 | |
One Nation | Ted Vermeer | 1,232 | 1.78 | −2.87 | |
Christian Democrats | Gwen Hamence | 1,214 | 1.75 | +0.15 | |
Democrats | Mark Reynolds | 1,133 | 1.63 | −4.08 | |
Independent | Teresa van Lieshout | 947 | 1.37 | +1.37 | |
Family First | Peter Greaves | 582 | 0.84 | +0.84 | |
Citizens Electoral Council | Azmi Johari | 198 | 0.29 | −0.08 | |
Total formal votes | 69,324 | 94.54 | −0.59 | ||
Informal votes | 4,006 | 5.46 | +0.59 | ||
Turnout | 73,330 | 92.18 | −2.05 | ||
Two-party-preferred result | |||||
Labor | Kim Wilkie | 34,714 | 50.08 | −1.96 | |
Liberal | Andrew Murfin | 34,610 | 49.92 | +1.96 | |
Labor hold | Swing | -1.96 |
Party | Candidate | Votes | % | ±% | |
---|---|---|---|---|---|
Liberal | Dennis Jensen | 40,061 | 53.72 | +3.91 | |
Labor | Gavin Waugh | 21,288 | 28.54 | −3.29 | |
Greens | Andrew Duckett | 5,814 | 7.80 | +2.77 | |
Christian Democrats | Colleen Tapley | 2,075 | 2.78 | +1.24 | |
Independent | Wilson Wu | 1,870 | 2.51 | +2.51 | |
One Nation | Lloyd Boon | 1,828 | 2.45 | −0.94 | |
Democrats | Andrew Ingram | 1,440 | 1.93 | −3.38 | |
Citizens Electoral Council | Neil Vincent | 204 | 0.27 | +0.27 | |
Total formal votes | 74,580 | 95.56 | −0.40 | ||
Informal votes | 3,468 | 4.44 | +0.40 | ||
Turnout | 78,048 | 93.91 | −1.52 | ||
Two-party-preferred result | |||||
Liberal | Dennis Jensen | 46,050 | 61.75 | +3.78 | |
Labor | Gavin Waugh | 28,530 | 38.25 | −3.78 | |
Liberal hold | Swing | +3.78 |
Kim Christian Beazley is an Australian former politician and diplomat. Since 2022 he has served as the Chairman of the Australian War Memorial. Previously, he was leader of the Australian Labor Party (ALP) and leader of the opposition from 1996 to 2001 and 2005 to 2006, having previously been a cabinet minister in the Hawke and Keating governments. After leaving parliament, he served as ambassador to the United States from 2010 to 2016 and 33rd governor of Western Australia from 2018 to 2022.
The 2001 Australian federal election was held in Australia on 10 November 2001. All 150 seats in the House of Representatives and 40 seats in the 76-member Senate were up for election. The incumbent Liberal Party of Australia led by Prime Minister of Australia John Howard and coalition partner the National Party of Australia led by John Anderson defeated the opposition Australian Labor Party led by Kim Beazley. Future Opposition Leader Peter Dutton entered parliament at this election. As of 2023 this was the most recent federal election to have a rematch in 11 years, and the most recent repeated election when Howard beat Beazley just 3 years earlier and until 2013 to have both major party leaders running in previous federal elections as major party leaders when in 2013, and the last for both major party leaders to appear in consecutive federal elections in 24 years.
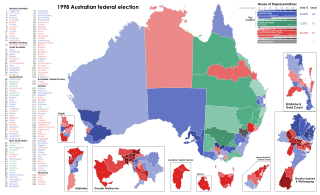
The 1998 Australian federal election was held to determine the members of the 39th Parliament of Australia. It was held on 3 October 1998. All 148 seats of the House of Representatives and 40 seats of the 76-seat Senate were up for election. The incumbent centre-right Liberal/National Coalition government led by Prime Minister John Howard of the Liberal Party and coalition partner Tim Fischer of the National Party defeated the centre-left Australian Labor Party opposition led by Opposition Leader Kim Beazley, despite losing the nationwide popular and two-party preferred vote. However, the Australian Labor Party gained seats from the previous election.
The 2004 Australian federal election was held in Australia on 9 October 2004. All 150 seats in the House of Representatives and 40 seats in the 76-member Senate were up for election. The incumbent Liberal Party of Australia led by Prime Minister of Australia John Howard and coalition partner the National Party of Australia led by John Anderson defeated the opposition Australian Labor Party led by Mark Latham.
The 2004 Australian federal election was held on Saturday 9 October 2004 and it was the Howard government's opportunity to secure its fourth term of government. The Government consisting of the conservative coalition Liberal Party and National Party headed by John Howard and John Anderson respectively were opposed by Mark Latham and the Labor Party.
The Division of Brand is an Australian electoral division in Perth, Western Australia. Brand was first created in 1984 and is named after Sir David Brand, Premier of Western Australia 1959-71. Brand governed Western Australia at a time when the state was developing its new mining and industrial base.
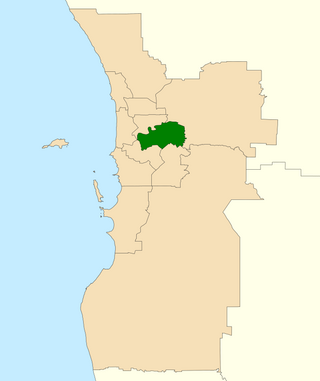
The Division of Swan is an Australian electoral division located in Western Australia.
The Division of Stirling was an Australian electoral division in the inner northern and beachside suburbs of Perth, Western Australia, which included a large portion of the local government area of the City of Stirling.
The Division of Boothby is an Australian federal electoral division in South Australia. The division was one of the seven established when the former Division of South Australia was redistributed on 2 October 1903 and is named after William Boothby (1829–1903), the Returning Officer for the first federal election.
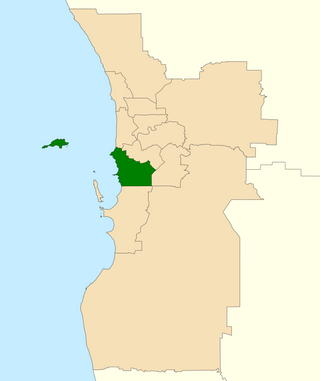
The Division of Fremantle is an electoral division of the Australian House of Representatives in Western Australia.
The Division of Greenway is an Australian electoral division in the state of New South Wales.
The Division of Macquarie is an Australian electoral division in the state of New South Wales. The division was created in 1900 and was one of the original 65 divisions contested at the first federal election. It is named for Lachlan Macquarie, who was Governor of New South Wales between 1810 and 1821.
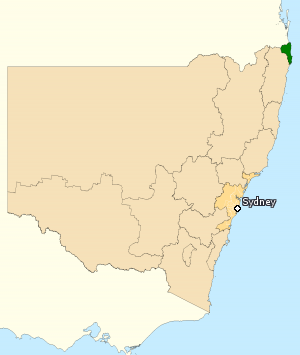
The Division of Richmond is an Australian electoral division in the state of New South Wales.
The Division of McMillan was an Australian Electoral Division in the state of Victoria. It was located in the western part of the Gippsland region, which extends for the length of Victoria's eastern Bass Strait coastline. It included the outer south-eastern Melbourne suburb of Pakenham, and also included the towns of Warragul, Moe, Wonthaggi, Leongatha and Foster. It stretched from Mount Baw Baw and the Baw Baw National Park in the north to Wilsons Promontory, and the Wilsons Promontory National Park in the south. It was the southernmost electoral division in continental Australia. It was replaced by the Division of Monash in 2019.
The Division of Watson is an Australian electoral division in the state of New South Wales.
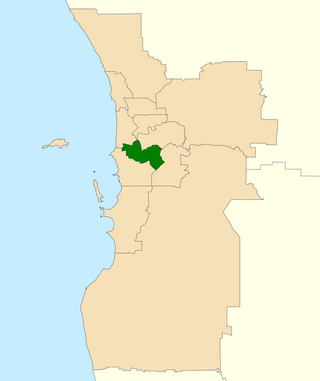
The Division of Tangney is an Australian electoral division in the state of Western Australia. The Division was named after Dame Dorothy Tangney, the first female member of the Australian Senate.
Alfred Cove was an electoral district of the Legislative Assembly of Western Australia. It was located in Perth's southern suburbs, and named after the riverside suburb of Alfred Cove.
This is a list of electoral division results for the Australian 2004 federal election in the state of Tasmania.
This is a list of electoral division results for the Australian 2004 federal election in the state of Victoria.
This is a list of electoral division results for the Australian 2004 federal election in the state of Queensland.