Electoral results for the Division of Forrest

Last updated

This is a list of electoral results for the Division of Forrest in Australian federal elections from the division's creation in 1922 until the present.

Contents

Members

MemberPartyTerm
  John Prowse Country 1922–1943
  Nelson Lemmon Labor 1943–1949
  Gordon Freeth Liberal 1949–1969
  Frank Kirwan Labor 1969–1972
  Peter Drummond Liberal 1972–1987
Geoff Prosser 1987–2007
Nola Marino 2007–present

Election results

Elections in the 2020s

2022

2022 Australian federal election: Forrest [1]
PartyCandidateVotes%±%
Liberal Nola Marino 36,59743.62−8.86
Labor Bronwen English23,26527.73+6.58
Greens Christine Terrantroy10,77012.84+0.00
One Nation Shane Mezger4,3755.21−0.74
Great Australian Tracy Aitken2,6313.14+3.14
United Australia Helen Allan2,0982.50+0.77
Western Australia Greg Stephens1,8152.16+0.87
Liberal Democrats Paul Markham1,3741.64+1.64
Australian Federation Mailee Dunn9831.17+1.17
Total formal votes83,90894.74+0.38
Informal votes4,6565.26−0.38
Turnout 88,56478.27
Liberal Nola Marino 45,91554.72−9.86
Labor Bronwen English37,99345.28+9.86
Liberal hold Swing −9.86
Results are not final. Last updated on 27 May 2022 at 11:00 pm AEST.

Elections in the 2010s

2019

2019 Australian federal election: Forrest [2]
PartyCandidateVotes%±%
Liberal Nola Marino 47,47052.48+3.04
Labor Wayne Sanford19,12621.14−2.00
Greens Nerilee Boshammer11,64512.87+0.90
One Nation Kalven Jamieson5,3715.94+5.94
Shooters, Fishers, Farmers Mark McCall2,8813.18+3.18
United Australia Dale Bromley1,5641.73+1.73
Independent Alexander Marsden1,2381.37+1.37
Western Australia Ian Molyneux1,1671.29+1.29
Total formal votes90,46294.35+0.21
Informal votes5,4185.65−0.21
Turnout 95,88090.95+1.23
Liberal Nola Marino 58,40564.56+2.00
Labor Wayne Sanford32,05735.44−2.00
Liberal hold Swing +2.00

2016

2016 Australian federal election: Forrest [3]
PartyCandidateVotes%±%
Liberal Nola Marino 41,86949.44−1.81
Labor Lorrae Loud19,59623.14−0.39
Greens Jill Reading10,13711.97+2.13
National Luke Pilkington4,3065.08−1.31
Independent Ross Slater2,8963.42+3.42
Outdoor Recreation David Fishlock2,3752.80+2.80
Christians Edward Dabrowski1,8582.19+0.56
Rise Up Australia Jennifer Whately1,6541.95+1.27
Total formal votes84,69194.14−0.27
Informal votes5,2695.86+0.27
Turnout 89,96089.72−0.43
Liberal Nola Marino 52,98162.56−1.25
Labor Lorrae Loud31,71037.44+1.25
Liberal hold Swing −1.25

2013

2013 Australian federal election: Forrest [4]
PartyCandidateVotes%±%
Liberal Nola Marino 42,64049.92+0.96
Labor John Borlini21,57925.26−2.93
Greens Gordon Tayler8,1369.52−3.96
National Michael Rose5,3386.25+0.27
Palmer United Edward Dabrowski4,3015.03+5.03
Christians Wayne Barnett1,3741.61+1.61
Family First Bev Custers1,2701.49−0.46
Rise Up Australia Mark Morien5810.68+0.68
CEC Ian Tuffnell2040.24+0.24
Total formal votes85,42394.37−1.08
Informal votes5,0955.63+1.08
Turnout 90,51893.41−0.78
Liberal Nola Marino 53,19862.28+3.54
Labor John Borlini32,22537.72−3.54
Liberal hold Swing +3.54

2010

2010 Australian federal election: Forrest [5]
PartyCandidateVotes%±%
Liberal Nola Marino 39,46048.96+3.81
Labor Jackie Jarvis 22,72428.19-2.43
Greens Luke Petersen10,86313.48+5.07
National John Hill4,8225.98+5.98
Family First Bev Custers1,5731.95+0.57
Christian Democrats Lee Herridge1,1581.44-0.45
Total formal votes80,60095.45-1.27
Informal votes3,8444.55+1.27
Turnout 84,44494.21-0.29
Liberal Nola Marino 47,34358.74+3.26
Labor Jackie Jarvis 33,25741.26-3.26
Liberal hold Swing +3.26

Elections in the 2000s

2007

2007 Australian federal election: Forrest
PartyCandidateVotes%±%
Liberal Nola Marino 38,92845.40-8.02
Labor Peter Macfarlane25,88330.18+2.25
Independent Noel Brunning 9,92411.57+11.57
Greens Kingsley Gibson7,1508.34-0.11
Christian Democrats John Lewis1,6431.92+0.32
Family First Leighton Knoll1,1501.34-0.31
One Nation Jodie Yardley9281.08-2.36
CEC Ian Tuffnell1440.17-0.26
Total formal votes85,75096.67+2.17
Informal votes2,9543.33= -2.17
Turnout 88,70494.69+0.54
Two-party-preferred result
Liberal Nola Marino 47,87155.83-4.62
Labor Peter Macfarlane37,87944.17+4.62
Liberal hold Swing -4.62

2004

2004 Australian federal election: Forrest
PartyCandidateVotes%±%
Liberal Geoff Prosser 41,42253.42+7.39
Labor Tresslyn Smith21,65527.93-2.68
Greens Kingsley Gibson6,5498.45+1.28
One Nation Alan Giorgi2,6673.44-6.61
Democrats Adam Welch1,3111.69-1.63
Family First Linda Rose1,2811.65+1.65
Christian Democrats Shane Flanegan1,2421.60+1.60
New Country Ken Vagg1,0751.39+1.39
CEC Ian Tuffnell3340.43+0.05
Total formal votes77,53694.50-0.45
Informal votes4,5125.50+0.45
Turnout 82,04894.15-1.53
Two-party-preferred result
Liberal Geoff Prosser 46,87160.45+2.84
Labor Tresslyn Smith30,66539.55-2.84
Liberal hold Swing +2.84

2001

2001 Australian federal election: Forrest
PartyCandidateVotes%±%
Liberal Geoff Prosser 34,39246.03+3.79
Labor Tresslyn Smith22,87230.61-0.10
One Nation Alan Giorgi7,51010.05-1.88
Greens Paul Llewellyn 5,3597.17+1.07
Democrats Alison Wylie2,4773.31+0.27
National Charles Caldwell1,3971.87-1.09
Curtin Labor Alliance Megan Kirwan4330.58+0.58
CEC Arthur Harvey2810.38+0.25
Total formal votes74,72194.95+0.08
Informal votes3,9765.05-0.08
Turnout 78,69796.36
Two-party-preferred result
Liberal Geoff Prosser 43,04957.61+3.01
Labor Tresslyn Smith31,67242.39-3.01
Liberal hold Swing +3.01

Elections in the 1990s

1998

1998 Australian federal election: Forrest
PartyCandidateVotes%±%
Liberal Geoff Prosser 32,17142.78-14.34
Labor Tony Dean 20,33227.04-1.67
One Nation Paddy Embry 10,02913.34+13.34
Greens Paul Llewellyn 5,3037.05-0.42
National Steve Thomas2,3543.13+3.13
Democrats Alf Denman2,2533.00-2.13
Christian Democrats Jim Cummins1,3161.75+1.75
Australia First Ted Stone8971.19+1.19
Jon Doust 4240.56+0.56
CEC John Watson1170.16+0.16
Total formal votes75,19694.90-2.43
Informal votes4,0375.10+2.43
Turnout 79,23395.85-0.04
Two-party-preferred result
Liberal Geoff Prosser 42,77556.88-7.21
Labor Tony Dean 32,42143.12+7.21
Liberal hold Swing -7.21

1996

1996 Australian federal election: Forrest
PartyCandidateVotes%±%
Liberal Geoff Prosser 43,06756.99+0.92
Labor Ann Mills21,92029.01-1.71
Greens Basil Schur5,5377.33-0.88
Democrats Ronald Hellyer3,8645.11+0.11
Independent Alexander Marsden1,1811.56+1.56
Total formal votes75,56997.35-0.25
Informal votes2,0602.65+0.25
Turnout 77,62995.88-0.94
Two-party-preferred result
Liberal Geoff Prosser 47,82163.64+1.91
Labor Ann Mills27,32036.36-1.91
Liberal hold Swing +1.91

1993

1993 Australian federal election: Forrest
PartyCandidateVotes%±%
Liberal Geoff Prosser 40,09956.07+7.74
Labor Peter Procter21,96430.71+1.48
Greens Jill Reading5,8698.21-0.53
Democrats David Churches3,5815.01-2.23
Total formal votes71,51397.60+0.65
Informal votes1,7602.40-0.65
Turnout 73,27396.82
Two-party-preferred result
Liberal Geoff Prosser 44,12461.73+1.82
Labor Peter Procter27,35038.27-1.82
Liberal hold Swing +1.82

1990

1990 Australian federal election: Forrest
PartyCandidateVotes%±%
Liberal Geoff Prosser 31,77048.3+1.8
Labor Simon Keely19,21929.2-10.5
Greens Giz Watson 5,7428.7+8.7
Democrats David Churches4,7607.2+1.6
National Rick Beatty4,2456.5-1.7
Total formal votes65,73696.9
Informal votes2,0693.1
Turnout 67,80595.7
Two-party-preferred result
Liberal Geoff Prosser 39,32859.9+4.3
Labor Simon Keely26,31540.1-4.3
Liberal hold Swing +4.3

Elections in the 1980s

1987

1987 Australian federal election: Forrest
PartyCandidateVotes%±%
Liberal Geoff Prosser 27,92544.0-6.4
Labor Gerry Thompson26,76442.2-3.5
National Joe Chambers5,1758.2+8.2
Democrats David Churches3,5535.6+2.7
Total formal votes63,41794.4
Informal votes3,7475.6
Turnout 67,16495.3
Two-party-preferred result
Liberal Geoff Prosser 33,67853.1+0.7
Labor Gerry Thompson29,73746.9-0.7
Liberal hold Swing +0.7

1984

1984 Australian federal election: Forrest
PartyCandidateVotes%±%
Liberal Peter Drummond 30,00950.4+1.9
Labor Peter Holland 27,17745.7+0.1
Democrats Anne Fussell1,7012.9-0.8
Independent Alfred Bussell6461.1-1.2
Total formal votes59,53393.8
Informal votes3,9426.2
Turnout 63,47595.4
Two-party-preferred result
Liberal Peter Drummond 31,20252.4+1.4
Labor Peter Holland 28,32747.6-1.4
Liberal hold Swing +1.4

1983

1983 Australian federal election: Forrest
PartyCandidateVotes%±%
Liberal Peter Drummond 32,07648.9-2.4
Labor David Churches29,64345.2+9.2
Democrats Donald Stewart2,4163.7-3.3
Independent Alfred Bussell1,4852.3+2.3
Total formal votes65,62098.1
Informal votes1,2811.9
Turnout 66,90194.7
Two-party-preferred result
Liberal Peter Drummond 33,73551.4-8.4
Labor David Churches31,88548.6+8.4
Liberal hold Swing -8.4

1980

1980 Australian federal election: Forrest
PartyCandidateVotes%±%
Liberal Peter Drummond 31,00551.3+4.4
Labor Walter MacMillan21,74936.0+6.7
Democrats Alfred Bussell4,2067.0+0.0
National Country Francis Timms3,4685.7-7.2
Total formal votes60,42897.3
Informal votes1,6632.7
Turnout 62,09194.0
Two-party-preferred result
Liberal Peter Drummond 59.8-4.4
Labor Walter MacMillan40.2+4.4
Liberal hold Swing -4.4

Elections in the 1970s

1977

1977 Australian federal election: Forrest
PartyCandidateVotes%±%
Liberal Peter Drummond 30,72348.4-8.1
Labor Allan Drake-Brockman17,64027.8-5.0
National Country John Gardiner8,18312.9+3.6
Democrats Donald Stewart4,4667.0+7.0
Progress Reginald Crabb2,4953.9+3.9
Total formal votes63,50796.8
Informal votes2,1143.2
Turnout 65,62196.2
Two-party-preferred result
Liberal Peter Drummond 65.7+0.1
Labor Allan Drake-Brockman34.3-0.1
Liberal hold Swing +0.1

1975

1975 Australian federal election: Forrest
PartyCandidateVotes%±%
Liberal Peter Drummond 30,15854.7+8.0
Labor Geoffrey Davy19,07534.6-2.6
National Country Noel Klopper5,1349.3-5.7
Independent Noel Duggan4840.9+0.9
Independent Duncan Hordacre2900.5+0.5
Total formal votes55,14197.8
Informal votes1,2172.2
Turnout 56,35896.7
Two-party-preferred result
Liberal Peter Drummond 63.8+2.4
Labor Geoffrey Davy36.2-2.4
Liberal hold Swing +2.4

1974

1974 Australian federal election: Forrest
PartyCandidateVotes%±%
Liberal Peter Drummond 24,86046.7+14.7
Labor Albert Newman19,80137.2-6.4
National Alliance Terence Best7,96715.0-8.4
Australia Lawrence Gibson5691.1+0.1
Total formal votes53,19798.0
Informal votes1,0842.0
Turnout 54,28196.4
Two-party-preferred result
Liberal Peter Drummond 32,68961.4+7.8
Labor Albert Newman20,50838.6-7.8
Liberal hold Swing +7.8

1972

1972 Australian federal election: Forrest
PartyCandidateVotes%±%
Labor Frank Kirwan 20,84343.6-4.0
Liberal Peter Drummond 15,30432.0-10.9
Country David Reid 9,72320.3+20.3
Democratic Labor John Fleeton1,4833.1-4.1
Australia Russell Moffet4551.0-1.4
Total formal votes47,80897.7
Informal votes1,1432.3
Turnout 48,95195.9
Two-party-preferred result
Liberal Peter Drummond 25,61553.6+4.7
Labor Frank Kirwan 22,19346.4-4.7
Liberal gain from Labor Swing +4.7

Elections in the 1960s

1969

1969 Australian federal election: Forrest
PartyCandidateVotes%±%
Labor Frank Kirwan 22,14947.6+9.9
Liberal Gordon Freeth 19,95542.9-9.2
Democratic Labor Henry Sullivan3,3327.2-3.0
Australia Anthony Montgomery1,1062.4+2.4
Total formal votes46,54297.6
Informal votes1,1322.4
Turnout 47,67496.2
Two-party-preferred result
Labor Frank Kirwan 23,79851.1+11.6
Liberal Gordon Freeth 22,74448.9-11.6
Labor gain from Liberal Swing +11.6

1966

1966 Australian federal election: Forrest
PartyCandidateVotes%±%
Liberal Gordon Freeth 20,83451.1-1.0
Labor Frank Kirwan 15,79638.7-0.9
Democratic Labor Maurice Bailey4,16310.2+10.2
Total formal votes40,79396.4
Informal votes1,5243.6
Turnout 42,31796.2
Two-party-preferred result
Liberal Gordon Freeth 59.5+3.3
Labor Frank Kirwan 40.5-3.3
Liberal hold Swing +3.3

1963

1963 Australian federal election: Forrest
PartyCandidateVotes%±%
Liberal Gordon Freeth 20,92152.1-5.4
Labor Robert Smithson15,89939.6-2.9
Independent Country Frank Oates3,3048.2+8.2
Total formal votes40,12498.6
Informal votes5831.4
Turnout 40,70796.6
Two-party-preferred result
Liberal Gordon Freeth 56.2-1.3
Labor Robert Smithson43.8+1.3
Liberal hold Swing -1.3

1961

1961 Australian federal election: Forrest
PartyCandidateVotes%±%
Liberal Gordon Freeth 22,27557.5+5.9
Labor Ernest Stapleton16,46242.5+3.7
Total formal votes38,73797.1
Informal votes1,1482.9
Turnout 39,88596.0
Liberal hold Swing -2.0

Elections in the 1950s

1958

1958 Australian federal election: Forrest
PartyCandidateVotes%±%
Liberal Gordon Freeth 19,27351.6-48.4
Labor Ernest Stapleton14,48038.8+38.8
Democratic Labor Arthur Addis3,6009.6+9.6
Total formal votes37,35396.6
Informal votes1,3173.4
Turnout 38,67097.0
Two-party-preferred result
Liberal Gordon Freeth 59.5-40.5
Labor Ernest Stapleton40.5+40.5
Liberal hold Swing -40.5

1955

1955 Australian federal election: Forrest
PartyCandidateVotes%±%
Liberal Gordon Freeth unopposed
Liberal hold Swing

1954

1954 Australian federal election: Forrest
PartyCandidateVotes%±%
Liberal Gordon Freeth 23,64357.7-1.8
Labor Frederick O'Connor17,33142.3+1.8
Total formal votes40,97498.4
Informal votes6831.6
Turnout 41,65797.3
Liberal hold Swing -1.8

1951

1951 Australian federal election: Forrest
PartyCandidateVotes%±%
Liberal Gordon Freeth 22,28759.5+32.5
Labor Frederick O'Connor15,17140.5-3.3
Total formal votes37,45897.7
Informal votes8682.3
Turnout 38,32697.0
Liberal hold Swing +6.7

Elections in the 1940s

1949

1949 Australian federal election: Forrest
PartyCandidateVotes%±%
Labor Nelson Lemmon 15,93543.8-7.8
Country Arnold Potts 10,00327.5+6.3
Liberal Gordon Freeth 9,82827.0-0.2
Independent James Bolitho6421.8+1.8
Total formal votes36,40898.0
Informal votes7492.0
Turnout 37,15797.5
Two-party-preferred result
Liberal Gordon Freeth 19,21752.8+4.4
Labor Nelson Lemmon 17,19147.2-4.4
Liberal gain from Labor Swing +4.4

1946

1946 Australian federal election: Forrest
PartyCandidateVotes%±%
Labor Nelson Lemmon 23,94450.1-2.8
Liberal James Cumming13,34928.0+28.0
Country Jasper Norton10,46621.9-12.4
Total formal votes47,75997.8
Informal votes1,0642.2
Turnout 48,82394.5
Two-party-preferred result
Labor Nelson Lemmon 52.3-6.1
Liberal James Cumming47.7+47.7
Labor hold Swing -6.1

1943

1943 Australian federal election: Forrest
PartyCandidateVotes%±%
Labor Nelson Lemmon 23,93152.9+8.3
Country John Prowse 15,50734.3-21.1
Independent Ian Fergusson-Stewart3,2647.2+7.2
Independent Country Arthur West2,1564.8+4.8
Independent Wildred Lewis3770.8+0.8
Total formal votes45,23597.1
Informal votes1,3432.9
Turnout 46,57897.5
Two-party-preferred result
Labor Nelson Lemmon 58.4+13.8
Country John Prowse 42.6-13.8
Labor gain from Country Swing +13.8

1940

1940 Australian federal election: Forrest
PartyCandidateVotes%±%
Country John Prowse 24,61955.4+1.0
Labor Vane Green19,83244.6-1.0
Total formal votes44,45197.7
Informal votes1,0532.3
Turnout 45,50494.1
Country hold Swing +1.0

Elections in the 1930s

1937

1937 Australian federal election: Forrest
PartyCandidateVotes%±%
Country John Prowse 22,89454.4-5.7
Labor Ernest Hoar 19,15345.6+17.0
Total formal votes42,04796.7
Informal votes1,4303.3
Turnout 43,47794.2
Country hold Swing -9.4

1934

1934 Australian federal election: Forrest
PartyCandidateVotes%±%
Country John Prowse 18,99647.2-52.8
Labor Edwin Davies11,66029.0+29.0
Country Cecil Elsegood4,82612.0+12.0
Social Credit Harry Squance4,73411.8+11.8
Total formal votes40,21696.8
Informal votes1,5933.8
Turnout 41,80992.0
Two-party-preferred result
Country John Prowse 63.8-36.2
Labor Edwin Davies36.2+36.2
Country hold Swing -36.2

1931

1931 Australian federal election: Forrest
PartyCandidateVotes%±%
Country John Prowse unopposed
Country hold Swing

Elections in the 1920s

1929

1929 Australian federal election: Forrest
PartyCandidateVotes%±%
Country John Prowse unopposed
Country hold Swing

1928

1928 Australian federal election: Forrest
PartyCandidateVotes%±%
Country John Prowse 21,46360.4-0.5
Labor Cornelius Buckley14,04939.6+0.5
Total formal votes35,51296.4
Informal votes1,3093.6
Turnout 36,82190.3
Country hold Swing -0.5

1925

1925 Australian federal election: Forrest
PartyCandidateVotes%±%
Country John Prowse 21,76060.9-18.6
Labor Thomas Lowry13,97639.1+39.1
Total formal votes35,73696.5
Informal votes1,3013.5
Turnout 37,03789.9
Country hold Swing -18.6

1922

1922 Australian federal election: Forrest
PartyCandidateVotes%±%
Country John Prowse 10,00779.5+33.1
Nationalist Peter Wedd2,57620.5+0.3
Total formal votes12,58390.6
Informal votes1,3039.4
Turnout 13,88640.9
Country notional  hold Swing +14.9

Related Research Articles

Division of Forrest Australian federal electoral division

The Division of Forrest is an Australian Electoral Division in Western Australia.

Division of OConnor Australian federal electoral division

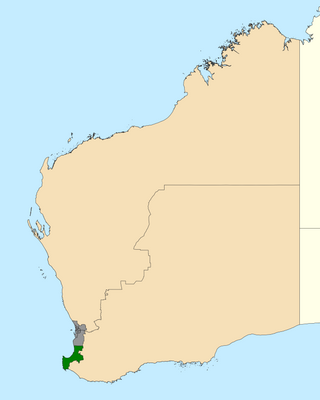
The Division of O'Connor is an Australian electoral division in the state of Western Australia. It is one of Western Australia's three rural seats, and one of the largest electoral constituencies in the world.

This is a list of electoral results for the Division of Macquarie in Australian federal elections from the division's creation in 1901 until the present.

This article lists electoral results for the Division of Fremantle in Australian federal elections from the division's creation in 1901 to the present.

This is a list of electoral results for the Division of Ballarat in Australian federal elections from the division's creation in 1901 until the present. The seat was known as Ballaarat from 1901 until 1977.

This is a list of electoral results for the Division of Kooyong in Australian federal elections from the division's creation in 1901 until the present.

This is a list of electoral results for the Division of Brand in Australian federal elections from the division's creation in 1984 until the present.

This is a list of electoral results for the Division of Cowan in Australian federal elections from the division's creation in 1984 until the present.

This is a list of electoral results for the Division of Curtin in Australian federal elections from the division's creation in 1949 until the present.

This is a list of electoral results for the Division of Hasluck in Australian federal elections from the division's creation in 2001 until the present.

This is a list of electoral results for the Division of Moore in Australian federal elections from the division's creation in 1949 until the present.

This is a list of electoral results for the Division of O'Connor in Australian federal elections from the division's creation in 1980 until the present.

This is a list of electoral results for the Division of Pearce in Australian federal elections from the division's creation in 1990 until the present.

This is a list of electoral results for the Division of Perth in Australian federal elections from the division's creation in 1901 until the present.

This is a list of electoral results for the Division of Stirling in Australian federal elections from the division's creation in 1955 until 2019. The division was abolished in 2022.

This is a list of electoral results for the Division of Swan in Australian federal elections from the division's creation in 1901 until the present.

This is a list of electoral results for the Division of Tangney in Australian federal elections from the division's creation in 1974 until the present.

This is a list of electoral results for the Division of Durack in Australian federal elections from the division's creation in 2008 until the present.

Results of the 2019 Australian federal election in Western Australia

This is a list of electoral division results for the 2019 Australian federal election in the state of Western Australia.

Results of the 2022 Australian federal election in Western Australia Federal election results in Western Australia

The 2022 Australian federal election was held on 21 May 2022 to elect all 151 members of the Australian House of Representatives and 40 of 76 members of the Australian Senate. Of those, 15 MPs and 6 senators were elected to represent the state of Western Australia. In this election, the Australian Labor Party led by Anthony Albanese took 4 House seats from the opposing Liberal Party of Australia, thereby gaining the majority of Western Australia's lower house seats for the first time since 1993. The Liberals under Scott Morrison lost a total of 6 seats, including all but 2 of its seats in the Perth metropolitan area.

References

  1. Forrest, WA, 2022 Tally Room, Australian Electoral Commission.
  2. Forrest, WA, Tally Room 2019, Australian Electoral Commission.
  3. Forrest, WA, Virtual Tally Room 2016, Australian Electoral Commission.
  4. 2013 results for Forrest, AEC.
  5. "2010 results for Forrest". AEC.