Results of the 2010 Australian federal election in Western Australia

Last updated

2010 Australian federal election
(Western Australia)
Flag of Western Australia.svg
  2007 21 August 2010 2013  

All 15 Western Australia seats in the Australian House of Representatives
and 6 (of the 12) seats in the Australian Senate
 First partySecond partyThird party
  Tony Abbott - 2010.jpg Julia Gillard 2010.jpg Warren Truss Portrait 2010.jpg
Leader Tony Abbott Julia Gillard Warren Truss
Party Liberal Labor National
Last election11 seats4 seats0 seats
Seats won11 seats3 seats 1 seat
Seat changeSteady2.svgDecrease2.svg 1Increase2.svg 1
Popular vote566,145375,38143,101
Percentage47.02%31.18%3.58%
SwingIncrease2.svg 0.71%Decrease2.svg 5.62%Increase2.svg 2.44%
TPP 56.41%43.59%
TPP swingIncrease2.svg 3.15Decrease2.svg 3.15

WAstate2010.gif
Results by electorate

This is a list of electoral division results for the 2010 Australian federal election for the state of Western Australia. [1] [2]

Contents

Overall

Electoral divisions: Western Australia WAstate2010.gif
Electoral divisions: Western Australia
Turnout 92.86% (CV) — Informal 4.82%
PartyVotes%SwingSeatsChange
  Liberal 566,14547.02+0.7111Steady2.svg
  Labor 375,38131.18–5.623Decrease2.svg 1
  Greens 158,11713.13+4.20
  National [lower-alpha 1] 43,1013.58+2.441Increase2.svg 1
  Christian Democrats 27,8332.31+0.20
  Family First 20,6981.72+0.51
  Independents 5,0790.42–1.27
  Sex Party 2,0600.17+0.17
  One Nation 1,4710.12−1.03
  Socialist Alliance 1,2800.11+0.01
  Citizens Electoral Council 1,2770.11−0.15
  Democratic Labour 6220.05+0.05
  Climate Sceptics 5390.04+0.04
  Socialist Equality 3980.03+0.02
Total1,204,001  15
Two-party-preferred vote
  Liberal 679,14056.41+3.1511Steady2.svg
  Labor 524,86143.59–3.153Decrease2.svg 1
Invalid/blank votes60,9674.82+0.97
Registered voters/turnout1,362,53492.84
Source: Commonwealth Election 2010

Results by division

Brand

2010 Australian federal election: Brand [4]
PartyCandidateVotes%±%
Labor Gary Gray 31,83240.80-5.53
Liberal Donna Gordin30,73139.38+1.28
Greens Dawn Jecks11,50414.74+5.88
Family First Andrew Newhouse2,1902.81+1.03
Christian Democrats Robert Burdett1,7712.27-0.30
Total formal votes78,02894.77-1.36
Informal votes4,3045.23+1.36
Turnout 82,33293.34+0.07
Two-party-preferred result
Labor Gary Gray 41,61053.33-2.65
Liberal Donna Gordin36,41846.67+2.65
Labor hold Swing -2.65

Canning

2010 Australian federal election: Canning [5]
PartyCandidateVotes%±%
Liberal Don Randall 36,99946.18-2.23
Labor Alannah MacTiernan 32,33040.35+2.62
Greens Denise Hardie6,6458.29+0.54
Christian Democrats Jamie van Burgel2,4703.08+0.28
Family First Darren Vernede1,2311.54+0.28
Citizens Electoral Council Ian Tuffnell4460.56+0.24
Total formal votes80,12195.48-1.07
Informal votes3,7954.52+1.07
Turnout 83,91693.13+0.01
Two-party-preferred result
Liberal Don Randall 41,81852.19-2.16
Labor Alannah MacTiernan 38,30347.81+2.16
Liberal hold Swing -2.16

Cowan

2010 Australian federal election: Cowan [6]
PartyCandidateVotes%±%
Liberal Luke Simpkins 40,07750.06+4.75
Labor Chas Hopkins 25,97532.45-9.91
Greens Rob Phillips10,03312.53+6.83
Christian Democrats David Kingston2,0812.60+0.70
Family First Alan Leach1,8882.36+0.64
Total formal votes80,05494.88-0.96
Informal votes4,3205.12+0.96
Turnout 84,37494.22-0.37
Two-party-preferred result
Liberal Luke Simpkins 45,06256.29+5.01
Labor Chas Hopkins 34,99243.71-5.01
Liberal hold Swing +5.01

Curtin

2010 Australian federal election: Curtin [7]
PartyCandidateVotes%±%
Liberal Julie Bishop 50,02461.13+2.17
Labor Sophie van der Merwe15,77119.27-5.71
Greens George Crisp14,49817.72+4.49
Christian Democrats Pat Seymour1,5341.87+0.61
Total formal votes81,82797.07-0.97
Informal votes2,4712.93+0.97
Turnout 84,29893.25-0.63
Two-party-preferred result
Liberal Julie Bishop 54,15866.19+2.93
Labor Sophie van der Merwe27,66933.81-2.93
Liberal hold Swing +2.93

Durack

2010 Australian federal election: Durack [8]
PartyCandidateVotes%±%
Liberal Barry Haase 32,44645.07-1.00
Labor Shane Hill 17,29924.03-8.80
National Lynne Craigie12,74217.70+9.67
Greens Julie Matheson6,6619.25+3.32
Family First Jane Foreman1,7292.40+1.09
Christian Democrats Mac Forsyth1,1211.56-0.32
Total formal votes71,99895.14-0.44
Informal votes3,6784.86+0.44
Turnout 75,67688.22+1.06
Two-party-preferred result
Liberal Barry Haase 45,84363.67+6.02
Labor Shane Hill 26,15536.33-6.02
Liberal hold Swing +6.02

Forrest

2010 Australian federal election: Forrest [9]
PartyCandidateVotes%±%
Liberal Nola Marino 39,46048.96+3.81
Labor Jackie Jarvis 22,72428.19-2.43
Greens Luke Petersen10,86313.48+5.07
National John Hill4,8225.98+5.98
Family First Bev Custers1,5731.95+0.57
Christian Democrats Lee Herridge1,1581.44-0.45
Total formal votes80,60095.45-1.27
Informal votes3,8444.55+1.27
Turnout 84,44494.21-0.29
Two-party-preferred result
Liberal Nola Marino 47,34358.74+3.26
Labor Jackie Jarvis 33,25741.26-3.26
Liberal hold Swing +3.26

Fremantle

2010 Australian federal election: Fremantle [10]
PartyCandidateVotes%±%
Labor Melissa Parke 32,06338.94-6.24
Liberal Matt Taylor 31,75538.57+3.48
Greens Kate Davis14,53117.65+3.07
Family First Larry Parsons1,4091.71+0.28
Christian Democrats Scott Robertson1,2941.57-0.15
Socialist Alliance Sanna Andrew6620.80+0.35
Democratic Labor Keith McEncroe6220.76+0.76
Total formal votes82,33694.57-1.18
Informal votes4,7245.43+1.18
Turnout 87,06093.27-0.51
Two-party-preferred result
Labor Melissa Parke 45,85855.70-3.44
Liberal Matt Taylor 36,47844.30+3.44
Labor hold Swing -3.44

Hasluck

2010 Australian federal election: Hasluck [11]
PartyCandidateVotes%±%
Liberal Ken Wyatt 34,63841.99-1.38
Labor Sharryn Jackson 30,95737.53-3.82
Greens Glenice Smith10,53912.78+4.47
Christian Democrats Linda Brewer2,5053.04+0.04
Family First Jim McCourt1,8612.26+1.03
Independent Dot Henry1,4571.77+1.77
Climate Sceptics Andrew Middleton5390.65+0.65
Total formal votes82,49694.36-1.31
Informal votes4,9275.64+1.31
Turnout 87,42393.11-0.56
Two-party-preferred result
Liberal Ken Wyatt 41,72250.57+1.42
Labor Sharryn Jackson 40,77449.43-1.42
Liberal gain from Labor Swing +1.42

Moore

2010 Australian federal election: Moore [12]
PartyCandidateVotes%±%
Liberal Mal Washer 44,51854.16+0.12
Labor Jeremy Brown21,67826.37-6.64
Greens Sheridan Young11,15913.57+5.45
Christian Democrats Meg Birch1,8042.19+0.03
Family First Paul Barrett1,5731.91+0.68
One Nation George Gault1,4711.79+0.74
Total formal votes82,20395.65-1.26
Informal votes3,7344.35+1.26
Turnout 85,93793.11-0.65
Two-party-preferred result
Liberal Mal Washer 50,30261.19+2.26
Labor Jeremy Brown31,90138.81-2.26
Liberal hold Swing +2.26

O'Connor

2010 Australian federal election: O'Connor [13]
PartyCandidateVotes%±%
Liberal Wilson Tuckey 31,29438.36-10.36
National Tony Crook 23,53828.85+19.68
Labor Ian Bishop13,96217.11-9.15
Greens Andy Huntley7,2328.86+1.73
Christian Democrats Jacky Young2,2212.72+0.09
Independent Geoffrey Stokes1,2981.59+1.59
Family First Pat Scallan1,1641.43+0.21
Independent Neil Smithson5000.61+0.61
Citizens Electoral Council Jean Robinson3750.46+0.08
Total formal votes81,58494.63-1.11
Informal votes4,6325.37+1.11
Turnout 86,21692.83-0.22
Notional two-party-preferred count
Liberal Wilson Tuckey 59,55573.00+10.24
Labor Ian Bishop22,02927.00-10.24
Two-candidate-preferred result
National Tony Crook 43,69353.56+53.56
Liberal Wilson Tuckey 37,89146.44-16.32
National gain from Liberal Swing N/A

Pearce

2010 Australian federal election: Pearce [14]
PartyCandidateVotes%±%
Liberal Judi Moylan 39,24849.91-0.52
Labor Bill Leadbetter 23,21429.52-3.63
Greens Toni Warden10,41413.24+4.32
National Darren Moir1,9992.54+2.54
Christian Democrats Janet Broadstock1,6912.15+0.18
Family First Ian Rose1,6192.06+0.60
Citizens Electoral Council Chris Pepper4560.58+0.28
Total formal votes78,64194.29-1.72
Informal votes4,7625.71+1.72
Turnout 83,40393.16-0.02
Two-party-preferred result
Liberal Judi Moylan 46,29258.86+1.17
Labor Bill Leadbetter 32,34941.14-1.17
Liberal hold Swing +1.17

Perth

2010 Australian federal election: Perth [15]
PartyCandidateVotes%±%
Labor Stephen Smith 32,22840.19-6.12
Liberal Joe Ferrante31,06438.74+1.84
Greens Jonathan Hallett12,94816.15+5.82
Christian Democrats Paul Connelly2,0932.61+0.62
Family First Nigel Irvine1,2431.55+0.45
Socialist Alliance Alex Bainbridge6180.77+0.22
Total formal votes80,19494.80-0.61
Informal votes4,4005.20+0.61
Turnout 84,59492.05-1.14
Two-party-preferred result
Labor Stephen Smith 44,81555.88-2.06
Liberal Joe Ferrante35,37944.12+2.06
Labor hold Swing -2.06

Stirling

2010 Australian federal election: Stirling [16]
PartyCandidateVotes%±%
Liberal Michael Keenan 40,22849.91+2.71
Labor Louise Durack25,68831.87-8.54
Greens Chris Martin10,39912.90+5.25
Independent Elizabeth Re1,8242.26+2.26
Christian Democrats Jenny Whately1,6302.02+0.26
Family First Peter Clifford8381.04+0.39
Total formal votes80,60794.98-0.11
Informal votes4,2595.02+0.11
Turnout 84,86692.52-1.08
Two-party-preferred result
Liberal Michael Keenan 44,77555.55+4.28
Labor Louise Durack35,83244.45-4.28
Liberal hold Swing +4.28

Swan

2010 Australian federal election: Swan [17]
PartyCandidateVotes%±%
Liberal Steve Irons 36,95146.51+2.76
Labor Tim Hammond 28,02335.28-5.69
Greens Rebecca Leighton9,38011.81+1.69
Sex Party Bret Treasure2,0602.59+2.59
Christian Democrats Steve Klomp1,6462.07+0.30
Family First Barry Drennan9811.23+0.38
Socialist Equality Joe Lopez3980.50+0.30
Total formal votes79,43995.10-0.36
Informal votes4,0894.90+0.36
Turnout 83,52892.03-0.97
Two-party-preferred result
Liberal Steve Irons 41,72952.53+2.80
Labor Tim Hammond 37,71047.47-2.80
Liberal gain from Labor Swing +2.80

Tangney

2010 Australian federal election: Tangney [18]
PartyCandidateVotes%±%
Liberal Dennis Jensen 46,71255.69+3.31
Labor David Doepel21,63725.80-5.73
Greens Peter Best11,31113.49+5.20
Christian Democrats Ka-ren Chew2,8143.36+1.01
Family First Moyna Rapp1,3991.67+0.53
Total formal votes83,87396.52-0.83
Informal votes3,0283.48+0.83
Turnout 86,90194.28-0.80
Two-party-preferred result
Liberal Dennis Jensen 52,26662.32+2.51
Labor David Doepel31,60737.68-2.51
Liberal hold Swing +2.51

See also

Notes

  1. The National Party of Western Australia prior to and subsequent to the election were not in the federal Coalition agreement. Nationals WA MP Tony Crook stated that he was a crossbencher, and has said: "In every news report and press report we see, my number is being allocated in with the Coalition and it shouldn't be". [3] Thus, the party has been counted separately from the Coalition totals.

Related Research Articles

The Australian electoral system comprises the laws and processes used for the election of members of the Australian Parliament and is governed primarily by the Commonwealth Electoral Act 1918. The system presently has a number of distinctive features including compulsory enrolment; compulsory voting; majority-preferential instant-runoff voting in single-member seats to elect the lower house, the House of Representatives; and the use of the single transferable vote proportional representation system to elect the upper house, the Senate.

<span class="mw-page-title-main">2001 Australian federal election</span> Election for the 40th Parliament of Australia

The 2001 Australian federal election was held in Australia on 10 November 2001. All 150 seats in the House of Representatives and 40 seats in the 76-member Senate were up for election. The incumbent Liberal Party of Australia led by Prime Minister of Australia John Howard and coalition partner the National Party of Australia led by John Anderson defeated the opposition Australian Labor Party led by Kim Beazley.

<span class="mw-page-title-main">1998 Australian federal election</span> Election for the 39th Parliament of Australia

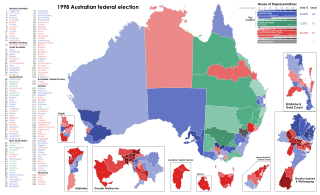
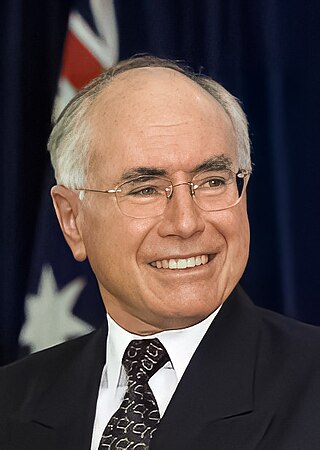
The 1998 Australian federal election was held to determine the members of the 39th Parliament of Australia. It was held on 3 October 1998. All 148 seats of the House of Representatives and 40 seats of the 76-seat Senate were up for election. The incumbent centre-right Liberal/National Coalition government led by Prime Minister John Howard of the Liberal Party and coalition partner Tim Fischer of the National Party defeated the centre-left Australian Labor Party opposition led by Opposition Leader Kim Beazley, despite losing the nationwide popular and two-party preferred vote.

<span class="mw-page-title-main">2004 Australian federal election</span> Election for the 41st Parliament of Australia

The 2004 Australian federal election was held in Australia on 9 October 2004. All 150 seats in the House of Representatives and 40 seats in the 76-member Senate were up for election. The incumbent Liberal Party of Australia led by Prime Minister of Australia John Howard and coalition partner the National Party of Australia led by John Anderson defeated the opposition Australian Labor Party led by Mark Latham.

<span class="mw-page-title-main">Australian Electoral Commission</span> National election commission

The Australian Electoral Commission (AEC) is the independent federal agency in charge of organising, conducting and supervising federal Australian elections, by-elections and referendums.

<span class="mw-page-title-main">Coalition (Australia)</span> Group of centre-right political parties in Australia

The Liberal–National Coalition, commonly known simply as "the Coalition" or informally as the LNP, is an alliance of centre-right political parties that forms one of the two major groupings in Australian federal politics. The two partners in the Coalition are the Liberal Party of Australia and the National Party of Australia. Its main opponent is the Australian Labor Party (ALP); the two forces are often regarded as operating in a two-party system. The Coalition was last in government from the 2013 federal election, before being unsuccessful at re-election in the 2022 Australian federal election. The group is led by Peter Dutton, who succeeded Scott Morrison after the 2022 Australian federal election.

<span class="mw-page-title-main">Division of Cowan</span> Australian federal electoral division

The Division of Cowan is an Australian Electoral Division in Western Australia.

<span class="mw-page-title-main">Division of Hasluck</span> Australian federal electoral division

The Division of Hasluck is an electoral division of the Australian House of Representatives, located in Western Australia.

<span class="mw-page-title-main">1990 Australian federal election</span> Election

The 1990 Australian federal election was held in Australia on 24 March 1990. All 148 seats in the House of Representatives and 40 seats in the 76-member Senate were up for election. The incumbent Australian Labor Party led by Bob Hawke defeated the opposition Liberal Party of Australia led by Andrew Peacock with coalition partner the National Party of Australia led by Charles Blunt despite losing the nationwide popular and two-party-preferred vote. The election saw the reelection of a Hawke government, the fourth successive term.

<span class="mw-page-title-main">1963 Australian federal election</span> Australian federal election

The 1963 Australian federal election was held in Australia on 30 November 1963. All 122 seats in the House of Representatives were up for election. The incumbent Liberal–Country coalition government, led by Prime Minister Sir Robert Menzies, won an increased majority over the opposition Labor Party, led by Arthur Calwell. This was the only time that a Federal Government won a seventh consecutive term in office.

<span class="mw-page-title-main">1961 Australian federal election</span> Election in Australia

The 1961 Australian federal election was held in Australia on 9 December 1961. All 122 seats in the House of Representatives and 31 of the 60 seats in the Senate were up for election. The incumbent Liberal–Country coalition led by Prime Minister Robert Menzies defeated the opposition Labor Party under Arthur Calwell, despite losing the two-party-preferred popular vote. In his first election as Labor leader, Calwell significantly reduced the Coalition's margin, gaining 15 seats to leave the government with only a two-seat majority. This was the first and only time that a Federal Government won a sixth consecutive term in office.

<span class="mw-page-title-main">2010 Australian federal election</span> Election for the 43rd Parliament of Australia

The 2010 Australian federal election was held on Saturday, 21 August 2010 to elect members of the 43rd Parliament of Australia. The incumbent centre-left Australian Labor Party led by Prime Minister Julia Gillard won a second term against the opposition centre-right Liberal Party of Australia led by Opposition Leader Tony Abbott and Coalition partner the National Party of Australia, led by Warren Truss, after Labor formed a minority government with the support of three independent MPs and one Australian Greens MP.

<span class="mw-page-title-main">2013 Australian federal election</span> Election for the 44th Parliament of Australia

The 2013 Australian federal election to elect the members of the 44th Parliament of Australia took place on 7 September 2013. The centre-right Liberal/National Coalition opposition led by Opposition leader Tony Abbott of the Liberal Party of Australia and Coalition partner the National Party of Australia, led by Warren Truss, defeated the incumbent centre-left Labor Party government of Prime Minister Kevin Rudd in a landslide. Labor had been in government for six years since being elected in the 2007 election. This election marked the end of the Rudd-Gillard-Rudd Labor government and the start of the 9 year long Abbott-Turnbull-Morrison Liberal-National Coalition government. Abbott was sworn in by the Governor-General, Quentin Bryce, as Australia's new Prime Minister on 18 September 2013, along with the Abbott Ministry. The 44th Parliament of Australia opened on 12 November 2013, with the members of the House of Representatives and territory senators sworn in. The state senators were sworn in by the next Governor-General Peter Cosgrove on 7 July 2014, with their six-year terms commencing on 1 July.

Anthony John Crook is a retired Australian politician. He was the member of the Australian House of Representatives seat of O'Connor for the National Party of Western Australia from the 2010 federal election until August 2013. Crook served as chairman of the Western Division of the Royal Flying Doctor Service for 10 years until his retirement in 2009.

The following tables show state-by-state results in the Australian House of Representatives at the 2010 federal election, Labor 72, Coalition 72, Nationals (WA) 1, Australian Greens 1, with 4 independents.

<span class="mw-page-title-main">2010 Australian Senate election</span> Australian federal election results

The following tables show state-by-state results in the Australian Senate at the 2010 federal election. Senators total 34 Coalition, 31 Labor, nine Green, one Democratic Labor Party, and one independent, Nick Xenophon. New Senators took their places from 1 July 2011.

The following tables show state-by-state results in the Australian House of Representatives at the 2013 federal election, Coalition 90, Labor 55, Australian Greens 1, Palmer United Party 1, Katter's Australian Party 1, with 2 independents.

<span class="mw-page-title-main">2013 Australian Senate election</span> Australian federal election results

The following tables show state-by-state results in the Australian Senate at the 2013 Australian federal election.

<span class="mw-page-title-main">2019 Australian federal election</span> Election for the 46th Parliament of Australia

The 2019 Australian federal election was held on Saturday 18 May 2019 to elect members of the 46th Parliament of Australia. The election had been called following the dissolution of the 45th Parliament as elected at the 2016 double dissolution federal election. All 151 seats in the House of Representatives and 40 of the 76 seats in the Senate were up for election.

The number of seats won by each party in the Australian House of Representatives at the 2022 federal election were: Coalition 58, Labor 77, Australian Greens 4, Centre Alliance 1, Katter's Australian Party 1, and Independents 10.

References

  1. "2010 election results by division WA". AEC.
  2. "2010 first preference votes for WA". AEC.
  3. Ker, Peter (26 August 2010). "Don't count me among Coalition, says Nat". The Age . Fairfax Media . Retrieved 27 August 2010.
  4. "2010 results for Brand". AEC.
  5. "2010 results for Canning". AEC.
  6. "2010 results for Cowan". AEC.
  7. "2010 results for Curtin". AEC.
  8. "2010 results for Durack". AEC.
  9. "2010 results for Forrest". AEC.
  10. "2010 results for Fremantle". AEC.
  11. "2010 results for Hasluck". AEC.
  12. "2010 results for Moore". AEC.
  13. "2010 results for O'Connor". AEC.
  14. "2010 results for Pearce". AEC.
  15. "2010 results for Perth". AEC.
  16. "2010 results for Stirling". AEC.
  17. "2010 results for Swan". AEC.
  18. "2010 results for Tangney". AEC.