| 2010 Australian federal election |
|---|
| National results |
| State and territory results |
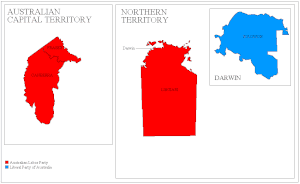
This is a list of electoral divisions for the Australian 2010 federal election for the Australian Capital Territory [1] and the Northern Territory. [2]
| 2010 Australian federal election |
|---|
| National results |
| State and territory results |
This is a list of electoral divisions for the Australian 2010 federal election for the Australian Capital Territory [1] and the Northern Territory. [2]
| ||||||||||||||||||||||||||||||||||
Both Australian Capital Territory seats in the Australian House of Representatives and both seats in the Australian Senate | ||||||||||||||||||||||||||||||||||
|---|---|---|---|---|---|---|---|---|---|---|---|---|---|---|---|---|---|---|---|---|---|---|---|---|---|---|---|---|---|---|---|---|---|---|
| ||||||||||||||||||||||||||||||||||
 Electoral divisions: Territories | ||||||||||||||||||||||||||||||||||
| Party | Votes | % | Swing | Seats | Change | |
|---|---|---|---|---|---|---|
| Australian Labor Party | 100,700 | 45.02 | –6.08 | 2 | ||
| Liberal | 77,880 | 34.81 | +1.58 | 0 | ||
| Australian Greens | 42,942 | 19.20 | +6.04 | |||
| Secular Party of Australia | 2,175 | 0.97 | +0.97 | |||
| Total | 223,697 | 2 | ||||
| Two-party-preferred vote | ||||||
| Australian Labor Party | 137,948 | 61.67 | –1.73 | 2 | ||
| Liberal | 85,749 | 38.33 | +1.73 | 0 | ||
| Invalid/blank votes | 10,926 | 4.66 | +2.35 | |||
| Registered voters/turnout | 247,941 | 94.63 | ||||
| Source: Commonwealth Election 2010 | ||||||
| Party | Candidate | Votes | % | ±% | |
|---|---|---|---|---|---|
| Labor | Gai Brodtmann | 49,608 | 44.23 | -6.87 | |
| Liberal | Giulia Jones | 41,732 | 37.21 | +2.08 | |
| Greens | Sue Ellerman | 20,816 | 18.56 | +5.61 | |
| Total formal votes | 112,156 | 95.12 | -2.62 | ||
| Informal votes | 5,755 | 4.88 | +2.62 | ||
| Turnout | 117,911 | 94.92 | -1.09 | ||
| Two-party-preferred result | |||||
| Labor | Gai Brodtmann | 66,335 | 59.15 | -2.67 | |
| Liberal | Giulia Jones | 45,821 | 40.85 | +2.67 | |
| Labor hold | Swing | -2.67 | |||
| Party | Candidate | Votes | % | ±% | |
|---|---|---|---|---|---|
| Labor | Andrew Leigh | 51,092 | 45.81 | -5.29 | |
| Liberal | James Milligan | 36,148 | 32.41 | +1.18 | |
| Greens | Indra Esguerra | 22,126 | 19.84 | +6.46 | |
| Secular | Quintin Hedges-Phillips | 2,175 | 1.95 | +1.95 | |
| Total formal votes | 111,541 | 95.57 | -2.07 | ||
| Informal votes | 5,171 | 4.43 | +2.07 | ||
| Turnout | 116,712 | 94.55 | -1.12 | ||
| Two-party-preferred result | |||||
| Labor | Andrew Leigh | 71,613 | 64.20 | -0.87 | |
| Liberal | James Milligan | 39,928 | 35.80 | +0.87 | |
| Labor hold | Swing | -0.87 | |||
| ||||||||||||||||||||||||||||||||||
Both Northern Territory seats in the Australian House of Representatives and both seats in the Australian Senate | ||||||||||||||||||||||||||||||||||
|---|---|---|---|---|---|---|---|---|---|---|---|---|---|---|---|---|---|---|---|---|---|---|---|---|---|---|---|---|---|---|---|---|---|---|
| ||||||||||||||||||||||||||||||||||
 Electoral divisions: Territories | ||||||||||||||||||||||||||||||||||
| Party | Votes | % | Swing | Seats | Change | |
|---|---|---|---|---|---|---|
| Country Liberal Party | 38,335 | 40.83 | –0.20 | 1 | ||
| Australian Labor Party | 35,589 | 37.91 | –9.74 | 1 | ||
| Australian Greens | 12,175 | 12.97 | +4.92 | |||
| Independents | 3,948 | 4.21 | +1.55 | |||
| Citizens Electoral Council | 2,331 | 2.48 | +2.23 | |||
| One Nation | 1,505 | 1.60 | +1.60 | |||
| Total | 93,883 | 2 | ||||
| Two-party-preferred vote | ||||||
| Australian Labor Party | 47,636 | 50.74 | –4.67 | 1 | ||
| Country Liberal Party | 46,247 | 49.26 | +4.67 | 1 | ||
| Invalid/blank votes | 6,198 | 6.19 | +2.34 | |||
| Registered voters/turnout | 121,059 | 82.67 | ||||
| Source: Commonwealth Election 2010 | ||||||
| Party | Candidate | Votes | % | ±% | |
|---|---|---|---|---|---|
| Labor | Warren Snowdon | 17,205 | 40.08 | -13.91 | |
| Country Liberal | Leo Abbott | 14,708 | 34.26 | -0.40 | |
| Greens | Barbara Shaw | 5,403 | 12.59 | +5.67 | |
| Independent | Deirdre Finter | 2,038 | 4.75 | +4.75 | |
| First Nations | Kenny Lechleitner | 1,910 | 4.45 | +4.45 | |
| Citizens Electoral Council | Peter Flynn | 1,663 | 3.87 | +3.87 | |
| Total formal votes | 42,927 | 92.50 | -2.65 | ||
| Informal votes | 3,482 | 7.50 | +2.65 | ||
| Turnout | 46,409 | 75.92 | -5.34 | ||
| Two-party-preferred result | |||||
| Labor | Warren Snowdon | 23,051 | 53.70 | -7.46 | |
| Country Liberal | Leo Abbott | 19,876 | 46.30 | +7.46 | |
| Labor hold | Swing | -7.46 | |||
| Party | Candidate | Votes | % | ±% | |
|---|---|---|---|---|---|
| Country Liberal | Natasha Griggs | 23,627 | 46.37 | -0.43 | |
| Labor | Damian Hale | 18,384 | 36.08 | -5.82 | |
| Greens | Emma Young | 6,772 | 13.29 | +4.22 | |
| One Nation | John Kearney | 1,505 | 2.95 | +2.95 | |
| Citizens Electoral Council | Trudy Campbell | 668 | 1.31 | +0.83 | |
| Total formal votes | 50,956 | 94.94 | -2.13 | ||
| Informal votes | 2,716 | 5.06 | +2.13 | ||
| Turnout | 53,672 | 89.63 | -2.43 | ||
| Two-party-preferred result | |||||
| Country Liberal | Natasha Griggs | 26,371 | 51.75 | +1.94 | |
| Labor | Damian Hale | 24,585 | 48.25 | -1.94 | |
| Country Liberal gain from Labor | Swing | +1.94 | |||

The Australian Electoral Commission (AEC) is the independent federal agency responsible for the management of federal Australian elections, by-elections and referendums.

In Australia, electoral districts for the Australian House of Representatives are called divisions or more commonly referred to as electorates or seats. There are currently 151 single-member electorates for the Australian House of Representatives.

The 1963 Australian federal election was held in Australia on 30 November 1963. All 122 seats in the House of Representatives were up for election. The incumbent Liberal–Country coalition government, led by Prime Minister Sir Robert Menzies, won an increased majority over the opposition Labor Party, led by Arthur Calwell. This was the only time that a Federal Government won a seventh consecutive term in office.
In Australia, a redistribution is the process of redrawing the boundaries of electoral divisions for the House of Representatives arising from changes in population and changes in the number of representatives. There is no redistribution for the Senate as each State constitutes a division, though with multiple members. The Australian Electoral Commission (AEC), an independent statutory authority, oversees the apportionment and redistribution process for federal divisions, taking into account a number of factors. Politicians, political parties and the public may make submissions to the AEC on proposed new boundaries, but any interference with their deliberations is considered a serious offence.

The 1958 Australian federal election was held in Australia on 22 November 1958. All 122 seats in the House of Representatives and 32 of the 60 seats in the Senate were up for election. The incumbent Liberal–Country coalition led by Prime Minister Robert Menzies defeated the opposition Labor Party, led by H. V. Evatt.

The 1955 Australian federal election was held in Australia on 10 December 1955. All 122 seats in the House of Representatives and 30 of the 60 seats in the Senate were up for election. An early election was called to bring the House and Senate elections back in line; the previous election in 1954 had been House-only. The incumbent Liberal–Country coalition led by Prime Minister Robert Menzies increased its majority over the opposition Labor Party, led by H. V. Evatt.

The 1954 Australian federal election were held in Australia on 29 May 1954. All 121 seats in the House of Representatives were up for election, but no Senate election took place. The incumbent Liberal–Country coalition led by Prime Minister Robert Menzies defeated the opposition Labor Party led by H. V. Evatt, despite losing the two-party preferred vote. Although the ALP won the two-party preferred vote, six Coalition seats were uncontested compared to one ALP seat. The Psephos blog makes clear that if all seats had been contested, the Coalition would have recorded a higher primary vote than the ALP and possibly also a higher two-party preferred vote.

The 1951 Australian federal election was held in Australia on 28 April 1951. All 121 seats in the House of Representatives and all 60 seats in the Senate were up for election, due to a double dissolution called after the Senate rejected the Commonwealth Bank Bill. The incumbent Liberal–Country coalition led by Prime Minister Robert Menzies defeated the opposition Labor Party led by Ben Chifley with a modestly reduced majority, and secured a majority in the Senate. This was the last time the Labor party ever held a Senate majority. Chifley died just over a month after the election.

The 1949 Australian federal elections was held on Saturday December 10, All 121 seats in the House of Representatives and 42 of the 60 seats in the Senate were up for election. The incumbent Labor Party, led by Prime Minister Ben Chifley, was defeated by the opposition Liberal–Country coalition under Robert Menzies in a landslide. Menzies became prime minister for a second time, his first period having ended in 1941. This election marked the end of the 8-year Curtin-Chifley Labor government that had been in power since 1941 and started the 23-year Liberal/Country Coalition government. This was the first time the Liberal party won government at the federal level.

The 2010 Australian federal election was held on Saturday, 21 August 2010 to elect members of the 43rd Parliament of Australia. The incumbent centre-left Australian Labor Party led by Prime Minister Julia Gillard won a second term against the opposition centre-right Liberal Party of Australia led by Opposition Leader Tony Abbott and Coalition partner the National Party of Australia, led by Warren Truss, after Labor formed a minority government with the support of three independent MPs and one Australian Greens MP.
Patricia May Petersen is an Australian academic from Ipswich, Queensland.
This is a list of electoral results for the Division of Canberra in Australian federal elections from the division's creation in 1974 until the present.

This is a list of electoral division results for the Australian 2010 federal election in the state of New South Wales.

This is a list of electoral division results for the Australian 2010 federal election in the state of Tasmania.

This is a list of electoral division results for the Australian 2010 federal election in the state of Victoria.

This is a list of electoral division results for the Australian 2010 federal election in the state of Queensland.

This is a list of electoral division results for the 2010 Australian federal election for the state of Western Australia.

This is a list of electoral division results for the 2010 Australian federal election for the state of South Australia.

The following tables show state-by-state results in the Australian Senate at the 2013 Australian federal election.

These are the results for the Australian Senate at the 2019 Australian federal election.