Results of the 2010 Australian federal election (House of Representatives)

Last updated

Australian House of Representatives elections, 2010
Flag of Australia (converted).svg
  2007 21 August 2010 (2010-08-21) 2013  

All 150 seats in the Australian House of Representatives
76 seats needed for a majority
Turnout93.2%
PartyLeader%Seats+/–
Labor Julia Gillard 38.0%72-11
Liberal Tony Abbott 30.4%44-11
Liberal National John-Paul Langbroek 9.1%21New
National Warren Truss 3.4%6-4
Greens Bob Brown 11.8%1+1
National (WA) Brendon Grylls 0.3%1+1
Country Liberal Terry Mills 0.3%1+1
Independents 3.0%4+2
This lists parties that won seats. See the complete results below.
Prime Minister beforePrime Minister after
Julia Gillard 2010.jpg Julia Gillard
Labor
Julia Gillard
Labor
Julia Gillard 2010.jpg

The following tables show state-by-state results in the Australian House of Representatives at the 2010 federal election, Labor 72, Coalition 72, Nationals (WA) 1, Australian Greens 1, with 4 independents. [1] [2] [3] [4]

Contents

Australia

House of Representatives (IRV) — Turnout 93.21% (CV) — Informal 5.55%
2010 Australian House.svg
PartyVotes%SwingSeatsChange
  Liberal 3,777,38330.46+0.7644Decrease2.svg 1
  Liberal National Party (QLD) [lower-alpha 1] 1,130,5259.12+0.6021Increase2.svg 8
  National 419,2863.43−0.046Decrease2.svg 1
  Country Liberal (NT) 38,3350.31−0.011Increase2.svg 1
Coalition 5,365,52943.32+1.3172Increase2.svg 7
  Australian Labor Party 4,711,36337.99−5.4072Decrease2.svg 11
  Australian Greens 1,458,99811.76+3.971Increase2.svg 1
  Independents 312,4962.52+0.304 [lower-alpha 2] Increase2.svg 2
  National (WA) [lower-alpha 3] 43,1010.34+0.201Increase2.svg 1
Total12,402,363  150
Two-party-preferred vote
  Australian Labor Party 6,216,44550.12−2.5872Decrease2.svg 11
  Liberal/National Coalition 6,185,91849.88+2.5872Increase2.svg 7
Invalid/blank votes729,3045.55+1.60
Registered voters/turnout14,086,86993.22
Source: Commonwealth Election 2010
Preference flows

New South Wales

Electoral divisions: New South Wales NSWstate2010.gif
Electoral divisions: New South Wales
Electoral divisions: Sydney area NSWmetro2010.gif
Electoral divisions: Sydney area
Turnout 93.32% (CV) — Informal 6.83%
PartyVotes%SwingSeatsChange
   Liberal 1,470,14636.67+4.0416Increase2.svg 1
  National 317,8677.93+0.024Decrease2.svg 1
Coalition 1,788,01344.60+4.0620Steady2.svg
  Australian Labor Party 1,494,49037.28−6.8626Decrease2.svg 2
  Australian Greens 410,40510.24+2.35
  Independents 172,9214.31+1.002 [lower-alpha 2] Increase2.svg 1
  Christian Democratic Party 54,5441.36−0.56
  One Nation 19,1820.48+0.27
  Family First Party 17,4530.44−0.43
  Australian Democrats 11,4090.28+0.01
  Socialist Equality Party 9,1060.23+0.15
  Liberal Democratic Party 8,9280.22+0.10
  Secular Party of Australia 3,5290.09+0.09
  Socialist Alliance 3,4840.09+0.03
  Australia First Party 3,3750.08+0.08
  Australian Sex Party 3,1800.08+0.08
  Non-Custodial Parents Party 2,8350.07+0.05
  Building Australia Party 1,4970.04+0.04
  Carers Alliance 1,4580.04+0.04
  Citizens Electoral Council 1,1870.03−0.19
  Communist Alliance 6560.02+0.02
  The Climate Sceptics 2750.01+0.01
 Others1,3910.03+0.01
Total4,009,318  48Decrease2.svg 1 [lower-alpha 4]
Two-party-preferred vote
  Australian Labor Party 1,958,07748.84–4.8426Decrease2.svg 2
  Liberal/National Coalition 2,051,24151.16+4.8420Steady2.svg
Invalid/blank votes293,7636.83+1.88
Registered voters/turnout4,610,79593.33
Source: Commonwealth Election 2010

Victoria

Electoral divisions: Victoria Vicstate2010.gif
Electoral divisions: Victoria
Electoral divisions: Melbourne area Vicmetro2010.gif
Electoral divisions: Melbourne area
Turnout 93.46% (CV) — Informal 4.50%
PartyVotes%SwingSeatsChange
  Australian Labor Party 1,361,41642.81–1.8822Increase2.svg 1
   Liberal 1,159,30136.45–1.6412Decrease2.svg 2
  National 101,4193.19+0.172Steady2.svg
Coalition 1,260,72039.64–1.4714Decrease2.svg 2
  Australian Greens 402,48212.66+4.491Increase2.svg 1
  Family First Party 99,7473.14+0.12
  Independents 26,5250.83−0.17
  Liberal Democratic Party 7,8390.25+0.15
  Australian Sex Party 6,0230.19+0.19
  Secular Party of Australia 5,2390.16+0.16
  Australian Democrats 3,9470.12−1.10
  Socialist Alliance 2,2250.07+0.00
  Socialist Equality Party 1,6560.05+0.03
  Citizens Electoral Council 9220.03−0.24
  Christian Democratic Party 6320.02−0.02
  Australia First Party 2950.01+0.01
 Others5160.02+0.00
Total3,180,184  37
Two-party-preferred vote
  Australian Labor Party 1,758,98255.31+1.0422Increase2.svg 1
  Liberal/National Coalition 1,421,20244.69–1.0414Decrease2.svg 2
Invalid/blank votes149,6994.50+1.25
Registered voters/turnout3,561,87393.49
Source: Commonwealth Election 2010

Queensland

Electoral divisions: Queensland Qldstate2010.gif
Electoral divisions: Queensland
Electoral divisions: Brisbane area Qldmetro2010.gif
Electoral divisions: Brisbane area
Turnout 92.71% (CV) — Informal 5.45%
PartyVotes%SwingSeatsChange
  Liberal National Party 1,130,52547.42+2.9521Increase2.svg 8
  Australian Labor Party 800,71233.58–9.338Decrease2.svg 7
  Australian Greens 260,47110.92+5.29
  Family First Party 92,7943.89+1.62
  Independents 83,3103.49+0.501 [lower-alpha 2] Steady2.svg
  Liberal Democratic Party 4,6620.20+0.05
  Democratic Labor Party 4,5900.19+0.19
  One Nation 3,9210.16−0.20
  Citizens Electoral Council 1,4620.06−0.09
  Socialist Alliance 7170.03−0.02
  Secular Party of Australia 4140.02+0.02
 Others6010.03+0.03
Total2,384,179  30Increase2.svg1 [lower-alpha 5]
Two-party-preferred vote
  Liberal National Party 1,314,67555.14+5.5821Increase2.svg 8
  Australian Labor Party 1,069,50444.86–5.588Decrease2.svg 7
Invalid/blank votes137,3955.45+1.89
Registered voters/turnout2,719,36092.73
Source: Commonwealth Election 2010

Western Australia

Electoral divisions: Western Australia WAstate2010.gif
Electoral divisions: Western Australia
Turnout 92.86% (CV) — Informal 4.82%
PartyVotes%SwingSeatsChange
  Liberal 566,14547.02+0.7111Steady2.svg
  Labor 375,38131.18–5.623Decrease2.svg 1
  Greens 158,11713.13+4.20
  National [lower-alpha 3] 43,1013.58+2.441Increase2.svg 1
  Christian Democrats 27,8332.31+0.20
  Family First 20,6981.72+0.51
  Independents 5,0790.42–1.27
  Sex Party 2,0600.17+0.17
  One Nation 1,4710.12−1.03
  Socialist Alliance 1,2800.11+0.01
  Citizens Electoral Council 1,2770.11−0.15
  Democratic Labour 6220.05+0.05
  Climate Sceptics 5390.04+0.04
  Socialist Equality 3980.03+0.02
Total1,204,001  15
Two-party-preferred vote
  Liberal 679,14056.41+3.1511Steady2.svg
  Labor 524,86143.59–3.153Decrease2.svg 1
Invalid/blank votes60,9674.82+0.97
Registered voters/turnout1,362,53492.84
Source: Commonwealth Election 2010

South Australia

Electoral divisions: South Australia SAstate2010.gif
Electoral divisions: South Australia
Turnout 93.80% (CV) — Informal 5.46%
PartyVotes%SwingSeatsChange
  Australian Labor Party 399,27940.74–2.446Steady2.svg
  Liberal 394,00340.21–1.555Steady2.svg
  Australian Greens 117,36411.98+5.03
  Family First Party 48,6384.96+0.91
  Australian Democrats 7,0200.72−0.79
  Independents 5,0860.52–0.18
  The Climate Sceptics 3,5250.36+0.36
  Liberal Democratic Party 2,8330.29+0.12
  One Nation 1,1050.11−0.06
  Socialist Alliance 7860.08+0.08
  Secular Party of Australia 3100.03+0.03
Total979,949  11
Two-party-preferred vote
  Australian Labor Party 521,11553.18+0.786Steady2.svg
  Liberal 458,83446.82–0.785Steady2.svg
Invalid/blank votes56,5655.46+1.68
Registered voters/turnout1,104,69893.83
Source: Commonwealth Election 2010

Tasmania

Electoral divisions: Tasmania Tasstate2010.gif
Electoral divisions: Tasmania
Turnout 95.08% (CV) — Informal 4.04%
PartyVotes%SwingSeatsChange
  Australian Labor Party 143,79643.95+1.184Decrease2.svg 1
  Liberal 109,90833.60–4.620Steady2.svg
  Australian Greens 55,04216.82+3.32
  Independents 15,6274.78+2.561 [lower-alpha 2] Increase2.svg 1
  Secular Party of Australia 1,0850.33+0.33
  Socialist Alliance 8560.26+0.00
  Citizens Electoral Council 8380.26−0.31
Total327,152  5
Two-party-preferred vote
  Australian Labor Party 198,33260.62+4.414Decrease2.svg 1
  Liberal 128,83039.38–4.410Steady2.svg
Invalid/blank votes13,7914.04+1.12
Registered voters/turnout358,60995.07
Source: Commonwealth Election 2010

Territories

Electoral divisions: Territories Territories2010.gif
Electoral divisions: Territories

Australian Capital Territory

House of Representatives (IRV) — Turnout 94.74% (CV) — Informal 4.66%
PartyVotes%SwingSeatsChange
  Australian Labor Party 100,70045.02–6.082Steady2.svg
  Liberal 77,88034.81+1.580Steady2.svg
  Australian Greens 42,94219.20+6.04
  Secular Party of Australia 2,1750.97+0.97
Total223,697  2
Two-party-preferred vote
  Australian Labor Party 137,94861.67–1.732Steady2.svg
  Liberal 85,74938.33+1.730Steady2.svg
Invalid/blank votes10,9264.66+2.35
Registered voters/turnout247,94194.63
Source: Commonwealth Election 2010

Northern Territory

House of Representatives (IRV) — Turnout 82.71% (CV) — Informal 6.19%
PartyVotes%SwingSeatsChange
  Country Liberal Party 38,33540.83–0.201Increase2.svg 1
  Australian Labor Party 35,58937.91–9.741Decrease2.svg 1
  Australian Greens 12,17512.97+4.92
  Independents 3,9484.21+1.55
  Citizens Electoral Council 2,3312.48+2.23
  One Nation 1,5051.60+1.60
Total93,883  2
Two-party-preferred vote
  Australian Labor Party 47,63650.74–4.671Decrease2.svg 1
  Country Liberal Party 46,24749.26+4.671Increase2.svg 1
Invalid/blank votes6,1986.19+2.34
Registered voters/turnout121,05982.67
Source: Commonwealth Election 2010

See also

Notes

  1. The Liberal National Party was an amalgamation of the Liberal Party and National Party in Queensland. Change is compared to the coalition total in 2007.
  2. 1 2 3 4 The independents were Bob Katter (Kennedy, Qld), Rob Oakeshott (Lyne, NSW), Andrew Wilkie (Denison, Tas) and Tony Windsor (New England, NSW).
  3. 1 2 The National Party of Western Australia prior to and subsequent to the election were not in the federal Coalition agreement. Nationals WA MP Tony Crook stated that he was a crossbencher, and has said: "In every news report and press report we see, my number is being allocated in with the Coalition and it shouldn't be". [6] Thus, the party has been counted separately from the Coalition totals.
  4. The abolished district was Lowe (Labor).
  5. The new seat was Wright.

Related Research Articles

<span class="mw-page-title-main">2001 Australian federal election</span> Election for the 40th Parliament of Australia

The 2001 Australian federal election was held in Australia on 10 November 2001. All 150 seats in the House of Representatives and 40 seats in the 76-member Senate were up for election. The incumbent Liberal Party of Australia led by Prime Minister of Australia John Howard and coalition partner the National Party of Australia led by John Anderson defeated the opposition Australian Labor Party led by Kim Beazley.

<span class="mw-page-title-main">1998 Australian federal election</span> Election for the 39th Parliament of Australia

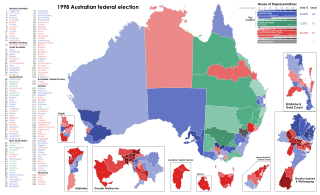
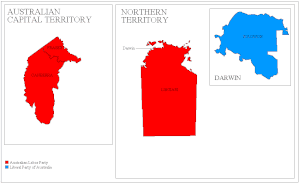
The 1998 Australian federal election was held to determine the members of the 39th Parliament of Australia. It was held on 3 October 1998. All 148 seats of the House of Representatives and 40 seats of the 76-seat Senate were up for election. The incumbent centre-right Liberal/National Coalition government led by Prime Minister John Howard of the Liberal Party and coalition partner Tim Fischer of the National Party defeated the centre-left Australian Labor Party opposition led by Opposition Leader Kim Beazley, despite losing the nationwide popular and two-party preferred vote.

<span class="mw-page-title-main">2004 Australian federal election</span> Election for the 41st Parliament of Australia

The 2004 Australian federal election was held in Australia on 9 October 2004. All 150 seats in the House of Representatives and 40 seats in the 76-member Senate were up for election. The incumbent Liberal Party of Australia led by Prime Minister of Australia John Howard and coalition partner the National Party of Australia led by John Anderson defeated the opposition Australian Labor Party led by Mark Latham.

<span class="mw-page-title-main">1996 Australian federal election</span> Election

The 1996 Australian federal election was held to determine the members of the 38th Parliament of Australia. It was held on 2 March 1996. All 148 seats of the House of Representatives and 40 seats of the 76-seat Senate were up for election. The centre-right Liberal/National Coalition led by Opposition Leader John Howard of the Liberal Party and coalition partner Tim Fischer of the National Party defeated the incumbent centre-left Australian Labor Party government led by Prime Minister Paul Keating in a landslide victory. The Coalition won 94 seats in the House of Representatives, which is the largest number of seats held by a federal government to date.

<span class="mw-page-title-main">1990 Australian federal election</span> Election

The 1990 Australian federal election was held in Australia on 24 March 1990. All 148 seats in the House of Representatives and 40 seats in the 76-member Senate were up for election. The incumbent Australian Labor Party led by Bob Hawke defeated the opposition Liberal Party of Australia led by Andrew Peacock with coalition partner the National Party of Australia led by Charles Blunt despite losing the nationwide popular and two-party-preferred vote. The election saw the reelection of a Hawke government, the fourth successive term.

<span class="mw-page-title-main">1987 Australian federal election</span> Australian election

The 1987 Australian federal election was held in Australia on 11 July 1987, following the granting of a double dissolution on 5 June by the Governor-General Sir Ninian Stephen. Consequently, all 148 seats in the House of Representatives as well as all 76 seats in the Senate were up for election. The incumbent Australian Labor Party, led by Prime Minister Bob Hawke, defeated the opposition Liberal Party of Australia, led by John Howard and the National Party of Australia led by Ian Sinclair. This was the first, and to date only, time the Labor Party won a third consecutive election.

<span class="mw-page-title-main">Two-party-preferred vote</span> Result of election after distribution of preferences

In Australian politics, the two-party-preferred vote is the result of an election or opinion poll after preferences have been distributed to the highest two candidates, who in some cases can be independents. For the purposes of TPP, the Liberal/National Coalition is usually considered a single party, with Labor being the other major party. Typically the TPP is expressed as the percentages of votes attracted by each of the two major parties, e.g. "Coalition 50%, Labor 50%", where the values include both primary votes and preferences. The TPP is an indicator of how much swing has been attained/is required to change the result, taking into consideration preferences, which may have a significant effect on the result.

The Climate Change Coalition (CCC), briefly known as 4Change, was an Australian political party, which was formed in 2007 with a view to accelerate action by politicians from all parties on global warming and climate change. Its position on working towards addressing climate change stressed cooperation with big business in order to achieve significant progress on the issue. The party therefore advocated a close working relationship between environmentalists and the business community. The CCC was registered as a political party with the Australian Electoral Commission (AEC) on 4 September 2007 and deregistered on 25 March 2010.

<span class="mw-page-title-main">2010 Australian federal election</span> Election for the 43rd Parliament of Australia

The 2010 Australian federal election was held on Saturday, 21 August 2010 to elect members of the 43rd Parliament of Australia. The incumbent centre-left Australian Labor Party led by Prime Minister Julia Gillard won a second term against the opposition centre-right Liberal Party of Australia led by Opposition Leader Tony Abbott and Coalition partner the National Party of Australia, led by Warren Truss, after Labor formed a minority government with the support of three independent MPs and one Australian Greens MP.

The following tables show state-by-state results in the Australian House of Representatives at the 2007 federal election, 83 Labor, 65 coalition, 2 independent. Detailed results for all 150 seats are also available. The Nationals were reduced to nine seats and the coalition to 64 when independent Rob Oakeshott won the 2008 Lyne by-election.

<span class="mw-page-title-main">2007 Australian Senate election</span> Australian federal election results

The following tables show state-by-state results in the Australian Senate at the 2007 federal election, 37 Coalition, 32 Labor, five Green, one Family First, and one independent, Nick Xenophon. Senators are elected for six-year terms, and took their seats from 1 July 2008, but senators representing the territories have three-year terms and take their seats immediately.

<span class="mw-page-title-main">How-to-vote card</span>

How-to-vote cards (HTV) are small leaflets that are handed out by party supporters during elections in Australia. Voting in the Australian lower house uses a preferential voting system. Voters must rank every candidate on the ballot in order for their vote to count. There are often numerous candidates on the ballot, some with little public profile, so voters may find it difficult to decide on all of them. Parties produce how-to-vote cards ostensibly to help voters. They contain details about the candidate or party as well as instruction how to cast a ranked vote in the order that the party would prefer the voter follow. The flow of preferences can assist the party dispersing the cards directly and indirectly help allied parties.

<span class="mw-page-title-main">2011 New South Wales state election</span>

Elections to the 55th Parliament of New South Wales were held on Saturday, 26 March 2011. The 16-year-incumbent Labor Party government led by Premier Kristina Keneally was defeated in a landslide by the Liberal–National Coalition opposition led by Barry O'Farrell.

<span class="mw-page-title-main">2013 Australian federal election</span> Election for the 44th Parliament of Australia

The 2013 Australian federal election to elect the members of the 44th Parliament of Australia took place on 7 September 2013. The centre-right Liberal/National Coalition opposition led by Opposition leader Tony Abbott of the Liberal Party of Australia and Coalition partner the National Party of Australia, led by Warren Truss, defeated the incumbent centre-left Labor Party government of Prime Minister Kevin Rudd in a landslide. Labor had been in government for six years since being elected in the 2007 election. This election marked the end of the Rudd-Gillard-Rudd Labor government and the start of the 9 year long Abbott-Turnbull-Morrison Liberal-National Coalition government. Abbott was sworn in by the Governor-General, Quentin Bryce, as Australia's new Prime Minister on 18 September 2013, along with the Abbott Ministry. The 44th Parliament of Australia opened on 12 November 2013, with the members of the House of Representatives and territory senators sworn in. The state senators were sworn in by the next Governor-General Peter Cosgrove on 7 July 2014, with their six-year terms commencing on 1 July.

<span class="mw-page-title-main">2010 Australian Senate election</span> Australian federal election results

The following tables show state-by-state results in the Australian Senate at the 2010 federal election. Senators total 34 Coalition, 31 Labor, nine Green, one Democratic Labor Party, and one independent, Nick Xenophon. New Senators took their places from 1 July 2011.

The following tables show state-by-state results in the Australian House of Representatives at the 2013 federal election, Coalition 90, Labor 55, Australian Greens 1, Palmer United Party 1, Katter's Australian Party 1, with 2 independents.

<span class="mw-page-title-main">2013 Australian Senate election</span> Australian federal election results

The following tables show state-by-state results in the Australian Senate at the 2013 Australian federal election.

<span class="mw-page-title-main">2015 Canning by-election</span>

The 2015 Canning by-election was held for the Australian House of Representatives on Saturday 19 September from 8 am to 6 pm WST. The by-election in the seat of Canning was triggered by the death of sitting Liberal MP Don Randall on 21 July 2015.

<span class="mw-page-title-main">2022 Australian federal election</span> Election for the 47th Parliament of Australia

The 2022 Australian federal election was held on Saturday 21 May 2022 to elect members of the 47th Parliament of Australia. The incumbent Liberal/National Coalition government, led by Prime Minister Scott Morrison, sought to win a fourth consecutive term in office but was defeated by the opposition Labor Party, led by Anthony Albanese. Up for election were all 151 seats in the lower house, the House of Representatives, and 40 of the 76 seats in the upper house, the Senate.

The number of seats won by each party in the Australian House of Representatives at the 2022 federal election were: Coalition 58, Labor 77, Australian Greens 4, Centre Alliance 1, Katter's Australian Party 1, and Independents 10.

References

  1. State by state breakdowns: AEC
  2. State by state primary vote: AEC Archived 2010-08-23 at the Wayback Machine
  3. State by state 2PP: AEC Archived 2010-09-23 at the Wayback Machine
  4. Barber, Stephen (15 August 2011). "Commonwealth Election 2010" (PDF). Research Paper 2 2011–12. Parliamentary Library. ISSN   1834-9854.
  5. 2010 nationwide 2PP preference flows and 2007 flows: AEC
  6. Ker, Peter (26 August 2010). "Don't count me among Coalition, says Nat". The Age . Fairfax Media . Retrieved 27 August 2010.