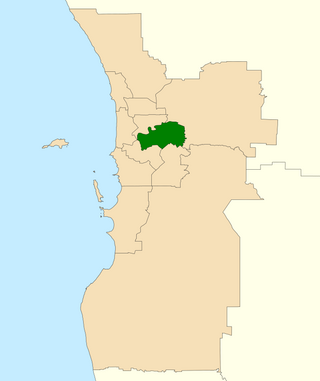
This is a list of electoral results for the Division of Swan in Australian federal elections from the division's creation in 1901 until the present.
Member | Party | Term | |
---|---|---|---|
Sir John Forrest | Protectionist | 1901–1906 | |
Western Australian | 1906–1909 | ||
Liberal | 1909–1917 | ||
Nationalist | 1917–1918 | ||
Edwin Corboy | Labor | 1918 by–1919 | |
John Prowse | Farmers and Settlers Association/Country | 1919–1922 | |
Henry Gregory | Country | 1922–1940 | |
Thomas Marwick | 1940 by–1943 | ||
Don Mountjoy | Labor | 1943–1946 | |
Len Hamilton | Country | 1946–1949 | |
Bill Grayden | Liberal | 1949–1954 | |
Harry Webb | Labor | 1954–1955 | |
Richard Cleaver | Liberal | 1955–1969 | |
Adrian Bennett | Labor | 1969–1975 | |
John Martyr | Liberal | 1975–1980 | |
Kim Beazley | Labor | 1980–1996 | |
Don Randall | Liberal | 1996–1998 | |
Kim Wilkie | Labor | 1998–2007 | |
Steve Irons | Liberal | 2007–2022 | |
Zaneta Mascarenhas | Labor | 2022–present |
Party | Candidate | Votes | % | ±% | |
---|---|---|---|---|---|
Labor | Zaneta Mascarenhas | 39,082 | 39.07 | +6.17 | |
Liberal | Kristy McSweeney | 32,096 | 32.08 | −12.65 | |
Greens | Clint Uink | 14,861 | 14.86 | +2.86 | |
United Australia | Paul Hilton | 2,637 | 2.64 | +0.81 | |
One Nation | Peter Hallifax | 2,544 | 2.54 | −0.33 | |
Animal Justice | Timothy Green | 2,214 | 2.21 | +0.89 | |
Western Australia | Rod Bradley | 2,059 | 2.06 | +0.70 | |
Christians | Dena Gower | 1,930 | 1.93 | +0.20 | |
Liberal Democrats | Matthew Thompson | 1,821 | 1.82 | +1.82 | |
Australian Federation | Carl Pallier | 792 | 0.79 | +0.79 | |
Total formal votes | 100,036 | 94.75 | +0.59 | ||
Informal votes | 5,545 | 5.25 | −0.59 | ||
Turnout | 105,581 | 87.12 | −1.73 | ||
Two-party-preferred result | |||||
Labor | Zaneta Mascarenhas | 58,796 | 58.77 | +11.99 | |
Liberal | Kristy McSweeney | 41,240 | 41.23 | −11.99 | |
Labor gain from Liberal | Swing | +11.99 |
Party | Candidate | Votes | % | ±% | |
---|---|---|---|---|---|
Liberal | Steve Irons | 37,591 | 44.68 | −3.50 | |
Labor | Hannah Beazley | 27,953 | 33.22 | +0.21 | |
Greens | Liberty Cramer | 10,372 | 12.33 | −2.69 | |
One Nation | Tshung-Hui Chang | 2,038 | 2.42 | +2.42 | |
United Australia | Peter McLernon | 1,483 | 1.76 | +1.76 | |
Christians | Steve Klomp | 1,450 | 1.72 | −2.07 | |
Animal Justice | Virginia Thomas-Wurth | 1,302 | 1.55 | +1.55 | |
Western Australia | Sharron Hawkins Zeeb | 1,102 | 1.31 | +1.31 | |
Conservative National | Carmel Addink | 601 | 0.71 | +0.71 | |
Australia First | Michael Chehoff | 251 | 0.30 | +0.30 | |
Total formal votes | 84,143 | 94.19 | −2.18 | ||
Informal votes | 5,190 | 5.81 | +2.18 | ||
Turnout | 89,333 | 88.64 | +1.80 | ||
Two-party-preferred result | |||||
Liberal | Steve Irons | 44,357 | 52.72 | −0.87 | |
Labor | Hannah Beazley | 39,786 | 47.28 | +0.87 | |
Liberal hold | Swing | −0.87 |
Party | Candidate | Votes | % | ±% | |
---|---|---|---|---|---|
Liberal | Steve Irons | 39,220 | 48.18 | −1.43 | |
Labor | Tammy Solonec | 26,869 | 33.01 | +2.97 | |
Greens | Sarah Nielsen-Harvey | 12,227 | 15.02 | +3.79 | |
Christians | Steve Klomp | 3,086 | 3.79 | +2.06 | |
Total formal votes | 81,402 | 96.37 | +1.96 | ||
Informal votes | 3,062 | 3.63 | −1.96 | ||
Turnout | 84,464 | 86.84 | −3.55 | ||
Two-party-preferred result | |||||
Liberal | Steve Irons | 43,625 | 53.59 | −3.75 | |
Labor | Tammy Solonec | 37,777 | 46.41 | +3.75 | |
Liberal hold | Swing | −3.75 |
Party | Candidate | Votes | % | ±% | |
---|---|---|---|---|---|
Liberal | Steve Irons | 39,972 | 48.86 | +2.35 | |
Labor | John Bissett | 25,037 | 30.60 | −4.68 | |
Greens | Gerard Siero | 9,446 | 11.55 | −0.26 | |
Palmer United | Kenneth Duncan | 3,463 | 4.23 | +4.23 | |
Christians | Steve Klomp | 1,465 | 1.79 | +1.79 | |
Family First | Moyna Rapp | 797 | 0.97 | −0.26 | |
Protectionist | Troy Ellis | 718 | 0.88 | +0.88 | |
Rise Up Australia | Paul Davies | 488 | 0.60 | +0.60 | |
Katter's Australian | Noel Avery | 421 | 0.51 | +0.51 | |
Total formal votes | 81,807 | 94.37 | −0.73 | ||
Informal votes | 4,879 | 5.63 | +0.73 | ||
Turnout | 86,686 | 90.97 | −1.00 | ||
Two-party-preferred result | |||||
Liberal | Steve Irons | 46,246 | 56.53 | +4.00 | |
Labor | John Bissett | 35,561 | 43.47 | −4.00 | |
Liberal hold | Swing | +4.00 |
Party | Candidate | Votes | % | ±% | |
---|---|---|---|---|---|
Liberal | Steve Irons | 36,951 | 46.51 | +2.76 | |
Labor | Tim Hammond | 28,023 | 35.28 | −5.69 | |
Greens | Rebecca Leighton | 9,380 | 11.81 | +1.69 | |
Sex Party | Bret Treasure | 2,060 | 2.59 | +2.59 | |
Christian Democrats | Steve Klomp | 1,646 | 2.07 | +0.30 | |
Family First | Barry Drennan | 981 | 1.23 | +0.38 | |
Socialist Equality | Joe Lopez | 398 | 0.50 | +0.30 | |
Total formal votes | 79,439 | 95.10 | −0.36 | ||
Informal votes | 4,089 | 4.90 | +0.36 | ||
Turnout | 83,528 | 92.03 | −0.97 | ||
Two-party-preferred result | |||||
Liberal | Steve Irons | 41,729 | 52.53 | +2.80 | |
Labor | Tim Hammond | 37,710 | 47.47 | −2.80 | |
Liberal notional gain from Labor | Swing | +2.80 |
Party | Candidate | Votes | % | ±% | |
---|---|---|---|---|---|
Liberal | Steve Irons | 32,183 | 44.28 | +0.14 | |
Labor | Kim Wilkie | 29,544 | 40.65 | +0.73 | |
Greens | Kim Lisson | 7,365 | 10.13 | +1.84 | |
Christian Democrats | Tasman Gilbert | 1,210 | 1.66 | −0.09 | |
Independent | Linda Ross | 656 | 0.90 | +0.90 | |
One Nation | Joy Harris | 647 | 0.89 | −0.89 | |
Family First | Damon Fowler | 579 | 0.80 | −0.04 | |
Liberty & Democracy | Mark Dixon | 243 | 0.33 | +0.33 | |
Socialist Equality | Joe Lopez | 157 | 0.22 | +0.22 | |
Citizens Electoral Council | Norman Gay | 92 | 0.13 | −0.16 | |
Total formal votes | 72,676 | 95.41 | +0.87 | ||
Informal votes | 3,497 | 4.59 | −0.87 | ||
Turnout | 76,173 | 93.22 | +1.04 | ||
Two-party-preferred result | |||||
Liberal | Steve Irons | 36,420 | 50.11 | +0.19 | |
Labor | Kim Wilkie | 36,256 | 49.89 | −0.19 | |
Liberal gain from Labor | Swing | +0.19 | |||
Party | Candidate | Votes | % | ±% | |
---|---|---|---|---|---|
Liberal | Andrew Murfin | 30,598 | 44.14 | +5.16 | |
Labor | Kim Wilkie | 27,675 | 39.92 | −1.35 | |
Greens | Dave Fort | 5,745 | 8.29 | +2.41 | |
One Nation | Ted Vermeer | 1,232 | 1.78 | −2.87 | |
Christian Democrats | Gwen Hamence | 1,214 | 1.75 | +0.15 | |
Democrats | Mark Reynolds | 1,133 | 1.63 | −4.08 | |
Independent | Teresa van Lieshout | 947 | 1.37 | +1.37 | |
Family First | Peter Greaves | 582 | 0.84 | +0.84 | |
Citizens Electoral Council | Azmi Johari | 198 | 0.29 | −0.08 | |
Total formal votes | 69,324 | 94.54 | −0.59 | ||
Informal votes | 4,006 | 5.46 | +0.59 | ||
Turnout | 73,330 | 92.18 | −2.05 | ||
Two-party-preferred result | |||||
Labor | Kim Wilkie | 34,714 | 50.08 | −1.96 | |
Liberal | Andrew Murfin | 34,610 | 49.92 | +1.96 | |
Labor hold | Swing | -1.96 | |||
Party | Candidate | Votes | % | ±% | |
---|---|---|---|---|---|
Labor | Kim Wilkie | 29,220 | 41.27 | +1.13 | |
Liberal | Bev Brennan | 27,597 | 38.98 | −0.55 | |
Greens | Elena Jeffreys | 4,163 | 5.88 | +0.70 | |
Democrats | Paul McCutcheon | 4,043 | 5.71 | +0.85 | |
One Nation | Sandra Vinciullo | 3,292 | 4.65 | −3.26 | |
Christian Democrats | Colleen Tapley | 1,130 | 1.60 | +0.25 | |
Curtin Labor Alliance | Simon Makin | 1,096 | 1.55 | +1.55 | |
Citizens Electoral Council | Brian Smith | 262 | 0.37 | −0.41 | |
Total formal votes | 70,803 | 95.13 | −0.58 | ||
Informal votes | 3,628 | 4.87 | +0.58 | ||
Turnout | 74,431 | 94.78 | |||
Two-party-preferred result | |||||
Labor | Kim Wilkie | 36,844 | 52.04 | −0.71 | |
Liberal | Bev Brennan | 33,959 | 47.96 | +0.71 | |
Labor hold | Swing | -0.71 | |||
Party | Candidate | Votes | % | ±% | |
---|---|---|---|---|---|
Labor | Kim Wilkie | 30,481 | 40.09 | +3.10 | |
Liberal | Don Randall | 29,848 | 39.26 | −3.55 | |
One Nation | Richard Birchall | 6,278 | 8.26 | +8.26 | |
Greens | Juanita Miller | 3,892 | 5.12 | +0.27 | |
Democrats | Tim Fraser | 3,720 | 4.89 | −0.88 | |
Christian Democrats | Brett Crook | 1,018 | 1.34 | +1.34 | |
Citizens Electoral Council | Malcolm Talbot | 584 | 0.77 | +0.77 | |
Natural Law | Elspeth Clairs | 210 | 0.28 | −0.05 | |
Total formal votes | 76,031 | 95.71 | −0.68 | ||
Informal votes | 3,404 | 4.29 | +0.68 | ||
Turnout | 79,435 | 95.05 | +0.52 | ||
Two-party-preferred result | |||||
Labor | Kim Wilkie | 40,067 | 52.70 | +6.33 | |
Liberal | Don Randall | 35,964 | 47.30 | −6.33 | |
Labor gain from Liberal | Swing | +6.33 | |||
Party | Candidate | Votes | % | ±% | |
---|---|---|---|---|---|
Liberal | Don Randall | 27,974 | 42.34 | −2.87 | |
Labor | Jane Saunders | 24,349 | 36.86 | −7.15 | |
Independent | Bryan Hilbert | 6,274 | 9.50 | +9.50 | |
Democrats | Norm Kelly | 3,574 | 5.41 | +2.85 | |
Greens | Mingli Wanjurri-Nungala | 3,086 | 4.67 | −0.49 | |
Independent | John Tucak | 573 | 0.87 | +0.87 | |
Natural Law | Elspeth Clairs | 235 | 0.36 | −0.03 | |
Total formal votes | 66,065 | 96.45 | −0.60 | ||
Informal votes | 2,435 | 3.55 | +0.60 | ||
Turnout | 68,500 | 94.53 | −0.98 | ||
Two-party-preferred result | |||||
Liberal | Don Randall | 35,239 | 53.71 | +3.93 | |
Labor | Jane Saunders | 30,372 | 46.29 | −3.93 | |
Liberal gain from Labor | Swing | +3.93 | |||
Party | Candidate | Votes | % | ±% | |
---|---|---|---|---|---|
Liberal | Bryan Hilbert | 30,565 | 45.22 | +7.60 | |
Labor | Kim Beazley | 29,750 | 44.01 | +3.46 | |
Greens | Andrew Thomson | 3,492 | 5.17 | −2.10 | |
Democrats | Don Millar | 1,733 | 2.56 | −5.45 | |
Independent | Andrew Caminschi | 807 | 1.19 | +1.19 | |
Independent | Luke Garswood | 576 | 0.85 | +0.85 | |
Independent | Isobel Weir | 415 | 0.61 | +0.61 | |
Natural Law | Anne Leishman | 260 | 0.38 | +0.38 | |
Total formal votes | 67,598 | 97.05 | +1.40 | ||
Informal votes | 2,056 | 2.95 | −1.40 | ||
Turnout | 69,654 | 95.51 | |||
Two-party-preferred result | |||||
Labor | Kim Beazley | 33,917 | 50.22 | −2.13 | |
Liberal | Bryan Hilbert | 33,623 | 49.78 | +2.13 | |
Labor hold | Swing | -2.13 | |||
Party | Candidate | Votes | % | ±% | |
---|---|---|---|---|---|
Labor | Kim Beazley | 26,674 | 40.5 | −14.7 | |
Liberal | Peter Kirwan | 24,743 | 37.6 | +1.7 | |
Democrats | Alan Needham | 5,274 | 8.0 | +8.0 | |
Greens | Dee Margetts | 4,777 | 7.3 | +7.3 | |
Grey Power | Mike Hutton | 2,514 | 3.8 | +3.8 | |
Independent | Patrick Donovan | 753 | 1.1 | +1.1 | |
Democratic Socialist | Frank Noakes | 500 | 0.8 | +0.8 | |
Independent | Erica Gamble | 412 | 0.6 | +0.6 | |
Independent | Paul Auguston | 134 | 0.2 | +0.2 | |
Total formal votes | 65,781 | 95.6 | |||
Informal votes | 2,992 | 4.4 | |||
Turnout | 68,773 | 94.8 | |||
Two-party-preferred result | |||||
Labor | Kim Beazley | 34,351 | 52.4 | −6.2 | |
Liberal | Peter Kirwan | 31,265 | 47.6 | +6.2 | |
Labor hold | Swing | -6.2 | |||
Party | Candidate | Votes | % | ±% | |
---|---|---|---|---|---|
Labor | Kim Beazley | 32,201 | 54.6 | +0.4 | |
Liberal | Harry Klapp | 21,555 | 36.5 | −4.2 | |
National | Adelia Bernard | 2,750 | 4.7 | +4.7 | |
Independent | Georgina Motion | 2,518 | 4.3 | +4.3 | |
Total formal votes | 59,024 | 93.1 | |||
Informal votes | 4,348 | 6.9 | |||
Turnout | 63,372 | 92.7 | |||
Two-party-preferred result | |||||
Labor | Kim Beazley | 34,220 | 58.0 | +1.0 | |
Liberal | Harry Klapp | 24,804 | 42.0 | −1.0 | |
Labor hold | Swing | +1.0 | |||
Party | Candidate | Votes | % | ±% | |
---|---|---|---|---|---|
Labor | Kim Beazley | 32,376 | 54.2 | −4.4 | |
Liberal | Frank Hayes | 24,305 | 40.7 | +4.6 | |
Democrats | Linda Mottram | 3,077 | 5.1 | +0.8 | |
Total formal votes | 59,758 | 91.8 | |||
Informal votes | 5,352 | 8.2 | |||
Turnout | 65,110 | 93.2 | |||
Two-party-preferred result | |||||
Labor | Kim Beazley | 34,044 | 57.0 | −5.1 | |
Liberal | Frank Hayes | 25,714 | 43.0 | +5.1 | |
Labor hold | Swing | -5.1 | |||
Party | Candidate | Votes | % | ±% | |
---|---|---|---|---|---|
Labor | Kim Beazley | 38,908 | 62.7 | +9.4 | |
Liberal | Jeffrey Roberts | 19,825 | 32.0 | −8.1 | |
Democrats | Kevin Trent | 2,662 | 4.3 | −1.1 | |
Socialist Workers | Linda Mere | 621 | 1.0 | −0.2 | |
Total formal votes | 62,016 | 97.8 | |||
Informal votes | 1,391 | 2.2 | |||
Turnout | 63,407 | 92.9 | |||
Two-party-preferred result | |||||
Labor | Kim Beazley | 66.2 | +8.6 | ||
Liberal | Jeffrey Roberts | 33.8 | −8.6 | ||
Labor hold | Swing | +8.6 | |||
Party | Candidate | Votes | % | ±% | |
---|---|---|---|---|---|
Labor | Kim Beazley | 32,476 | 53.3 | +13.7 | |
Liberal | John Martyr | 24,401 | 40.1 | −2.8 | |
Democrats | Jean Ritter | 3,288 | 5.4 | −6.4 | |
Socialist Workers | Stephen Painter | 750 | 1.2 | +1.2 | |
Total formal votes | 60,915 | 97.1 | |||
Informal votes | 1,790 | 2.9 | |||
Turnout | 62,705 | 93.3 | |||
Two-party-preferred result | |||||
Labor | Kim Beazley | 57.6 | +8.1 | ||
Liberal | John Martyr | 42.4 | −8.1 | ||
Labor gain from Liberal | Swing | +8.1 | |||
Party | Candidate | Votes | % | ±% | |
---|---|---|---|---|---|
Liberal | John Martyr | 27,385 | 42.9 | −3.3 | |
Labor | Patricia Fowkes | 25,276 | 39.6 | −10.2 | |
Democrats | Hubert Lennerts | 7,526 | 11.8 | +11.8 | |
Independent | William Deller | 2,474 | 3.9 | +3.9 | |
Progress | Bryan Scott-Courtland | 1,194 | 1.9 | +1.9 | |
Total formal votes | 63,855 | 95.6 | |||
Informal votes | 2,936 | 4.4 | |||
Turnout | 66,791 | 95.1 | |||
Two-party-preferred result | |||||
Liberal | John Martyr | 32,267 | 50.5 | +1.0 | |
Labor | Patricia Fowkes | 31,588 | 49.5 | −1.0 | |
Liberal gain from Labor | Swing | +1.0 | |||
Party | Candidate | Votes | % | ±% | |
---|---|---|---|---|---|
Liberal | John Martyr | 30,914 | 48.8 | +9.9 | |
Labor | Adrian Bennett | 29,954 | 47.2 | −6.1 | |
National Country | Peter Masson | 2,533 | 4.0 | −2.6 | |
Total formal votes | 63,401 | 97.3 | |||
Informal votes | 1,748 | 2.7 | |||
Turnout | 65,149 | 94.3 | |||
Two-party-preferred result | |||||
Liberal | John Martyr | 33,029 | 52.1 | +7.7 | |
Labor | Adrian Bennett | 30,372 | 47.9 | −7.7 | |
Liberal gain from Labor | Swing | +7.7 | |||
Party | Candidate | Votes | % | ±% | |
---|---|---|---|---|---|
Labor | Adrian Bennett | 33,225 | 53.3 | +4.3 | |
Liberal | Geoffrey Hale | 24,251 | 38.9 | −4.8 | |
National Alliance | Pietro Bendotti | 4,087 | 6.6 | +2.8 | |
Australia | Archelaus Marshall | 814 | 1.3 | −0.6 | |
Total formal votes | 62,377 | 97.2 | |||
Informal votes | 1,816 | 2.8 | |||
Turnout | 64,193 | 94.4 | |||
Two-party-preferred result | |||||
Labor | Adrian Bennett | 55.6 | +3.9 | ||
Liberal | Geoffrey Hale | 44.4 | −3.9 | ||
Labor hold | Swing | +3.9 | |||
Party | Candidate | Votes | % | ±% | |
---|---|---|---|---|---|
Labor | Adrian Bennett | 28,347 | 49.5 | −2.7 | |
Liberal | Richard Cleaver | 24,724 | 43.2 | +1.7 | |
Democratic Labor | David Milne | 2,163 | 3.8 | −0.9 | |
Australia | Archelaus Marshall | 1,075 | 1.9 | +0.3 | |
Independent | David Smith | 921 | 1.6 | +1.6 | |
Total formal votes | 57,230 | 97.1 | |||
Informal votes | 1,699 | 2.9 | |||
Turnout | 58,929 | 93.8 | |||
Two-party-preferred result | |||||
Labor | Adrian Bennett | 52.2 | −1.9 | ||
Liberal | Richard Cleaver | 47.8 | +1.9 | ||
Labor hold | Swing | -1.9 | |||
Party | Candidate | Votes | % | ±% | |
---|---|---|---|---|---|
Labor | Adrian Bennett | 28,960 | 52.2 | +7.8 | |
Liberal | Richard Cleaver | 22,982 | 41.5 | −6.3 | |
Democratic Labor | Alan Crofts | 2,608 | 4.7 | −3.1 | |
Australia | Arthur Williams | 879 | 1.6 | +1.6 | |
Total formal votes | 55,429 | 97.6 | |||
Informal votes | 1,344 | 2.4 | |||
Turnout | 56,773 | 93.8 | |||
Two-party-preferred result | |||||
Labor | Adrian Bennett | 54.1 | +8.3 | ||
Liberal | Richard Cleaver | 45.9 | −8.3 | ||
Labor gain from Liberal | Swing | +8.3 | |||
Party | Candidate | Votes | % | ±% | |
---|---|---|---|---|---|
Liberal | Richard Cleaver | 25,014 | 47.1 | −0.4 | |
Labor | Edward Gillett | 23,942 | 45.1 | −2.2 | |
Democratic Labor | Alan Crofts | 4,154 | 7.8 | +3.3 | |
Total formal votes | 53,110 | 96.4 | |||
Informal votes | 1,963 | 3.6 | |||
Turnout | 55,073 | 94.2 | |||
Two-party-preferred result | |||||
Liberal | Richard Cleaver | 28,440 | 53.5 | +1.4 | |
Labor | Edward Gillett | 24,670 | 46.5 | −1.4 | |
Liberal hold | Swing | +1.4 | |||
Party | Candidate | Votes | % | ±% | |
---|---|---|---|---|---|
Liberal | Richard Cleaver | 23,547 | 47.5 | −1.8 | |
Labor | Joe Berinson | 23,415 | 47.3 | +4.6 | |
Democratic Labor | Gerardus Sappelli | 2,253 | 4.5 | −3.6 | |
Independent | Warwick Hill | 312 | 0.6 | +0.6 | |
Total formal votes | 49,527 | 98.1 | |||
Informal votes | 937 | 1.9 | |||
Turnout | 50,464 | 95.8 | |||
Two-party-preferred result | |||||
Liberal | Richard Cleaver | 25,799 | 52.1 | −3.4 | |
Labor | Joe Berinson | 23,728 | 47.9 | +3.4 | |
Liberal hold | Swing | -3.4 | |||
Party | Candidate | Votes | % | ±% | |
---|---|---|---|---|---|
Liberal | Richard Cleaver | 22,770 | 49.3 | +0.3 | |
Labor | Ted Johnson | 19,712 | 42.7 | +3.6 | |
Democratic Labor | Terence Merchant | 3,732 | 8.1 | −3.9 | |
Total formal votes | 46,214 | 97.1 | |||
Informal votes | 1,403 | 2.9 | |||
Turnout | 47,617 | 94.9 | |||
Two-party-preferred result | |||||
Liberal | Richard Cleaver | 25,671 | 55.5 | +1.9 | |
Labor | Ted Johnson | 20,543 | 44.5 | −1.9 | |
Liberal hold | Swing | -1.9 | |||
Party | Candidate | Votes | % | ±% | |
---|---|---|---|---|---|
Liberal | Richard Cleaver | 21,428 | 49.0 | −8.7 | |
Labor | Keith Dowding | 17,097 | 39.1 | −3.2 | |
Democratic Labor | Charles Noonan | 5,237 | 12.0 | +12.0 | |
Total formal votes | 43,762 | 96.9 | |||
Informal votes | 1,394 | 3.1 | |||
Turnout | 45,156 | 95.8 | |||
Two-party-preferred result | |||||
Liberal | Richard Cleaver | 25,140 | 57.4 | −0.3 | |
Labor | Keith Dowding | 18,622 | 42.6 | +0.3 | |
Liberal hold | Swing | -0.3 | |||
Party | Candidate | Votes | % | ±% | |
---|---|---|---|---|---|
Liberal | Richard Cleaver | 22,268 | 57.7 | +6.9 | |
Labor | Thomas Williams | 16,314 | 42.3 | −6.9 | |
Total formal votes | 38,582 | 96.4 | |||
Informal votes | 1,439 | 3.6 | |||
Turnout | 40,021 | 95.7 | |||
Liberal hold | Swing | +6.9 | |||
Party | Candidate | Votes | % | ±% | |
---|---|---|---|---|---|
Labor | Harry Webb | 26,799 | 50.1 | +5.9 | |
Liberal | Bill Grayden | 25,893 | 48.4 | −4.6 | |
Communist | Jack Marks | 838 | 1.6 | −1.2 | |
Total formal votes | 53,530 | 98.4 | |||
Informal votes | 856 | 1.6 | |||
Turnout | 53,386 | 95.8 | |||
Two-party-preferred result | |||||
Labor | Harry Webb | 51.6 | +4.9 | ||
Liberal | Bill Grayden | 48.4 | −4.9 | ||
Labor gain from Liberal | Swing | +4.9 | |||
Party | Candidate | Votes | % | ±% | |
---|---|---|---|---|---|
Liberal | Bill Grayden | 24,336 | 53.0 | +0.6 | |
Labor | Harry Webb | 20,258 | 44.2 | −3.4 | |
Communist | Alex Jolly | 1,280 | 2.8 | +2.8 | |
Total formal votes | 45,874 | 97.5 | |||
Informal votes | 1,155 | 2.5 | |||
Turnout | 47,029 | 95.8 | |||
Two-party-preferred result | |||||
Liberal | Bill Grayden | 53.3 | +0.9 | ||
Labor | Harry Webb | 46.7 | −0.9 | ||
Liberal hold | Swing | +0.9 | |||
Party | Candidate | Votes | % | ±% | |
---|---|---|---|---|---|
Liberal | Bill Grayden | 22,821 | 52.4 | +11.1 | |
Labor | Harry Webb | 20,699 | 47.6 | −9.1 | |
Total formal votes | 43,520 | 97.7 | |||
Informal votes | 1,010 | 2.3 | |||
Turnout | 44,530 | 95.2 | |||
Liberal gain from Labor | Swing | +10.2 | |||
Party | Candidate | Votes | % | ±% | |
---|---|---|---|---|---|
Labor | Don Mountjoy | 25,260 | 45.6 | −4.5 | |
Country | Len Hamilton | 17,223 | 31.1 | −15.2 | |
Independent | Bill Grayden | 12,856 | 23.2 | +23.2 | |
Total formal votes | 55,339 | 97.2 | |||
Informal votes | 1,605 | 2.8 | |||
Turnout | 56,944 | 92.2 | |||
Two-party-preferred result | |||||
Country | Len Hamilton | 27,790 | 50.2 | +50.2 | |
Labor | Don Mountjoy | 27,549 | 49.8 | −3.2 | |
Country gain from Labor | Swing | +3.2 | |||
Party | Candidate | Votes | % | ±% | |
---|---|---|---|---|---|
Labor | Don Mountjoy | 25,690 | 50.1 | +21.9 | |
Country | Thomas Marwick | 18,124 | 35.3 | −17.7 | |
Country | Cecil Elsegood | 5,632 | 11.0 | +11.0 | |
Independent | John Tregenza | 1,859 | 3.6 | +3.6 | |
Total formal votes | 51,305 | 97.4 | |||
Informal votes | 1,369 | 2.6 | |||
Turnout | 52,674 | 94.8 | |||
Two-party-preferred result | |||||
Labor | Don Mountjoy | 53.0 | +10.5 | ||
Country | Thomas Marwick | 47.0 | −10.5 | ||
Labor gain from Country | Swing | +10.5 | |||
Party | Candidate | Votes | % | ±% | |
---|---|---|---|---|---|
Labor | Jim Dinan | 16,729 | 37.4 | +9.2 | |
Country | Thomas Marwick | 12,354 | 27.6 | −1.6 | |
Country | Percy Ferguson | 10,628 | 23.8 | +23.8 | |
Independent | Claude Barker | 4,980 | 11.1 | +11.1 | |
Total formal votes | 44,691 | 98.5 | |||
Informal votes | 701 | 1.5 | |||
Turnout | 45,392 | 84.6 | |||
Two-party-preferred result | |||||
Country | Thomas Marwick | 23,537 | 52.3 | −5.2 | |
Labor | Jim Dinan | 21,154 | 47.3 | +5.2 | |
Country hold | Swing | -5.2 | |||
Party | Candidate | Votes | % | ±% | |
---|---|---|---|---|---|
Country | Henry Gregory | 15,997 | 34.2 | +5.1 | |
Labor | Jim Dinan | 13,193 | 28.2 | −13.7 | |
Country | Thomas Marwick | 8,800 | 18.8 | +18.8 | |
Independent | Claude Barker | 7,758 | 16.6 | +16.6 | |
British Israel | John Tregenza | 986 | 2.1 | +2.1 | |
Total formal votes | 46,734 | 95.8 | |||
Informal votes | 2,073 | 4.2 | |||
Turnout | 48,807 | 92.4 | |||
Two-party-preferred result | |||||
Country | Henry Gregory | 26,855 | 57.5 | −0.6 | |
Labor | Jim Dinan | 19,879 | 42.5 | +0.6 | |
Country hold | Swing | -0.6 | |||
Party | Candidate | Votes | % | ±% | |
---|---|---|---|---|---|
Country | Henry Gregory | 26,299 | 58.1 | −5.9 | |
Labor | John Steele | 18,951 | 41.9 | +5.9 | |
Total formal votes | 45,250 | 96.5 | |||
Informal votes | 1,623 | 3.5 | |||
Turnout | 46,873 | 92.5 | |||
Country hold | Swing | -5.9 | |||
Party | Candidate | Votes | % | ±% | |
---|---|---|---|---|---|
Country | Henry Gregory | 32,101 | 63.2 | +8.5 | |
Labor | Frederick Law | 18,713 | 36.8 | +7.1 | |
Total formal votes | 50,814 | 96.0 | |||
Informal votes | 2,139 | 4.0 | |||
Turnout | 52,953 | 90.6 | |||
Country hold | Swing | -0.6 | |||
Party | Candidate | Votes | % | ±% | |
---|---|---|---|---|---|
Country | Henry Gregory | 26,234 | 54.7 | −45.3 | |
Labor | John Fraser | 14,232 | 29.7 | +29.7 | |
Independent | Carlyle Ferguson | 4,623 | 9.6 | +9.6 | |
Independent Country | Alfred Reynolds | 2,832 | 5.9 | +5.9 | |
Total formal votes | 47,921 | 95.7 | |||
Informal votes | 2,131 | 4.3 | |||
Turnout | 50,002 | 92.5 | |||
Two-party-preferred result | |||||
Country | Henry Gregory | 63.8 | −36.2 | ||
Labor | John Fraser | 36.2 | +36.2 | ||
Country hold | Swing | -36.2 | |||
Party | Candidate | Votes | % | ±% | |
---|---|---|---|---|---|
Country | Henry Gregory | unopposed | |||
Country hold | Swing | ||||
Party | Candidate | Votes | % | ±% | |
---|---|---|---|---|---|
Country | Henry Gregory | unopposed | |||
Country hold | Swing | ||||
Party | Candidate | Votes | % | ±% | |
---|---|---|---|---|---|
Country | Henry Gregory | 24,978 | 66.2 | +66.2 | |
Labor | Ben Davies | 12,773 | 33.8 | +33.8 | |
Total formal votes | 37,751 | 96.7 | |||
Informal votes | 1,269 | 3.3 | |||
Turnout | 39,020 | 88.4 | |||
Country hold | Swing | -33.8 | |||
Party | Candidate | Votes | % | ±% | |
---|---|---|---|---|---|
Country | Henry Gregory | unopposed | |||
Country hold | Swing | ||||
Party | Candidate | Votes | % | ±% | |
---|---|---|---|---|---|
Labor | Edwin Corboy | 7,444 | 39.1 | +39.1 | |
Farmers and Settlers | John Prowse | 7,313 | 38.5 | +38.5 | |
Nationalist | William Hedges | 4,260 | 22.4 | −77.6 | |
Total formal votes | 19,017 | 93.9 | |||
Informal votes | 1,246 | 6.1 | |||
Turnout | 20,263 | 65.4 | |||
Two-party-preferred result | |||||
Farmers and Settlers | John Prowse | 11,039 | 58.0 | +58.0 | |
Labor | Edwin Corboy | 7,978 | 42.0 | +42.0 | |
Farmers and Settlers gain from Labor | Swing | +58.0 | |||
Party | Candidate | Votes | % | ±% | |
---|---|---|---|---|---|
Labor | Edwin Corboy | 6,540 | 34.4 | +34.4 | |
Farmers and Settlers | Basil Murray | 5,975 | 31.4 | +31.4 | |
Nationalist | William Hedges | 5,635 | 29.6 | −70.4 | |
Independent | William Watson | 884 | 4.6 | +4.6 | |
Total formal votes | 19,034 | 99.1 | |||
Informal votes | 179 | 0.9 | |||
Turnout | 19,213 | 64.3 | |||
Labor gain from Nationalist | Swing | +34.4 | |||
Party | Candidate | Votes | % | ±% | |
---|---|---|---|---|---|
Nationalist | Sir John Forrest | unopposed | |||
Nationalist hold | Swing | ||||
Party | Candidate | Votes | % | ±% | |
---|---|---|---|---|---|
Liberal | Sir John Forrest | 15,950 | 59.2 | +4.3 | |
Labor | Walter Peters | 10,985 | 40.8 | −4.3 | |
Total formal votes | 26,935 | 97.2 | |||
Informal votes | 787 | 2.8 | |||
Turnout | 27,722 | 72.8 | |||
Liberal hold | Swing | +4.3 | |||
Party | Candidate | Votes | % | ±% | |
---|---|---|---|---|---|
Liberal | Sir John Forrest | 15,055 | 54.9 | −1.4 | |
Labor | Peter O'Loghlen | 12,379 | 45.1 | +1.4 | |
Total formal votes | 27,434 | 98.6 | |||
Informal votes | 396 | 1.4 | |||
Turnout | 27,830 | 76.5 | |||
Liberal hold | Swing | -1.4 | |||
Party | Candidate | Votes | % | ±% | |
---|---|---|---|---|---|
Liberal | Sir John Forrest | 15,012 | 60.2 | −6.0 | |
Labour | Peter O'Loghlen | 9,930 | 39.8 | +6.0 | |
Total formal votes | 24,942 | 98.6 | |||
Informal votes | 360 | 1.4 | |||
Turnout | 25,302 | 64.3 | |||
Liberal hold | Swing | -2.0 | |||
Party | Candidate | Votes | % | ±% | |
---|---|---|---|---|---|
Western Australian | Sir John Forrest | 8,418 | 66.2 | −33.8 | |
Labour | Peter O'Loghlen | 4,292 | 33.8 | +33.8 | |
Total formal votes | 12,710 | 96.6 | |||
Informal votes | 453 | 3.4 | |||
Turnout | 13,163 | 45.0 | |||
Western Australian hold | Swing | -33.8 | |||
Party | Candidate | Votes | % | ±% | |
---|---|---|---|---|---|
Protectionist | Sir John Forrest | unopposed | |||
Protectionist hold | Swing | ||||
Party | Candidate | Votes | % | ±% | |
---|---|---|---|---|---|
Protectionist | Sir John Forrest | unopposed | |||
Protectionist win | (new seat) | ||||
The Division of Swan is an Australian electoral division located in Western Australia.
The Division of Cowan is an Australian Electoral Division in Western Australia.
The Division of Hasluck is an electoral division of the Australian House of Representatives, located in Western Australia.
The Division of Perth is an Australian electoral division in the state of Western Australia. It is named after Perth, the capital city of Western Australia, where the Division is located.
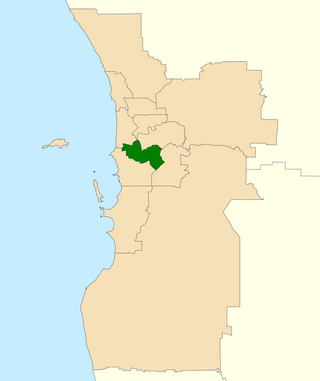
The Division of Tangney is an Australian electoral division in the state of Western Australia. The Division was named after Dame Dorothy Tangney, the first female member of the Australian Senate.
This article lists electoral results for the Division of Fremantle in Australian federal elections from the division's creation in 1901 to the present.
This is a list of electoral results for the Division of Brand in Australian federal elections from the division's creation in 1984 until the present.
This is a list of electoral results for the Division of Cowan in Australian federal elections from the division's creation in 1984 until the present.
This is a list of electoral results for the Division of Curtin in Australian federal elections from the division's creation in 1949 until the present.
This is a list of electoral results for the Division of Forrest in Australian federal elections from the division's creation in 1922 until the present.
This is a list of electoral results for the Division of Hasluck in Australian federal elections from the division's creation in 2001 until the present.
This is a list of electoral results for the Division of Moore in Australian federal elections from the division's creation in 1949 until the present.
This is a list of electoral results for the Division of O'Connor in Australian federal elections from the division's creation in 1980 until the present.
This is a list of electoral results for the Division of Pearce in Australian federal elections from the division's creation in 1990 until the present.
This is a list of electoral results for the Division of Perth in Australian federal elections from the division's creation in 1901 until the present.
This is a list of electoral results for the Division of Stirling in Australian federal elections from the division's creation in 1955 until 2019. The division was abolished in 2022.
This is a list of electoral results for the Division of Tangney in Australian federal elections from the division's creation in 1974 until the present.
This is a list of electoral results for the Division of Durack in Australian federal elections from the division's creation in 2010 until the present.
This is a list of electoral division results for the 2019 Australian federal election in the state of Western Australia.
The 2022 Australian federal election was held on 21 May 2022 to elect all 151 members of the Australian House of Representatives and 40 of 76 members of the Australian Senate. Of those, 15 MPs and 6 senators were elected to represent the state of Western Australia.