Electoral results for the Division of Perth

Last updated

This is a list of electoral results for the Division of Perth in Australian federal elections from the division's creation in 1901 until the present.

Contents

Members

MemberPartyTerm
  James Fowler Labour 1901–1909
  Commonwealth Liberal 1909–1917
  Nationalist 1917–1922
  Edward Mann Nationalist 1922–1929
  Independent Nationalist 1929
  Walter Nairn Nationalist 1929–1931
  United Australia 1931–1943
  Tom Burke Labor 1943–1955
  Fred Chaney Sr. Liberal 1955–1969
  Joe Berinson Labor 1969–1975
  Ross McLean Liberal 1975–1983
  Dr Ric Charlesworth Labor 1983–1993
  Stephen Smith Labor 1993–2013
  Alannah MacTiernan Labor 2013–2016
  Tim Hammond Labor 2016–2018
  Patrick Gorman Labor 2018–present

Election results

Elections in the 2020s

2022

2022 Australian federal election: Perth [1]
PartyCandidateVotes%±%
Labor Patrick Gorman 29,22940.18+6.59
Liberal David Dwyer19,03626.17−12.81
Greens Caroline Perks16,21822.29+3.92
One Nation Cameron Bailey1,9362.66−0.06
Western Australia Dave Vos1,2401.70−0.71
United Australia Sonya Eberhart1,1021.51−0.29
Christians Dean Powell1,0361.42+1.03
Animal Justice Sarah Szmekura-Moor9901.36+1.36
Liberal Democrats Evan Nickols9621.32+1.32
Australian Federation Aiden Gyuru5070.70+0.70
Great Australian Sean Connor4900.67+0.67
Total formal votes72,74694.65−0.97
Informal votes4,1105.35+0.97
Turnout 76,85662.63
Two-party-preferred result
Labor Patrick Gorman 47,82465.74+12.51
Liberal David Dwyer24,92234.26−12.51
Labor hold Swing +12.51
Results are not final. Last updated on 23 May 2022 at 4:30 pm AEST.

Elections in the 2010s

2019

2019 Australian federal election: Perth [2]
PartyCandidateVotes%±%
Liberal Jim Grayden32,80037.40−4.91
Labor Patrick Gorman 30,20734.44−2.92
Greens Caroline Perks16,55218.87+1.80
One Nation Mel Lownds2,3332.66+2.66
Western Australia Jane Boxall2,2222.53+2.53
United Australia Chas Hopkins 1,6611.89+1.89
Science Gary Davies1,3291.52+1.52
VOTEFLUX.ORG Curtis Greening6020.69+0.69
Total formal votes87,70695.41−0.82
Informal votes4,2204.59+0.82
Turnout 91,92690.65+2.61
Two-party-preferred result
Labor Patrick Gorman 48,17654.93+1.60
Liberal Jim Grayden39,53045.07−1.60
Labor hold Swing +1.60

2018

Perth by-election: 28 July 2018 [3] [4]
PartyCandidateVotes%±%
Labor Patrick Gorman 22,81239.33+1.96
Greens Caroline Perks10,90818.81+1.74
Independent Paul Collins5,5169.51+9.51
Liberal Democrats Wesley Du Preez3,8806.69+4.98
Julie Matheson3,1235.38+5.38
Independent Jim Grayden2,5654.42+4.42
Animal Justice Nicole Arielli1,8153.13+3.13
Independent Ian Britza 1,7052.94+2.94
Christians Ellen Joubert1,4742.54+2.54
Science Aaron Hammond1,0021.73+1.73
Mental Health Ben Mullings9301.60+1.60
Sustainable Australia Colin Scott7741.33+1.33
Liberty Alliance Tony Robinson6821.18+1.18
CEC Barry Mason5961.03+1.03
People's Party Gabriel Harfouche2220.38+0.38
Total formal votes58,00489.94−6.29
Informal votes6,48610.06+6.29
Turnout 64,49064.07−23.97
Two-candidate-preferred result
Labor Patrick Gorman 36,60163.10+9.77
Greens Caroline Perks21,40336.90+36.90
Labor hold Swing N/A

2016

2016 Australian federal election: Perth [5]
PartyCandidateVotes%±%
Liberal Jeremy Quinn35,38142.31+0.20
Labor Tim Hammond 31,24837.36−1.02
Greens Tim Clifford 14,27217.07+5.10
Liberal Democrats Mark Walmsley1,4301.71+1.71
Online Direct Democracy Andrew Chambers1,3001.55+1.55
Total formal votes83,63196.23+1.12
Informal votes3,2743.77−1.12
Turnout 86,90588.04−2.79
Two-party-preferred result
Labor Tim Hammond 44,60253.33+1.15
Liberal Jeremy Quinn39,02946.67−1.15
Labor hold Swing +1.15

2013

2013 Australian federal election: Perth [6]
PartyCandidateVotes%±%
Labor Alannah MacTiernan 34,21541.25+1.06
Liberal Darryl Moore33,02139.81+1.07
Greens Jonathan Hallett8,80110.61−5.54
Palmer United Gabriel Harfouche2,8973.49+3.49
Christians Paul Connelly1,8912.28+2.28
Independent Ant Clark1,0251.24+1.24
Family First Lesley Croll6690.81−0.74
Rise Up Australia Evelyn Edney4220.51+0.51
Total formal votes82,94194.72−0.08
Informal votes4,6255.28+0.08
Turnout 87,56691.96−0.08
Two-party-preferred result
Labor Alannah MacTiernan 45,07954.35−1.53
Liberal Darryl Moore37,86245.65+1.53
Labor hold Swing −1.53

2010

2010 Australian federal election: Perth [7]
PartyCandidateVotes%±%
Labor Stephen Smith 32,22840.19-6.12
Liberal Joe Ferrante31,06438.74+1.84
Greens Jonathan Hallett12,94816.15+5.82
Christian Democrats Paul Connelly2,0932.61+0.62
Family First Nigel Irvine1,2431.55+0.45
Socialist Alliance Alex Bainbridge6180.77+0.22
Total formal votes80,19494.80-0.61
Informal votes4,4005.20+0.61
Turnout 84,59492.05-1.14
Two-party-preferred result
Labor Stephen Smith 44,81555.88-2.06
Liberal Joe Ferrante35,37944.12+2.06
Labor hold Swing -2.06

Elections in the 2000s

2007

2007 Australian federal election: Perth
PartyCandidateVotes%±%
Labor Stephen Smith 36,68446.87+1.28
Liberal Daniel Nikolic28,16335.98-0.90
Greens Damian Douglas-Meyer8,32010.63+1.05
Christian Democrats Paul Connelly1,5942.04-0.42
Independent Stephen Brooks1,4131.81+1.81
Family First Sharon Fairfull8381.07+1.07
One Nation Marie Edmonds6280.80-1.19
Socialist Alliance Chris Latham4640.59-0.75
CEC Orm Girvan1620.21-0.13
Total formal votes78,26695.42+1.40
Informal votes3,7574.58-1.40
Turnout 82,02393.03+0.10
Two-party-preferred result
Labor Stephen Smith 46,06158.85+2.12
Liberal Daniel Nikolic32,20541.15-2.12
Labor hold Swing +2.12

2004

2004 Australian federal election: Perth
PartyCandidateVotes%±%
Labor Stephen Smith 33,53245.59-2.29
Liberal Alexander Lawrance27,12736.88+4.55
Greens Alison Xamon 7,0459.58+2.22
Christian Democrats Augustine Loh1,8072.46+2.46
One Nation Marie Edmonds1,4631.99-2.40
Democrats Ray Bradbury1,3441.83-5.45
Socialist Alliance Nikki Ulasowski9841.34+1.34
CEC Ross Russell2470.34+0.34
Total formal votes73,54994.02-0.96
Informal votes4,6805.98+0.96
Turnout 78,22992.93-1.92
Two-party-preferred result
Labor Stephen Smith 41,72356.73-4.48
Liberal Alexander Lawrance31,82643.27+4.48
Labor hold Swing -4.48

2001

2001 Australian federal election: Perth
PartyCandidateVotes%±%
Labor Stephen Smith 35,38947.88-1.88
Liberal Rod Webb23,89432.33+1.95
Greens Alison Xamon 5,4377.36+1.27
Democrats Aaron Hewett5,3817.28+2.63
One Nation Peter Gilberthorpe3,2444.39-3.81
Philip Chilton5680.77+0.77
Total formal votes73,91394.98-1.18
Informal votes3,9075.02+1.18
Turnout 77,82095.25
Two-party-preferred result
Labor Stephen Smith 45,23961.21-1.33
Liberal Rod Webb28,67438.79+1.33
Labor hold Swing -1.33

Elections in the 1990s

1998

1998 Australian federal election: Perth
PartyCandidateVotes%±%
Labor Stephen Smith 38,39550.16+2.89
Liberal David Montani22,68929.64-8.66
One Nation Kerry Mills6,5558.56+8.56
Greens Gemma Carter4,7136.16+0.24
Democrats Brendon Entrekin3,5174.59-1.72
Democratic Socialist Iggy Kim6820.89+0.89
Total formal votes76,55196.11-0.03
Informal votes3,1023.89+0.03
Turnout 79,65394.32+0.37
Two-party-preferred result
Labor Stephen Smith 48,44163.28+6.60
Liberal David Montani28,11036.72-6.60
Labor hold Swing +6.60

1996

1996 Australian federal election: Perth
PartyCandidateVotes%±%
Labor Stephen Smith 32,01847.56+1.19
Liberal Dee Kelly25,26237.53-1.29
Greens Elena Jeffreys4,1896.22+0.59
Democrats Jim Kerr4,1756.20+3.88
Independent Raymond Conder9141.36+1.36
Anthony Benbow4180.62+0.62
Gary Nelson3390.50+0.50
Total formal votes67,31596.17-0.28
Informal votes2,6783.83+0.28
Turnout 69,99393.95-1.04
Two-party-preferred result
Labor Stephen Smith 37,75656.46+0.31
Liberal Dee Kelly29,12143.54-0.31
Labor hold Swing +0.31

1993

1993 Australian federal election: Perth
PartyCandidateVotes%±%
Labor Stephen Smith 31,58546.37+3.79
Liberal Barney Cresswell26,44038.82+1.20
Greens Patsy Molloy3,8365.63-2.71
Democrats Irene Knight1,5812.32-5.50
Call to Australia Chris Bignell1,4992.20+2.20
Independent Peter Blurton1,4602.14+2.14
Independent Michael Goff8571.26+1.26
Michelle Hovane5870.86+0.86
Natural Law Jennifer Benjamin2680.39+0.39
Total formal votes68,11396.45+1.21
Informal votes2,5073.55-1.21
Turnout 70,62094.99
Two-party-preferred result
Labor Stephen Smith 38,20256.15+0.97
Liberal Barney Cresswell29,83943.85-0.97
Labor hold Swing +0.97

1990

1990 Australian federal election: Perth
PartyCandidateVotes%±%
Labor Ric Charlesworth 28,04742.6-16.4
Liberal Marylyn Rodgers24,77537.6-5.9
Greens Brenda Conochie5,4968.3+8.3
Democrats Brian Jenkins5,1527.8+7.8
Democratic Socialist Richard Cheuk1,2111.8+1.8
Grey Power Don Gudgeon7021.1+1.1
National William Witham4830.7-4.0
Total formal votes65,86695.2
Informal votes3,2924.8
Turnout 69,15893.4
Two-party-preferred result
Labor Ric Charlesworth 36,25255.2-5.2
Liberal Marylyn Rodgers29,45544.8+5.2
Labor hold Swing -5.2

Elections in the 1980s

1987

1987 Australian federal election: Perth
PartyCandidateVotes%±%
Labor Ric Charlesworth 34,00355.4+0.2
Liberal Bob Campbell24,49439.9-2.3
National Ted Lisle2,8574.7+4.7
Total formal votes61,35492.3
Informal votes5,1517.7
Turnout 66,50593.7
Two-party-preferred result
Labor Ric Charlesworth 34,81956.8+0.5
Liberal Bob Campbell26,53543.2-0.5
Labor hold Swing +0.5

1984

1984 Australian federal election: Perth
PartyCandidateVotes%±%
Labor Ric Charlesworth 32,90655.2-1.3
Liberal Joan Walters25,14842.2+1.5
Socialist Workers Catherine Brown1,5352.6+2.6
Total formal votes59,58991.3
Informal votes5,6708.7
Turnout 65,25993.6
Two-party-preferred result
Labor Ric Charlesworth 33,52356.3-1.9
Liberal Joan Walters26,06643.7+1.9
Labor hold Swing -1.9

1983

1983 Australian federal election: Perth
PartyCandidateVotes%±%
Labor Ric Charlesworth 34,10854.7+9.0
Liberal Ross McLean 26,51042.5-5.7
Democrats Geoffrey Syme1,7702.8-2.4
Total formal votes62,38897.7
Informal votes1,4462.3
Turnout 63,83492.5
Two-party-preferred result
Labor Ric Charlesworth 56.4+7.4
Liberal Ross McLean 43.6-7.4
Labor gain from Liberal Swing +7.4

1980

1980 Australian federal election: Perth
PartyCandidateVotes%±%
Liberal Ross McLean 29,13148.2-2.6
Labor William Delaney27,59945.7+10.4
Democrats Robert Foster3,1125.2-4.6
Prog. Conservative June Steen-Olsen5510.9+0.9
Total formal votes60,40397.0
Informal votes1,8433.0
Turnout 62,24693.0
Two-party-preferred result
Liberal Ross McLean 30,80751.0-8.5
Labor William Delaney29,59649.0+8.5
Liberal hold Swing -8.5

Elections in the 1970s

1977

1977 Australian federal election: Perth
PartyCandidateVotes%±%
Liberal Ross McLean 31,94450.8-5.6
Labor James Moiler 22,17735.3-6.9
Democrats Thomas Garrick6,1539.8+9.8
Progress Lawrence Curtis2,5914.1+4.1
Total formal votes62,86596.5
Informal votes2,2663.5
Turnout 65,13195.1
Two-party-preferred result
Liberal Ross McLean 59.5-3.0
Labor James Moiler 40.5+3.0
Liberal hold Swing -3.0

1975

1975 Australian federal election: Perth
PartyCandidateVotes%±%
Liberal Ross McLean 31,65850.7+13.0
Labor Joe Berinson 29,90247.9-8.6
Communist Vic Slater8901.4+0.5
Total formal votes62,45097.1
Informal votes1,8452.9
Turnout 64,29594.3
Two-party-preferred result
Liberal Ross McLean 50.8+9.0
Labor Joe Berinson 49.2-9.0
Liberal gain from Labor Swing +9.0

1974

1974 Australian federal election: Perth
PartyCandidateVotes%±%
Labor Joe Berinson 33,78656.5+4.0
Liberal Derrick Tomlinson 22,52937.7-4.5
National Alliance Dorothy Cranley2,4874.2-1.1
Communist Paul Marsh5390.9+0.9
Australia Wilfred Campin4110.7+0.7
Total formal votes59,75296.6
Informal votes2,0773.4
Turnout 61,82993.9
Two-party-preferred result
Labor Joe Berinson 58.2+4.6
Liberal Derrick Tomlinson 41.8-4.6
Labor hold Swing +4.6

1972

1972 Australian federal election: Perth
PartyCandidateVotes%±%
Labor Joe Berinson 28,22651.3-3.8
Liberal Derrick Tomlinson 23,91143.4+5.1
Democratic Labor Dorothy Cranley2,9285.3+1.2
Total formal votes55,06597.1
Informal votes1,6232.9
Turnout 56,68892.3
Two-party-preferred result
Labor Joe Berinson 52.4-5.8
Liberal Derrick Tomlinson 47.6+5.8
Labor hold Swing -5.8

Elections in the 1960s

1969

1969 Australian federal election: Perth
PartyCandidateVotes%±%
Labor Joe Berinson 29,30955.1+15.6
Liberal Fred Chaney Sr. 20,37338.3-8.3
Democratic Labor John Martyr 2,1594.1-3.7
Independent Patricia Giles 1,3082.5+2.5
Total formal votes53,14996.6
Informal votes1,8663.4
Turnout 55,01593.7
Two-party-preferred result
Labor Joe Berinson 58.2+12.2
Liberal Fred Chaney Sr. 41.8-12.2
Labor gain from Liberal Swing +12.2

1966

1966 Australian federal election: Perth
PartyCandidateVotes%±%
Liberal Fred Chaney Sr. 13,22349.5-4.8
Labor Alan Bate9,78536.6-3.6
Democratic Labor George Mazak2,0717.8+2.2
Communist Annette Aarons 1,6276.1+6.1
Total formal votes26,70692.9
Informal votes2,0467.1
Turnout 28,75293.4
Two-party-preferred result
Liberal Fred Chaney Sr. 56.9-1.9
Labor Alan Bate43.1+1.9
Liberal hold Swing -1.9

1963

1963 Australian federal election: Perth
PartyCandidateVotes%±%
Liberal Fred Chaney Sr. 15,86754.3-0.7
Labor Edward Halse11,74340.2+4.4
Democratic Labor Arthur White1,6295.6-3.6
Total formal votes29,23997.1
Informal votes8602.9
Turnout 30,09993.8
Two-party-preferred result
Liberal Fred Chaney Sr. 58.8-3.6
Labor Edward Halse41.2+3.6
Liberal hold Swing -3.6

1961

1961 Australian federal election: Perth
PartyCandidateVotes%±%
Liberal Fred Chaney Sr. 16,05455.0-1.0
Labor Laurie Wilkinson 10,44335.8+4.2
Democratic Labor Julius Re2,6799.2-1.1
Total formal votes29,17695.3
Informal votes1,4364.7
Turnout 30,61292.7
Two-party-preferred result
Liberal Fred Chaney Sr. 62.4-2.8
Labor Laurie Wilkinson 37.6+2.8
Liberal hold Swing -2.8

Elections in the 1950s

1958

1958 Australian federal election: Perth
PartyCandidateVotes%±%
Liberal Fred Chaney Sr. 17,42656.0+4.5
Labor Laurie Wilkinson 9,84131.6-16.9
Democratic Labor Terence Merchant3,18910.3+10.3
Independent Claude Swaine6552.1+2.1
Total formal votes31,11195.7
Informal votes1,3934.3
Turnout 32,50494.2
Two-party-preferred result
Liberal Fred Chaney Sr. 65.2+13.7
Labor Laurie Wilkinson 34.8-13.7
Liberal hold Swing +13.7

1955

1955 Australian federal election: Perth
PartyCandidateVotes%±%
Liberal Fred Chaney Sr. 17,57551.5+4.6
Labor Tom Burke 16,53648.5-2.4
Total formal votes34,11196.8
Informal votes1,1423.2
Turnout 35,25394.4
Liberal gain from Labor Swing +3.8

1954

1954 Australian federal election: Perth
PartyCandidateVotes%±%
Labor Tom Burke 15,91251.7+2.7
Liberal Robert Phillips14,08745.7-3.8
All PartiesCarlyle Ferguson5301.7+1.7
Communist John Gandini 2750.9-0.6
Total formal votes30,80497.8
Informal votes6792.2
Turnout 31,48396.6
Two-party-preferred result
Labor Tom Burke 52.3+2.1
Liberal Robert Phillips47.7-2.1
Labor hold Swing +2.1

1951

1951 Australian federal election: Perth
PartyCandidateVotes%±%
Liberal Billy Snedden 17,70549.5+3.1
Labor Tom Burke 17,50149.0+1.2
Communist James Kelly5321.5+0.2
Total formal votes35,73897.4
Informal votes9652.6
Turnout 36,70394.6
Two-party-preferred result
Labor Tom Burke 17,92650.2+0.1
Liberal Billy Snedden 17,81249.8-0.1
Labor hold Swing +0.1

Elections in the 1940s

1949

1949 Australian federal election: Perth
PartyCandidateVotes%±%
Labor Tom Burke 18,41247.8-7.7
Liberal Gordon Hack17,85846.4+10.9
Independent James Collins1,7564.6+4.6
Communist James Kelly4861.3-2.3
Total formal votes38,51297.5
Informal votes9922.5
Turnout 39,50494.9
Two-party-preferred result
Labor Tom Burke 19,29450.1-11.3
Liberal Gordon Hack19,21849.9+11.3
Labor hold Swing -11.3

1946

1946 Australian federal election: Perth
PartyCandidateVotes%±%
Labor Tom Burke 31,23149.0+6.7
Liberal Jim Paton27,42943.1+13.7
Services John Graham2,1673.4+3.4
Communist Kevin Healy 2,0043.1-3.0
Independent Robert Salter8891.4+1.4
Total formal votes63,71095.8
Informal votes2,8204.2
Turnout 66,53092.6
Two-party-preferred result
Labor Tom Burke 52.4-3.6
Liberal Jim Paton47.6+3.6
Labor hold Swing -3.6

1943

1943 Australian federal election: Perth
PartyCandidateVotes%±%
Labor Tom Burke 25,37642.3+10.8
United Australia Walter Nairn 17,61029.4-33.0
Independent Thomas Hughes 8,11213.5+13.5
Communist Clarrie Boyd3,6396.1+6.1
Independent Stephenson Fox2,6114.4+4.4
Independent Robert Nicholson1,5012.5+2.5
Independent Dorothea Foster4950.8+0.8
Independent William Herbert4190.7+0.7
Independent Thomas Groves1690.3+0.3
Total formal votes59,93293.3
Informal votes4,3116.7
Turnout 64,24399.0
Two-party-preferred result
Labor Tom Burke 33,58156.0+20.5
United Australia Walter Nairn 26,35144.0-20.5
Labor gain from United Australia Swing +20.5

1940

1940 Australian federal election: Perth
PartyCandidateVotes%±%
United Australia Walter Nairn 33,99962.4+2.4
Labor Gavan McMillan17,14431.5-2.6
Independent James Bolitho3,3266.1+6.1
Total formal votes54,46996.9
Informal votes1,7383.1
Turnout 56,20793.5
Two-party-preferred result
United Australia Walter Nairn 64.5+4.2
Labor Gavan McMillan35.5-4.2
United Australia hold Swing +4.2

Elections in the 1930s

1937

1937 Australian federal election: Perth
PartyCandidateVotes%±%
United Australia Walter Nairn 21,80041.1+22.6
Labor Tom Burke 18,09134.1+0.1
United Australia Jack Simons 10,03518.9+18.9
Independent Viv James3,0855.8+5.8
Total formal votes53,01196.4
Informal votes1,9803.6
Turnout 54,99193.6
Two-party-preferred result
United Australia Walter Nairn 31,94260.3+2.9
Labor Tom Burke 21,06939.7-2.9
United Australia hold Swing +2.9

1934

1934 Australian federal election: Perth
PartyCandidateVotes%±%
United Australia Walter Nairn 16,72741.6-18.9
Labor Herb Graham 13,73734.2-5.3
Nationalist Tom Hartrey 6,71316.7+16.7
Independent Liberal Carlyle Ferguson3,0157.5+7.5
Total formal votes40,19296.0
Informal votes1,6674.0
Turnout 41,85992.2
Two-party-preferred result
United Australia Walter Nairn 22,82156.8-3.7
Labor Herb Graham 17,37143.2+3.7
United Australia hold Swing -3.7

1931

1931 Australian federal election: Perth
PartyCandidateVotes%±%
United Australia Walter Nairn 22,10260.5+25.0
Labor John Moloney 14,45939.5-3.6
Total formal votes36,56195.4
Informal votes1,7624.6
Turnout 38,32391.3
United Australia hold Swing +10.0

Elections in the 1920s

1929

1929 Australian federal election: Perth
PartyCandidateVotes%±%
Labor Ted Needham 16,41143.1+9.1
Nationalist Walter Nairn 13,52135.5-26.3
Ind. Nationalist Edward Mann 7,64520.1+20.1
Independent John McCoo5221.4-2.8
Total formal votes38,09997.4
Informal votes1,0202.6
Turnout 39,11989.9
Two-party-preferred result
Nationalist Walter Nairn 19,25450.5-14.4
Labor Ted Needham 18,84549.5+14.4
Nationalist hold Swing -14.4

1928

1928 Australian federal election: Perth
PartyCandidateVotes%±%
Nationalist Edward Mann 22,00261.8-1.0
Labor Arthur Watts12,08234.0-3.2
Independent John McCoo1,4994.2+4.2
Total formal votes35,58395.2
Informal votes1,8034.8
Turnout 37,38691.8
Two-party-preferred result
Nationalist Edward Mann 64.9+2.1
Labor Arthur Watts35.1-2.1
Nationalist hold Swing +2.1

1925

1925 Australian federal election: Perth
PartyCandidateVotes%±%
Nationalist Edward Mann 21,51762.8-3.0
Labor Dick Lane12,76837.2+3.0
Total formal votes34,28596.7
Informal votes1,1613.3
Turnout 35,44691.3
Nationalist hold Swing +3.9

1922

1922 Australian federal election: Perth
PartyCandidateVotes%±%
Labor Andrew Clementson4,95134.2-0.3
Nationalist Edward Mann 3,07321.3+1.0
Nationalist James Fowler 2,58317.9+1.0
Nationalist Alfred Carson 2,12514.7+1.0
Nationalist Harry Bolton 1,72812.0+12.0
Total formal votes14,46092.1
Informal votes1,2467.9
Turnout 15,70646.8
Two-party-preferred result
Nationalist Edward Mann 8,51358.9-2.9
Labor Andrew Clementson5,94741.1+2.9
Nationalist hold Swing -2.9

Elections in the 1910s

1919

1919 Australian federal election: Perth
PartyCandidateVotes%±%
Nationalist James Fowler 7,72138.4-7.7
Labor John Curtin 6,87734.2+3.7
Nationalist Lionel Carter 4,69923.4+23.4
Ind. Free Trade Gerald Hartrey8114.0+4.0
Total formal votes20,10893.4
Informal votes1,4196.6
Turnout 21,52758.4
Two-party-preferred result
Nationalist James Fowler 12,27561.0-8.5
Labor John Curtin 7,83339.0+8.5
Nationalist hold Swing -8.5

1917

1917 Australian federal election: Perth
PartyCandidateVotes%±%
Nationalist James Fowler 18,71569.5+13.7
Labor Alexander Panton 8,22130.5-13.7
Total formal votes26,93695.8
Informal votes1,1914.2
Turnout 28,12776.5
Nationalist hold Swing +13.7

1914

1914 Australian federal election: Perth
PartyCandidateVotes%±%
Liberal James Fowler 15,25655.8+2.5
Labor Alick McCallum 12,07144.2-2.5
Total formal votes27,32797.0
Informal votes8363.0
Turnout 28,16367.7
Liberal hold Swing +2.5

1913

1913 Australian federal election: Perth
PartyCandidateVotes%±%
Liberal James Fowler 14,84653.3-7.9
Labor Alick McCallum 13,00146.7+7.9
Total formal votes27,84797.1
Informal votes1,1163.9
Turnout 28,96371.6
Liberal hold Swing -7.9

1910

1910 Australian federal election: Perth
PartyCandidateVotes%±%
Liberal James Fowler 9,64860.7+13.4
Labour Ernest Henshaw 6,23739.3-13.4
Total formal votes15,88597.7
Informal votes3712.3
Turnout 16,25659.8
Liberal gain from Labour Swing +13.4

Elections in the 1900s

1906

1906 Australian federal election: Perth
PartyCandidateVotes%±%
Labour James Fowler 4,89252.7-20.1
Western Australian Edward Thurstan4,38447.3+20.1
Total formal votes9,27696.7
Informal votes3433.6
Turnout 9,61930.0
Labour hold Swing -20.1

1903

1903 Australian federal election: Perth
PartyCandidateVotes%±%
Labour James Fowler 4,24872.8+13.7
Free Trade Harry Venn 1,59127.2+27.2
Total formal votes5,83994.3
Informal votes3545.7
Turnout 6,19322.8
Labour hold Swing +13.7

1901

1901 Australian federal election: Perth
PartyCandidateVotes%±%
Labour James Fowler 3,33459.1+59.1
Protectionist Michael Cavanagh 2,31040.9+40.9
Total formal votes5,64498.2
Informal votes1061.8
Turnout 5,75031.1
Labour win(new seat)

Related Research Articles

Division of Swan Australian federal electoral division

The Division of Swan is an Australian electoral division located in Western Australia.

Division of Curtin Australian federal electoral division

The Division of Curtin is an Australian electoral division in Western Australia.

Division of Perth Australian federal electoral division

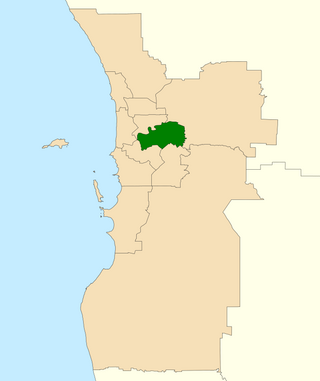
The Division of Perth is an Australian electoral division in the state of Western Australia. It is named after Perth, the capital city of Western Australia, where the Division is located.

Division of Moore Australian federal electoral division

The Division of Moore is an Australian electoral division in the state of Western Australia.

This article lists electoral results for the Division of Fremantle in Australian federal elections from the division's creation in 1901 to the present.

This is a list of electoral results for the Division of Brand in Australian federal elections from the division's creation in 1984 until the present.

This is a list of electoral results for the Division of Canning in Australian federal elections from the division's creation in 1949 until the present.

This is a list of electoral results for the Division of Cowan in Australian federal elections from the division's creation in 1984 until the present.

This is a list of electoral results for the Division of Curtin in Australian federal elections from the division's creation in 1949 until the present.

This is a list of electoral results for the Division of Forrest in Australian federal elections from the division's creation in 1922 until the present.

This is a list of electoral results for the Division of Hasluck in Australian federal elections from the division's creation in 2001 until the present.

This is a list of electoral results for the Division of Moore in Australian federal elections from the division's creation in 1949 until the present.

This is a list of electoral results for the Division of O'Connor in Australian federal elections from the division's creation in 1980 until the present.

This is a list of electoral results for the Division of Pearce in Australian federal elections from the division's creation in 1990 until the present.

This is a list of electoral results for the Division of Stirling in Australian federal elections from the division's creation in 1955 until 2019. The division was abolished in 2022.

This is a list of electoral results for the Division of Swan in Australian federal elections from the division's creation in 1901 until the present.

This is a list of electoral results for the Division of Tangney in Australian federal elections from the division's creation in 1974 until the present.

This is a list of electoral results for the Division of Durack in Australian federal elections from the division's creation in 2008 until the present.

Division of Burt Australian federal electoral division

The Division of Burt is an Australian electoral division in Perth in the state of Western Australia.

Results of the 2019 Australian federal election in Western Australia

This is a list of electoral division results for the 2019 Australian federal election in the state of Western Australia.

References

  1. Perth, WA, 2022 Tally Room, Australian Electoral Commission.
  2. Perth, WA, Tally Room 2019, Australian Electoral Commission.
  3. 2018 Perth by-election results: AEC
  4. 2018 Perth by-election results: ABC
  5. Perth, WA, Virtual Tally Room 2016, Australian Electoral Commission.
  6. 2013 results for Perth, AEC.
  7. "2010 results for Perth". AEC.