This is a list of electoral results for the Division of Cowan in Australian federal elections from the division's creation in 1984 until the present.
Member | Party | Term | |
---|---|---|---|
Carolyn Jakobsen | Labor | 1984–1993 | |
Richard Evans | Liberal | 1993–1998 | |
Graham Edwards | Labor | 1998–2007 | |
Luke Simpkins | Liberal | 2007–2016 | |
Anne Aly | Labor | 2016–present |
Party | Candidate | Votes | % | ±% | |
---|---|---|---|---|---|
Labor | Anne Aly | 46,712 | 46.86 | +9.03 | |
Liberal | Vince Connelly | 30,328 | 30.42 | −9.65 | |
Greens | Isabella Tripp | 9,829 | 9.86 | −1.22 | |
One Nation | Tyler Walsh | 2,839 | 2.85 | −1.81 | |
United Australia | Claire Hand | 2,423 | 2.43 | +0.18 | |
Christians | Sylvia Iradukunda | 1,859 | 1.86 | +0.03 | |
Animal Justice | Michael Anagno | 1,775 | 1.78 | +1.78 | |
Western Australia | Roland Laverack | 1,714 | 1.72 | +0.52 | |
Australian Federation | Michael Calautti | 1,125 | 1.13 | +1.13 | |
Liberal Democrats | Micah van Krieken | 1,080 | 1.08 | +1.08 | |
Total formal votes | 99,684 | 92.54 | −1.70 | ||
Informal votes | 8,039 | 7.46 | +1.70 | ||
Turnout | 107,723 | 87.86 | −2.83 | ||
Two-party-preferred result | |||||
Labor | Anne Aly | 60,625 | 60.82 | +9.96 | |
Liberal | Vince Connelly | 39,059 | 39.18 | −9.96 | |
Labor hold | Swing | +9.96 |
Party | Candidate | Votes | % | ±% | |
---|---|---|---|---|---|
Liberal | Isaac Stewart | 33,438 | 39.41 | −2.81 | |
Labor | Anne Aly | 32,353 | 38.13 | −3.55 | |
Greens | Mark Cooper | 8,551 | 10.08 | +2.48 | |
One Nation | Sheila Mundy | 4,777 | 5.63 | +5.63 | |
United Australia | Peter Westcott | 2,171 | 2.56 | +2.56 | |
Christians | Andre Lebrasse | 1,981 | 2.33 | −0.96 | |
Shooters, Fishers, Farmers | Paul Bedford | 1,582 | 1.86 | −0.95 | |
Total formal votes | 84,853 | 94.59 | +0.06 | ||
Informal votes | 4,850 | 5.41 | −0.06 | ||
Turnout | 89,703 | 90.91 | +1.31 | ||
Two-party-preferred result | |||||
Labor | Anne Aly | 43,135 | 50.83 | +0.15 | |
Liberal | Isaac Stewart | 41,718 | 49.17 | −0.15 | |
Labor hold | Swing | +0.15 |
Party | Candidate | Votes | % | ±% | |
---|---|---|---|---|---|
Liberal | Luke Simpkins | 34,405 | 42.22 | −4.36 | |
Labor | Anne Aly | 33,966 | 41.68 | +6.90 | |
Greens | Sheridan Young | 6,193 | 7.60 | −0.18 | |
Christians | Rex Host | 2,680 | 3.29 | +0.90 | |
Shooters, Fishers, Farmers | Jamie Chester | 2,288 | 2.81 | +2.81 | |
Liberal Democrats | Neil Hamilton | 1,096 | 1.34 | +1.34 | |
Mature Australia | Steve Veness | 868 | 1.07 | +1.07 | |
Total formal votes | 81,496 | 94.53 | +0.09 | ||
Informal votes | 4,712 | 5.47 | −0.09 | ||
Turnout | 86,208 | 89.60 | −2.07 | ||
Two-party-preferred result | |||||
Labor | Anne Aly | 41,301 | 50.68 | +5.20 | |
Liberal | Luke Simpkins | 40,195 | 49.32 | −5.20 | |
Labor gain from Liberal | Swing | +5.20 |
Party | Candidate | Votes | % | ±% | |
---|---|---|---|---|---|
Liberal | Luke Simpkins | 41,849 | 49.59 | −0.47 | |
Labor | Tristan Cockman | 27,248 | 32.29 | −0.16 | |
Greens | Adam Collins | 6,677 | 7.91 | −4.62 | |
Palmer United | Vimal Sharma | 4,501 | 5.33 | +5.33 | |
Christians | David Kingston | 1,802 | 2.14 | +2.14 | |
Family First | Che Tam Nguyen | 1,442 | 1.71 | −0.65 | |
Rise Up Australia | Sheila Mundy | 869 | 1.03 | +1.03 | |
Total formal votes | 84,388 | 94.90 | +0.02 | ||
Informal votes | 4,536 | 5.10 | −0.02 | ||
Turnout | 88,924 | 93.09 | −1.14 | ||
Two-party-preferred result | |||||
Liberal | Luke Simpkins | 48,487 | 57.46 | +1.17 | |
Labor | Tristan Cockman | 35,901 | 42.54 | −1.17 | |
Liberal hold | Swing | +1.17 |
Party | Candidate | Votes | % | ±% | |
---|---|---|---|---|---|
Liberal | Luke Simpkins | 40,077 | 50.06 | +4.75 | |
Labor | Chas Hopkins | 25,975 | 32.45 | −9.91 | |
Greens | Rob Phillips | 10,033 | 12.53 | +6.83 | |
Christian Democrats | David Kingston | 2,081 | 2.60 | +0.70 | |
Family First | Alan Leach | 1,888 | 2.36 | +0.64 | |
Total formal votes | 80,054 | 94.88 | −0.96 | ||
Informal votes | 4,320 | 5.12 | +0.96 | ||
Turnout | 84,374 | 94.22 | −0.37 | ||
Two-party-preferred result | |||||
Liberal | Luke Simpkins | 45,062 | 56.29 | +5.01 | |
Labor | Chas Hopkins | 34,992 | 43.71 | −5.01 | |
Liberal hold | Swing | +5.01 |
Party | Candidate | Votes | % | ±% | |
---|---|---|---|---|---|
Liberal | Luke Simpkins | 38,872 | 45.81 | +1.42 | |
Labor | Liz Prime | 35,633 | 41.99 | −1.88 | |
Greens | Johannes Herrmann | 4,778 | 5.63 | +0.04 | |
Christian Democrats | Martin Firth | 1,584 | 1.87 | −0.58 | |
Family First | Rhonda Hamersley | 1,452 | 1.71 | +1.71 | |
Liberty & Democracy | Ken Lee | 1,003 | 1.18 | +1.18 | |
One Nation | Dave Tierney | 783 | 0.92 | −1.09 | |
Independent | Norm Ramsay | 558 | 0.66 | +0.66 | |
Citizens Electoral Council | Roger Blakeway | 195 | 0.23 | −0.14 | |
Total formal votes | 84,858 | 95.84 | +0.85 | ||
Informal votes | 3,679 | 4.16 | −0.85 | ||
Turnout | 88,537 | 94.79 | +0.62 | ||
Two-party-preferred result | |||||
Liberal | Luke Simpkins | 43,883 | 51.71 | +2.49 | |
Labor | Liz Prime | 40,975 | 48.29 | −2.49 | |
Liberal gain from Labor | Swing | +2.49 | |||
Party | Candidate | Votes | % | ±% | |
---|---|---|---|---|---|
Liberal | Luke Simpkins | 33,905 | 44.39 | +8.27 | |
Labor | Graham Edwards | 33,510 | 43.87 | −3.88 | |
Greens | Glen George | 4,272 | 5.59 | +1.53 | |
Christian Democrats | Richard Leeder | 1,873 | 2.45 | +0.91 | |
One Nation | Clem Winton | 1,538 | 2.01 | −3.67 | |
Democrats | Sarah Gilfillan | 1,002 | 1.31 | −2.97 | |
Citizens Electoral Council | Basil Atkins | 282 | 0.37 | +0.37 | |
Total formal votes | 76,382 | 94.99 | −0.34 | ||
Informal votes | 4,032 | 5.01 | +0.34 | ||
Turnout | 80,414 | 94.17 | −1.55 | ||
Two-party-preferred result | |||||
Labor | Graham Edwards | 38,784 | 50.78 | −4.73 | |
Liberal | Luke Simpkins | 37,598 | 49.22 | +4.73 | |
Labor hold | Swing | −4.73 | |||
Party | Candidate | Votes | % | ±% | |
---|---|---|---|---|---|
Labor | Graham Edwards | 34,703 | 47.75 | +4.14 | |
Liberal | Andre Shannon | 26,250 | 36.12 | −2.72 | |
One Nation | Ron Holt | 4,130 | 5.68 | −2.39 | |
Democrats | Tracy Chaloner | 3,111 | 4.28 | +0.34 | |
Greens | Dave Fort | 2,951 | 4.06 | +0.16 | |
Christian Democrats | Paul Salmon | 1,117 | 1.54 | +0.36 | |
National | Sue Metcalf | 410 | 0.56 | +0.56 | |
Total formal votes | 72,672 | 95.33 | −0.84 | ||
Informal votes | 3,564 | 4.67 | +0.84 | ||
Turnout | 76,236 | 96.06 | |||
Two-party-preferred result | |||||
Labor | Graham Edwards | 40,341 | 55.51 | +2.40 | |
Liberal | Andre Shannon | 32,331 | 44.49 | −2.40 | |
Labor hold | Swing | +2.40 | |||
Party | Candidate | Votes | % | ±% | |
---|---|---|---|---|---|
Labor | Graham Edwards | 31,312 | 43.89 | +4.19 | |
Liberal | Richard Evans | 27,797 | 38.96 | −6.25 | |
One Nation | Ron Holt | 5,777 | 8.10 | +8.10 | |
Democrats | Craig Wakeford | 2,847 | 3.99 | −3.35 | |
Greens | Miguel Costello | 2,760 | 3.87 | −0.46 | |
Christian Democrats | Phillip Hayes | 850 | 1.19 | +1.19 | |
Total formal votes | 71,343 | 96.14 | −0.32 | ||
Informal votes | 2,863 | 3.86 | +0.32 | ||
Turnout | 74,206 | 96.14 | +0.21 | ||
Two-party-preferred result | |||||
Labor | Graham Edwards | 38,208 | 53.56 | +7.62 | |
Liberal | Richard Evans | 33,135 | 46.44 | −7.62 | |
Labor gain from Liberal | Swing | +7.62 | |||
Party | Candidate | Votes | % | ±% | |
---|---|---|---|---|---|
Liberal | Richard Evans | 35,083 | 46.44 | −1.27 | |
Labor | Carolyn Jakobsen | 31,416 | 41.58 | −2.57 | |
Democrats | Sue Coyne | 5,734 | 7.59 | +4.58 | |
Greens | Otto Dik | 3,315 | 4.39 | −0.17 | |
Total formal votes | 75,548 | 96.35 | −1.16 | ||
Informal votes | 2,864 | 3.65 | +1.16 | ||
Turnout | 78,412 | 95.93 | −0.63 | ||
Two-party-preferred result | |||||
Liberal | Richard Evans | 39,385 | 52.39 | +1.46 | |
Labor | Carolyn Jakobsen | 35,788 | 47.61 | −1.46 | |
Liberal hold | Swing | +1.46 | |||
Party | Candidate | Votes | % | ±% | |
---|---|---|---|---|---|
Liberal | Richard Evans | 33,472 | 47.71 | +4.99 | |
Labor | Carolyn Jakobsen | 30,982 | 44.16 | +4.22 | |
Greens | Otto Dik | 3,197 | 4.56 | −1.35 | |
Democrats | Stewart Godden | 2,113 | 3.01 | −5.60 | |
Natural Law | Suzan Miles | 398 | 0.57 | +0.57 | |
Total formal votes | 70,162 | 97.51 | +1.76 | ||
Informal votes | 1,792 | 2.49 | −1.76 | ||
Turnout | 71,954 | 96.56 | |||
Two-party-preferred result | |||||
Liberal | Richard Evans | 35,719 | 50.93 | +1.78 | |
Labor | Carolyn Jakobsen | 34,412 | 49.07 | −1.78 | |
Liberal gain from Labor | Swing | +1.78 | |||
Party | Candidate | Votes | % | ±% | |
---|---|---|---|---|---|
Liberal | Diane Airey | 26,061 | 42.7 | +1.7 | |
Labor | Carolyn Jakobsen | 24,368 | 39.9 | −14.4 | |
Democrats | Sarah Gilfillan | 5,256 | 8.6 | +8.6 | |
Greens | Sally Ward | 3,603 | 5.9 | +5.9 | |
Grey Power | Barry Smith | 785 | 1.3 | +1.3 | |
Independent | Robert McLoughlin | 414 | 0.7 | +0.7 | |
Democratic Socialist | Deb Thomas | 321 | 0.5 | +0.5 | |
Conservative | Brian Guinan | 206 | 0.3 | +0.3 | |
Total formal votes | 61,014 | 95.7 | |||
Informal votes | 2,706 | 4.3 | |||
Turnout | 63,720 | 95.8 | |||
Two-party-preferred result | |||||
Labor | Carolyn Jakobsen | 30,982 | 50.9 | −4.6 | |
Liberal | Diane Airey | 29,945 | 49.1 | +4.6 | |
Labor hold | Swing | −4.6 | |||
Party | Candidate | Votes | % | ±% | |
---|---|---|---|---|---|
Labor | Carolyn Jakobsen | 32,481 | 52.0 | +0.8 | |
Liberal | Paul Filing | 27,048 | 43.3 | +0.3 | |
National | Neil Baker | 2,973 | 4.8 | +4.8 | |
Total formal votes | 62,502 | 93.6 | |||
Informal votes | 4,240 | 6.4 | |||
Turnout | 66,742 | 94.8 | |||
Two-party-preferred result | |||||
Labor | Carolyn Jakobsen | 33,241 | 53.2 | −0.8 | |
Liberal | Paul Filing | 29,260 | 46.8 | +0.8 | |
Labor hold | Swing | −0.8 | |||
Party | Candidate | Votes | % | ±% | |
---|---|---|---|---|---|
Labor | Carolyn Jakobsen | 27,373 | 51.2 | −4.1 | |
Liberal | Jeff Roberts | 22,969 | 43.0 | +3.6 | |
Democrats | Alan Needham | 3,081 | 5.8 | +0.6 | |
Total formal votes | 53,423 | 92.7 | |||
Informal votes | 4,195 | 7.3 | |||
Turnout | 57,618 | 94.7 | |||
Two-party-preferred result | |||||
Labor | Carolyn Jakobsen | 28,849 | 54.0 | −3.9 | |
Liberal | Jeff Roberts | 24,574 | 46.0 | +3.9 | |
Labor notional hold | Swing | −3.9 | |||
The Division of Cowan is an Australian Electoral Division in Western Australia.
The Division of Hasluck is an electoral division of the Australian House of Representatives, located in Western Australia.
The Division of Perth is an Australian electoral division in the state of Western Australia. It is named after Perth, the capital city of Western Australia, where the Division is located.
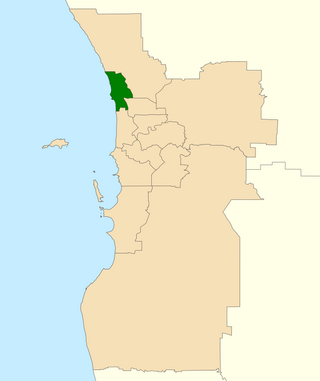
The Division of Moore is an Australian electoral division in the state of Western Australia.
This article lists electoral results for the Division of Fremantle in Australian federal elections from the division's creation in 1901 to the present.
This is a list of electoral results for the Division of Brand in Australian federal elections from the division's creation in 1984 until the present.
This is a list of electoral results for the Division of Curtin in Australian federal elections from the division's creation in 1949 until the present.
This is a list of electoral results for the Division of Forrest in Australian federal elections from the division's creation in 1922 until the present.
This is a list of electoral results for the Division of Hasluck in Australian federal elections from the division's creation in 2001 until the present.
This is a list of electoral results for the Division of Moore in Australian federal elections from the division's creation in 1949 until the present.
This is a list of electoral results for the Division of O'Connor in Australian federal elections from the division's creation in 1980 until the present.
This is a list of electoral results for the Division of Pearce in Australian federal elections from the division's creation in 1990 until the present.
This is a list of electoral results for the Division of Perth in Australian federal elections from the division's creation in 1901 until the present.
This is a list of electoral results for the Division of Stirling in Australian federal elections from the division's creation in 1955 until 2019. The division was abolished in 2022.
This is a list of electoral results for the Division of Swan in Australian federal elections from the division's creation in 1901 until the present.
This is a list of electoral results for the Division of Tangney in Australian federal elections from the division's creation in 1974 until the present.
This is a list of electoral results for the Division of Durack in Australian federal elections from the division's creation in 2010 until the present.
This is a list of electoral division results for the 2016 Australian federal election in the state of Western Australia.
This is a list of electoral division results for the 2019 Australian federal election in the state of Western Australia.
The 2022 Australian federal election was held on 21 May 2022 to elect all 151 members of the Australian House of Representatives and 40 of 76 members of the Australian Senate. Of those, 15 MPs and 6 senators were elected to represent the state of Western Australia.