Electoral results for the Division of Tangney

Last updated

This is a list of electoral results for the Division of Tangney in Australian federal elections from the division's creation in 1974 until the present.

Contents

Members

MemberPartyTerm
  John Dawkins Labor 1974–1975
  Peter Richardson Liberal 1975–1977
  Progress 1977–1977
  Peter Shack Liberal 1977–1983
  George Gear Labor 1983–1984
  Peter Shack Liberal 1984–1993
Daryl Williams 1993–2004
Dennis Jensen 2004–2016
  Independent 2016
  Ben Morton Liberal 2016–2022
  Sam Lim Labor 2022–present

Election results

Elections in the 2020s

2022

2022 Australian federal election: Tangney [1]
PartyCandidateVotes%±%
Liberal Ben Morton 43,00839.99−11.32
Labor Sam Lim 40,94038.07+10.12
Greens Adam Abdul Razak12,87611.97+1.09
Christians Mark Staer2,4812.31+0.05
One Nation Tshung-Hui Chang2,2882.13−0.28
Western Australia Jay Dean Gillett2,0961.95+0.73
United Australia Travis Llewellyn Mark1,7211.60+0.28
Liberal Democrats Jacqueline Holroyd1,1101.03+1.03
Australian Federation Brent Fowler1,0280.96+0.96
Total formal votes107,54896.18+0.78
Informal votes4,2713.82−0.78
Turnout 111,81991.51−1.99
Two-party-preferred result
Labor Sam Lim 56,33152.38+11.88
Liberal Ben Morton 51,21747.62−11.88
Labor gain from Liberal Swing +11.88

Elections in the 2010s

2019

2019 Australian federal election: Tangney [2]
PartyCandidateVotes%±%
Liberal Ben Morton 44,74053.63+4.82
Labor Marion Boswell21,64425.95+2.40
Greens Martin Spencer9,31911.17−1.22
Independent Jillian Horton1,9332.32+2.32
One Nation Scott Rafferty1,7322.08+2.08
Christians Mark Staer1,6952.03−1.34
Western Australia Gavin Waugh1,0801.29+1.29
United Australia Chris Fernandez9691.16+1.16
Independent Paul Waddy3070.37+0.37
Total formal votes83,41995.61−1.84
Informal votes3,8314.39+1.84
Turnout 87,25092.47+1.27
Two-party-preferred result
Liberal Ben Morton 51,27561.47+0.40
Labor Marion Boswell32,14438.53−0.40
Liberal hold Swing +0.40

2016

2016 Australian federal election: Tangney [3]
PartyCandidateVotes%±%
Liberal Ben Morton 40,79048.81−6.95
Labor Marion Boswell19,67923.55−1.82
Greens Thor Kerr10,35312.39+1.40
Independent Dennis Jensen 9,92411.88+11.88
Christians John Wieske2,8193.37+0.98
Total formal votes83,56597.45+1.74
Informal votes2,1832.55−1.74
Turnout 85,74891.20−5.95
Two-party-preferred result
Liberal Ben Morton 51,02961.07−1.95
Labor Marion Boswell32,53638.93+1.95
Liberal hold Swing −1.95

2013

2013 Australian federal election: Tangney [4]
PartyCandidateVotes%±%
Liberal Dennis Jensen 48,75257.17+1.48
Labor Luke Willis20,74424.33−1.47
Greens Peter Best8,88210.42−3.07
Palmer United Wayne Driver3,7384.38+4.38
Christians John Wieske2,2362.62+2.62
Rise Up Australia Stephen Carson9221.08+1.08
Total formal votes85,27495.83−0.69
Informal votes3,7074.17+0.69
Turnout 88,98193.81−0.41
Two-party-preferred result
Liberal Dennis Jensen 55,14464.67+2.35
Labor Luke Willis30,13035.33−2.35
Liberal hold Swing +2.35

2010

2010 Australian federal election: Tangney [5]
PartyCandidateVotes%±%
Liberal Dennis Jensen 46,71255.69+3.31
Labor David Doepel21,63725.80−5.73
Greens Peter Best11,31113.49+5.20
Christian Democrats Ka-ren Chew2,8143.36+1.01
Family First Moyna Rapp1,3991.67+0.53
Total formal votes83,87396.52−0.83
Informal votes3,0283.48+0.83
Turnout 86,90194.28−0.80
Two-party-preferred result
Liberal Dennis Jensen 52,26662.32+2.51
Labor David Doepel31,60737.68−2.51
Liberal hold Swing +2.51

Elections in the 2000s

2007

2007 Australian federal election: Tangney
PartyCandidateVotes%±%
Liberal Dennis Jensen 39,40650.85−2.87
Labor Mark Reynolds24,83232.04+3.50
Greens Christine Ivan6,8968.90+1.10
Independent Katherine Jackson3,0703.96+3.96
Christian Democrats Ka-ren Chew1,8672.41−0.37
Family First Lisa Saladine8151.05+1.05
One Nation Lloyd Boon6130.79−1.66
Total formal votes77,49997.27+1.71
Informal votes2,1782.73−1.71
Turnout 79,67794.56+0.65
Two-party-preferred result
Liberal Dennis Jensen 45,48058.68−3.07
Labor Mark Reynolds32,01941.32+3.07
Liberal hold Swing -3.07

2004

2004 Australian federal election: Tangney
PartyCandidateVotes%±%
Liberal Dennis Jensen 40,06153.72+3.91
Labor Gavin Waugh21,28828.54−3.29
Greens Andrew Duckett5,8147.80+2.77
Christian Democrats Colleen Tapley2,0752.78+1.24
Independent Wilson Wu1,8702.51+2.51
One Nation Lloyd Boon1,8282.45−0.94
Democrats Andrew Ingram1,4401.93−3.38
Citizens Electoral Council Neil Vincent2040.27+0.27
Total formal votes74,58095.56−0.40
Informal votes3,4684.44+0.40
Turnout 78,04893.91−1.52
Two-party-preferred result
Liberal Dennis Jensen 46,05061.75+3.78
Labor Gavin Waugh28,53038.25−3.78
Liberal hold Swing +3.78

2001

2001 Australian federal election: Tangney
PartyCandidateVotes%±%
Liberal Daryl Williams 37,84749.81+1.46
Labor Sam Gowegati24,18131.83−0.32
Democrats Andrew Ingram4,0335.31−0.28
Greens Ben Stanwix3,8205.03+0.23
One Nation Aaron Lumsdaine2,5763.39−3.61
Independent Gordon Graham1,2311.62+1.62
Christian Democrats Craig Watson1,1711.54−0.14
Liberals for Forests Michael Lucas1,1221.48+1.48
Total formal votes75,98195.96−0.93
Informal votes3,2004.04+0.93
Turnout 79,18195.75
Two-party-preferred result
Liberal Daryl Williams 44,04757.97+0.93
Labor Sam Gowegati31,93442.03−0.93
Liberal hold Swing +0.93

Elections in the 1990s

1998

1998 Australian federal election: Tangney
PartyCandidateVotes%±%
Liberal Daryl Williams 36,54747.31−7.62
Labor Martin Whitely 25,52133.04+2.18
One Nation Raymond O'Dwyer5,5647.20+7.20
Democrats Geoff Taylor4,3505.63−2.95
Greens Joshua Byrne3,5424.58−0.35
Christian Democrats Suryan Chandrasegaran1,4841.92+1.92
Abolish Child Support Manny Goldberg2460.32+0.32
Total formal votes77,25496.74−0.34
Informal votes2,6013.26+0.34
Turnout 79,85595.70−0.31
Two-party-preferred result
Liberal Daryl Williams 43,18455.90−5.96
Labor Martin Whitely 34,07044.10+5.96
Liberal hold Swing -5.96

1996

1996 Australian federal election: Tangney
PartyCandidateVotes%±%
Liberal Daryl Williams 37,75955.45−1.58
Labor Dermot Buckley20,42629.99−1.59
Democrats Ilse Trewin6,0908.94+5.35
Greens Margaret Jenkins3,4545.07−0.76
Natural Law Ken Barrett3720.55+0.10
Total formal votes68,10197.06−0.92
Informal votes2,0632.94+0.92
Turnout 70,16496.01−0.52
Two-party-preferred result
Liberal Daryl Williams 42,05062.13+0.27
Labor Dermot Buckley25,63037.87−0.27
Liberal hold Swing +0.27

1993

1993 Australian federal election: Tangney
PartyCandidateVotes%±%
Liberal Daryl Williams 38,91057.02+2.07
Labor Jason Jordan21,54931.58+4.18
Greens Mark Sundancer3,9765.83−1.14
Democrats Don Bryant2,4493.59−6.01
Call to Australia John Trenning1,0481.54+1.54
Natural Law Ken Barrett3030.44+0.44
Total formal votes68,23597.98+0.76
Informal votes1,4062.02−0.76
Turnout 69,64196.53
Two-party-preferred result
Liberal Daryl Williams 42,18961.86+0.10
Labor Jason Jordan26,01638.14−0.10
Liberal hold Swing +0.10

1990

1990 Australian federal election: Tangney
PartyCandidateVotes%±%
Liberal Peter Shack 34,57155.0+0.5
Labor Chris Keely17,23927.4−9.8
Democrats Hannah Wolfe6,0399.6+3.9
Greens Mark Schneider4,3867.0+7.0
Grey Power Andrew Wade6751.1+1.1
Total formal votes62,91097.2
Informal votes1,7982.8
Turnout 64,70895.5
Two-party-preferred result
Liberal Peter Shack 38,77961.8+2.7
Labor Chris Keely24,01938.2−2.7
Liberal hold Swing +2.7

Elections in the 1980s

1987

1987 Australian federal election: Tangney
PartyCandidateVotes%±%
Liberal Peter Shack 33,52052.9−2.4
Labor Ray Masterton24,59938.8−1.5
Democrats Richard Jeffreys3,6105.7+1.3
National William Witham1,6492.6+2.6
Total formal votes63,37894.4
Informal votes3,7385.6
Turnout 67,11695.4
Two-party-preferred result
Liberal Peter Shack 36,40557.4−0.4
Labor Ray Masterton26,96242.5+0.4
Liberal hold Swing -0.4

1984

1984 Australian federal election: Tangney
PartyCandidateVotes%±%
Liberal Peter Shack 31,53155.3+6.9
Labor David Dale22,97840.3−5.7
Democrats Ron Murray2,5144.4+0.6
Total formal votes57,02394.1
Informal votes3,5575.9
Turnout 60,58095.0
Two-party-preferred result
Liberal Peter Shack 32,93457.8+7.6
Labor David Dale24,08942.2−7.6
Liberal hold Swing +7.6

1983

1983 Australian federal election: Tangney
PartyCandidateVotes%±%
Labor George Gear 34,89949.4+9.1
Liberal Peter Shack 31,81145.0−5.1
Democrats Ron Murray2,7063.8−5.9
Socialist Workers Bronwen Beachey1,2361.7+1.7
Total formal votes70,65298.2
Informal votes1,2561.8
Turnout 71,91794.0
Two-party-preferred result
Labor George Gear 53.2+7.8
Liberal Peter Shack 46.8−7.8
Labor gain from Liberal Swing +7.8

1980

1980 Australian federal election: Tangney
PartyCandidateVotes%±%
Liberal Peter Shack 32,59250.1−0.1
Labor Maureen Wong26,21640.3+8.6
Democrats Robert McCormack6,2889.7−4.8
Total formal votes65,09697.7
Informal votes1,5492.3
Turnout 66,64594.3
Two-party-preferred result
Liberal Peter Shack 54.6−5.3
Labor Maureen Wong45.4+5.3
Liberal hold Swing -5.3

Elections in the 1970s

1977

1977 Australian federal election: Tangney
PartyCandidateVotes%±%
Liberal Peter Shack 32,19848.7−7.7
Labor Duncan Graham21,94733.2−6.7
Democrats Geoffrey Taylor9,56114.5+14.5
Progress Geoffrey McNeil2,3613.6−0.2
Total formal votes66,06796.9
Informal votes2,1453.1
Turnout 68,21295.0
Two-party-preferred result
Liberal Peter Shack 58.4−0.2
Labor Duncan Graham41.6+0.2
Liberal hold Swing -0.2

1975

1975 Australian federal election: Tangney
PartyCandidateVotes%±%
Liberal Peter Richardson 34,67754.4+12.8
Labor John Dawkins 26,69741.9−8.7
Workers Warwick Agnew2,3953.8+3.8
Total formal votes63,76997.7
Informal votes1,5082.3
Turnout 65,27794.8
Two-party-preferred result
Liberal Peter Richardson 56.6+9.7
Labor John Dawkins 43.4−9.7
Liberal gain from Labor Swing +9.7

1974

1974 Australian federal election: Tangney
PartyCandidateVotes%±%
Labor John Dawkins 28,17650.6
Liberal Peter Whyte23,19641.6
National Alliance June Bunce3,4306.2
Australia Wendy Russell-Brown9001.6
Total formal votes55,70297.5
Informal votes1,4192.5
Turnout 57,12194.9
Two-party-preferred result
Labor John Dawkins 53.1+2.5
Liberal Peter Whyte46.9−2.5
Labor notional  hold Swing +2.5

Related Research Articles
<span class="mw-page-title-main">Division of Swan</span> Australian federal electoral division

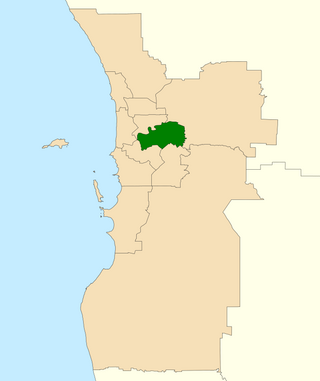
The Division of Swan is an Australian electoral division located in Western Australia.
<span class="mw-page-title-main">Division of Tangney</span> Australian federal electoral division

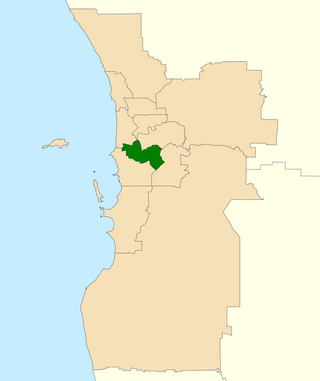
The Division of Tangney is an Australian electoral division in the state of Western Australia. The Division was named after Dame Dorothy Tangney, the first female member of the Australian Senate.

This article lists electoral results for the Division of Fremantle in Australian federal elections from the division's creation in 1901 to the present.

This is a list of electoral results for the Division of Aston in Australian federal elections from the division's creation in 1984 until the present.

This is a list of electoral results for the Division of Brand in Australian federal elections from the division's creation in 1984 until the present.

This is a list of electoral results for the Division of Cowan in Australian federal elections from the division's creation in 1984 until the present.

This is a list of electoral results for the Division of Curtin in Australian federal elections from the division's creation in 1949 until the present.

This is a list of electoral results for the Division of Forrest in Australian federal elections from the division's creation in 1922 until the present.

This is a list of electoral results for the Division of Hasluck in Australian federal elections from the division's creation in 2001 until the present.

This is a list of electoral results for the Division of Moore in Australian federal elections from the division's creation in 1949 until the present.

This is a list of electoral results for the Division of O'Connor in Australian federal elections from the division's creation in 1980 until the present.

This is a list of electoral results for the Division of Pearce in Australian federal elections from the division's creation in 1990 until the present.

This is a list of electoral results for the Division of Perth in Australian federal elections from the division's creation in 1901 until the present.

This is a list of electoral results for the Division of Stirling in Australian federal elections from the division's creation in 1955 until 2019. The division was abolished in 2022.

This is a list of electoral results for the Division of Swan in Australian federal elections from the division's creation in 1901 until the present.

This is a list of electoral results for the Division of Durack in Australian federal elections from the division's creation in 2010 until the present.

<span class="mw-page-title-main">Division of Burt</span> Australian federal electoral division

The Division of Burt is an Australian electoral division in Perth in the state of Western Australia.
<span class="mw-page-title-main">Results of the 2016 Australian federal election in Western Australia</span>

This is a list of electoral division results for the 2016 Australian federal election in the state of Western Australia.

<span class="mw-page-title-main">Results of the 2019 Australian federal election in Western Australia</span>

This is a list of electoral division results for the 2019 Australian federal election in the state of Western Australia.

<span class="mw-page-title-main">Results of the 2022 Australian federal election in Western Australia</span> Federal election results in Western Australia

The 2022 Australian federal election was held on 21 May 2022 to elect all 151 members of the Australian House of Representatives and 40 of 76 members of the Australian Senate. Of those, 15 MPs and 6 senators were elected to represent the state of Western Australia.

References

  1. Tangney, WA, 2022 Tally Room, Australian Electoral Commission.
  2. Tangney, WA, Tally Room 2019, Australian Electoral Commission.
  3. Tangney, WA, Virtual Tally Room 2016, Australian Electoral Commission.
  4. 2013 results for Tangney, AEC.
  5. "2010 results for Tangney". AEC.