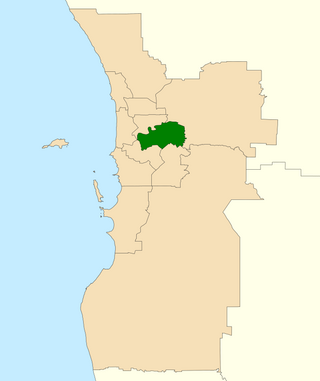
This is a list of electoral results for the Division of Hasluck in Australian federal elections from the division's creation in 2001 until the present.
Member | Party | Term | |
---|---|---|---|
Sharryn Jackson | Labor | 2001–2004 | |
Stuart Henry | Liberal | 2004–2007 | |
Sharryn Jackson | Labor | 2007–2010 | |
Ken Wyatt | Liberal | 2010–2022 | |
Tania Lawrence | Labor | 2022–present |
Party | Candidate | Votes | % | ±% | |
---|---|---|---|---|---|
Labor | Tania Lawrence | 39,144 | 39.73 | +9.41 | |
Liberal | Ken Wyatt | 32,889 | 33.39 | −10.59 | |
Greens | Brendan Sturcke | 10,826 | 10.99 | +0.24 | |
One Nation | Ian Monck | 3,783 | 3.84 | −2.29 | |
Independent | Jeanene Williams | 3,318 | 3.37 | +3.37 | |
United Australia | Will Scott | 2,973 | 3.02 | +0.79 | |
Western Australia | Pauline Clark | 2,561 | 2.60 | +1.00 | |
Australian Federation | Marijanna Smith | 1,739 | 1.77 | +1.77 | |
Liberal Democrats | Steven McCreanor | 1,280 | 1.30 | +1.30 | |
Total formal votes | 98,513 | 94.46 | +0.16 | ||
Informal votes | 5,782 | 5.54 | −0.16 | ||
Turnout | 104,295 | 88.74 | −0.50 | ||
Two-party-preferred result | |||||
Labor | Tania Lawrence | 55,166 | 56.00 | +11.89 | |
Liberal | Ken Wyatt | 43,347 | 44.00 | −11.89 | |
Labor gain from Liberal | Swing | +11.89 |
Party | Candidate | Votes | % | ±% | |
---|---|---|---|---|---|
Liberal | Ken Wyatt | 36,737 | 43.62 | −1.33 | |
Labor | James Martin | 25,794 | 30.63 | −4.63 | |
Greens | Lee-Anne Miles | 9,648 | 11.46 | −1.20 | |
One Nation | Tim Orr | 4,445 | 5.28 | +5.28 | |
Shooters, Fishers, Farmers | Fiona White-Hartig | 2,441 | 2.90 | +2.90 | |
United Australia | Mike Dale | 1,929 | 2.29 | +2.29 | |
Christians | Brady Williams | 1,678 | 1.99 | −1.45 | |
Western Australia | Stephen Phelan | 1,546 | 1.84 | +1.84 | |
Total formal votes | 84,218 | 94.52 | −1.44 | ||
Informal votes | 4,880 | 5.48 | +1.44 | ||
Turnout | 89,098 | 90.34 | +1.52 | ||
Two-party-preferred result | |||||
Liberal | Ken Wyatt | 46,494 | 55.21 | +3.16 | |
Labor | James Martin | 37,724 | 44.79 | −3.16 | |
Liberal hold | Swing | +3.16 |
Party | Candidate | Votes | % | ±% | |
---|---|---|---|---|---|
Liberal | Ken Wyatt | 36,519 | 44.95 | −1.18 | |
Labor | Bill Leadbetter | 28,652 | 35.26 | +5.78 | |
Greens | Patrick Hyslop | 10,283 | 12.66 | +2.35 | |
Rise Up Australia | Henry Barnard | 2,999 | 3.69 | +3.34 | |
Christians | Phil Twiss | 2,798 | 3.44 | +1.19 | |
Total formal votes | 81,251 | 95.96 | +1.53 | ||
Informal votes | 3,425 | 4.04 | −1.53 | ||
Turnout | 84,676 | 88.82 | −3.02 | ||
Two-party-preferred result | |||||
Liberal | Ken Wyatt | 42,294 | 52.05 | −3.97 | |
Labor | Bill Leadbetter | 38,957 | 47.95 | +3.97 | |
Liberal hold | Swing | −3.97 |
Party | Candidate | Votes | % | ±% | |
---|---|---|---|---|---|
Liberal | Ken Wyatt | 38,951 | 45.42 | +3.43 | |
Labor | Adrian Evans | 28,081 | 32.74 | −4.79 | |
Greens | Peter Langlands | 6,546 | 7.63 | −5.15 | |
Palmer United | Robin Scott | 5,885 | 6.86 | +6.86 | |
Sex Party | Chris Munro | 2,236 | 2.61 | +2.61 | |
Christians | Jason Whittaker | 2,130 | 2.48 | +2.48 | |
Family First | Kyran Sharrin | 1,365 | 1.59 | −0.67 | |
Katter's Australian | Daniel Stevens | 569 | 0.66 | +0.66 | |
Total formal votes | 85,763 | 94.32 | −0.04 | ||
Informal votes | 5,163 | 5.68 | +0.04 | ||
Turnout | 90,926 | 92.34 | −0.73 | ||
Two-party-preferred result | |||||
Liberal | Ken Wyatt | 47,057 | 54.87 | +4.30 | |
Labor | Adrian Evans | 38,706 | 45.13 | −4.30 | |
Liberal hold | Swing | +4.30 |
Party | Candidate | Votes | % | ±% | |
---|---|---|---|---|---|
Liberal | Ken Wyatt | 34,638 | 41.99 | −1.38 | |
Labor | Sharryn Jackson | 30,957 | 37.53 | −3.82 | |
Greens | Glenice Smith | 10,539 | 12.78 | +4.47 | |
Christian Democrats | Linda Brewer | 2,505 | 3.04 | +0.04 | |
Family First | Jim McCourt | 1,861 | 2.26 | +1.03 | |
Ecology, Social Justice, Aboriginal | Dot Henry | 1,457 | 1.77 | +1.77 | |
Climate Sceptics | Andrew Middleton | 539 | 0.65 | +0.65 | |
Total formal votes | 82,496 | 94.36 | −1.31 | ||
Informal votes | 4,927 | 5.64 | +1.31 | ||
Turnout | 87,423 | 93.11 | −0.56 | ||
Two-party-preferred result | |||||
Liberal | Ken Wyatt | 41,722 | 50.57 | +1.42 | |
Labor | Sharryn Jackson | 40,774 | 49.43 | −1.42 | |
Liberal gain from Labor | Swing | +1.42 |
Party | Candidate | Votes | % | ±% | |
---|---|---|---|---|---|
Liberal | Stuart Henry | 31,541 | 42.94 | −2.43 | |
Labor | Sharryn Jackson | 30,471 | 41.48 | +3.19 | |
Greens | Jane Bremmer | 6,258 | 8.52 | +1.66 | |
Christian Democrats | Rob Merrells | 2,229 | 3.03 | −0.07 | |
One Nation | Bill Gaugg | 1,121 | 1.53 | −1.84 | |
Family First | Stephen Bolt | 863 | 1.17 | +1.17 | |
Citizens Electoral Council | Neil Vincent | 687 | 0.94 | −0.34 | |
Liberty & Democracy | Siou Hong Chia | 292 | 0.40 | +0.40 | |
Total formal votes | 73,462 | 95.58 | +0.56 | ||
Informal votes | 3,397 | 4.42 | −0.56 | ||
Turnout | 76,859 | 93.35 | −0.14 | ||
Two-party-preferred result | |||||
Labor | Sharryn Jackson | 37,658 | 51.26 | +3.08 | |
Liberal | Stuart Henry | 35,805 | 48.74 | −3.08 | |
Labor gain from Liberal | Swing | +3.08 | |||
Party | Candidate | Votes | % | ±% | |
---|---|---|---|---|---|
Liberal | Stuart Henry | 32,457 | 45.37 | +6.04 | |
Labor | Sharryn Jackson | 27,395 | 38.29 | +0.06 | |
Greens | Jane Bremmer | 4,911 | 6.86 | +1.19 | |
One Nation | Paul Nield | 2,413 | 3.37 | −3.63 | |
Christian Democrats | Terry Ryan | 2,221 | 3.10 | +0.69 | |
Democrats | Nicola Hannah | 1,236 | 1.73 | −3.18 | |
Citizens Electoral Council | Simon Hall | 913 | 1.28 | +0.14 | |
Total formal votes | 71,546 | 95.02 | +0.82 | ||
Informal votes | 3,752 | 4.98 | −0.82 | ||
Turnout | 75,298 | 93.49 | −1.72 | ||
Two-party-preferred result | |||||
Liberal | Stuart Henry | 37,078 | 51.82 | +3.60 | |
Labor | Sharryn Jackson | 34,468 | 48.18 | −3.60 | |
Liberal gain from Labor | Swing | +3.60 | |||
Party | Candidate | Votes | % | ±% | |
---|---|---|---|---|---|
Liberal | Bethwyn Chan | 27,660 | 39.33 | +2.49 | |
Labor | Sharryn Jackson | 26,890 | 38.23 | −1.15 | |
One Nation | James Hopkinson | 4,920 | 7.00 | −4.72 | |
Greens | Luke Edmonds | 3,986 | 5.67 | +0.86 | |
Democrats | Peter Markham | 3,455 | 4.91 | +0.08 | |
Christian Democrats | Terry Ryan | 1,695 | 2.41 | +1.37 | |
Citizens Electoral Council | Ronnie McLean | 804 | 1.14 | +0.89 | |
Curtin Labor Alliance | Michael Daniels | 520 | 0.74 | +0.74 | |
National | Ros Hegarty | 401 | 0.57 | +0.24 | |
Total formal votes | 70,331 | 94.20 | −1.43 | ||
Informal votes | 4,334 | 5.80 | +1.43 | ||
Turnout | 74,665 | 95.75 | |||
Two-party-preferred result | |||||
Labor | Sharryn Jackson | 36,420 | 51.78 | −0.77 | |
Liberal | Bethwyn Chan | 33,911 | 48.22 | +0.77 | |
Labor notional hold | Swing | -0.77 | |||
The Division of Swan is an Australian electoral division located in Western Australia.
The Division of Cowan is an Australian Electoral Division in Western Australia.
The Division of Curtin is an Australian electoral division in Western Australia.
The Division of Hasluck is an electoral division of the Australian House of Representatives, located in Western Australia.
This article lists electoral results for the Division of Fremantle in Australian federal elections from the division's creation in 1901 to the present.
This is a list of electoral results for the Division of Brand in Australian federal elections from the division's creation in 1984 until the present.
This is a list of electoral results for the Division of Cowan in Australian federal elections from the division's creation in 1984 until the present.
This is a list of electoral results for the Division of Curtin in Australian federal elections from the division's creation in 1949 until the present.
This is a list of electoral results for the Division of Forrest in Australian federal elections from the division's creation in 1922 until the present.
This is a list of electoral results for the Division of Moore in Australian federal elections from the division's creation in 1949 until the present.
This is a list of electoral results for the Division of O'Connor in Australian federal elections from the division's creation in 1980 until the present.
This is a list of electoral results for the Division of Pearce in Australian federal elections from the division's creation in 1990 until the present.
This is a list of electoral results for the Division of Perth in Australian federal elections from the division's creation in 1901 until the present.
This is a list of electoral results for the Division of Stirling in Australian federal elections from the division's creation in 1955 until 2019. The division was abolished in 2022.
This is a list of electoral results for the Division of Swan in Australian federal elections from the division's creation in 1901 until the present.
This is a list of electoral results for the Division of Tangney in Australian federal elections from the division's creation in 1974 until the present.
This is a list of electoral results for the Division of Durack in Australian federal elections from the division's creation in 2010 until the present.
This is a list of electoral division results for the 2016 Australian federal election in the state of Western Australia.
This is a list of electoral division results for the 2019 Australian federal election in the state of Western Australia.
The 2022 Australian federal election was held on 21 May 2022 to elect all 151 members of the Australian House of Representatives and 40 of 76 members of the Australian Senate. Of those, 15 MPs and 6 senators were elected to represent the state of Western Australia.