This is a list of electoral results for the Division of East Sydney in Australian federal elections from the division's creation in 1901 until its abolition in 1969.
Member | Party | Term | |
---|---|---|---|
George Reid | Free Trade, Anti-Socialist | 1901–1909 | |
Commonwealth Liberal | 1909–1910 | ||
John West | Labor | 1910–1931 | |
Eddie Ward | Labor (NSW) | 1931–1931 | |
John Clasby | United Australia | 1931–1932 | |
Eddie Ward | Labor (NSW) | 1932–1936 | |
Labor | 1936–1963 | ||
Len Devine | Labor | 1963–1969 |
Party | Candidate | Votes | % | ±% | |
---|---|---|---|---|---|
Labor | Len Devine | 15,004 | 52.9 | -8.3 | |
Liberal | William Berman | 10,636 | 37.5 | +4.4 | |
Democratic Labor | Mel Antcliff | 1,807 | 6.4 | +6.4 | |
Communist | Bill Brown | 940 | 3.3 | -2.4 | |
Total formal votes | 28,387 | 94.3 | |||
Informal votes | 1,731 | 5.7 | |||
Turnout | 30,118 | 90.3 | |||
Two-party-preferred result | |||||
Labor | Len Devine | 57.0 | -9.4 | ||
Liberal | William Berman | 43.0 | +9.4 | ||
Labor hold | Swing | -9.4 | |||
Party | Candidate | Votes | % | ±% | |
---|---|---|---|---|---|
Labor | Len Devine | 19,779 | 61.2 | -6.6 | |
Liberal | William Foster | 10,711 | 33.1 | +11.1 | |
Communist | Bill Brown | 1,827 | 5.7 | +2.5 | |
Total formal votes | 32,317 | 97.3 | |||
Informal votes | 885 | 2.7 | |||
Turnout | 33,202 | 91.8 | |||
Two-party-preferred result | |||||
Labor | Len Devine | 66.4 | -5.5 | ||
Liberal | William Foster | 33.6 | +5.5 | ||
Labor hold | Swing | -5.5 | |||
Party | Candidate | Votes | % | ±% | |
---|---|---|---|---|---|
Labor | Len Devine | 19,704 | 80.7 | +12.9 | |
Independent Liberal | Vernon Luckman | 2,233 | 9.1 | +9.1 | |
Independent | Leslie Bond | 1,224 | 5.0 | +5.0 | |
Property Owners | Hazen Cook | 699 | 2.9 | +2.9 | |
Republican | John Phillips | 546 | 2.2 | +2.2 | |
Total formal votes | 24,406 | 94.9 | |||
Informal votes | 1,305 | 5.1 | |||
Turnout | 25,711 | 71.9 | |||
Two-party-preferred result | |||||
Labor | Len Devine | 85.1 | +13.2 | ||
Independent Liberal | Vernon Luckman | 14.9 | +14.9 | ||
Labor hold | Swing | +13.2 | |||
Party | Candidate | Votes | % | ±% | |
---|---|---|---|---|---|
Labor | Eddie Ward | 21,999 | 67.8 | +4.6 | |
Liberal | John Folbigg | 7,137 | 22.0 | -0.8 | |
Democratic Labor | Joseph Bergin | 2,276 | 7.0 | +0.6 | |
Communist | Bill Brown | 1,030 | 3.2 | -4.4 | |
Total formal votes | 32,442 | 96.3 | |||
Informal votes | 1,247 | 3.7 | |||
Turnout | 33,689 | 91.9 | |||
Two-party-preferred result | |||||
Labor | Eddie Ward | 71.9 | +1.5 | ||
Liberal | John Folbigg | 28.1 | -1.5 | ||
Labor hold | Swing | +1.5 | |||
Party | Candidate | Votes | % | ±% | |
---|---|---|---|---|---|
Labor | Eddie Ward | 22,377 | 63.2 | -0.4 | |
Liberal | Derek Montefiore-Castle | 8,059 | 22.8 | -5.2 | |
Communist | Eddie Maher | 2,703 | 7.6 | -0.7 | |
Democratic Labor | Mervyn Reid | 2,283 | 6.4 | +6.4 | |
Total formal votes | 35,422 | 95.6 | |||
Informal votes | 1,633 | 4.4 | |||
Turnout | 37,055 | 91.3 | |||
Two-party-preferred result | |||||
Labor | Eddie Ward | 70.4 | +0.2 | ||
Liberal | Derek Montefiore-Castle | 29.6 | -0.2 | ||
Labor hold | Swing | +0.2 | |||
Party | Candidate | Votes | % | ±% | |
---|---|---|---|---|---|
Labor | Eddie Ward | 24,859 | 63.6 | -3.4 | |
Liberal | Joseph Landor | 10,953 | 28.0 | -0.4 | |
Communist | Bill Brown | 3,251 | 8.3 | +3.7 | |
Total formal votes | 39,063 | 96.0 | |||
Informal votes | 1,642 | 4.0 | |||
Turnout | 40,705 | 92.2 | |||
Two-party-preferred result | |||||
Labor | Eddie Ward | 70.2 | -0.9 | ||
Liberal | Joseph Landor | 29.8 | +0.9 | ||
Labor hold | Swing | -0.9 | |||
Party | Candidate | Votes | % | ±% | |
---|---|---|---|---|---|
Labor | Eddie Ward | 19,282 | 58.0 | +3.1 | |
Liberal | George Chambers | 12,068 | 36.3 | -8.8 | |
Communist | Bill Brown | 1,904 | 5.7 | +5.7 | |
Total formal votes | 33,254 | 98.2 | |||
Informal votes | 600 | 1.8 | |||
Turnout | 33,854 | 94.8 | |||
Two-party-preferred result | |||||
Labor | Eddie Ward | 62.2 | +7.3 | ||
Liberal | George Chambers | 37.8 | -7.3 | ||
Labor hold | Swing | +7.3 | |||
Party | Candidate | Votes | % | ±% | |
---|---|---|---|---|---|
Labor | Eddie Ward | 20,379 | 54.9 | -2.1 | |
Liberal | Allan Stewart | 16,767 | 45.1 | +6.1 | |
Total formal votes | 37,146 | 97.5 | |||
Informal votes | 961 | 2.5 | |||
Turnout | 38,107 | 94.2 | |||
Labor hold | Swing | -3.1 | |||
Party | Candidate | Votes | % | ±% | |
---|---|---|---|---|---|
Labor | Eddie Ward | 22,496 | 57.0 | -4.8 | |
Liberal | John Mant | 15,398 | 39.0 | +5.9 | |
Independent | William Dalton | 1,552 | 3.9 | +3.9 | |
Total formal votes | 39,446 | 97.5 | |||
Informal votes | 1,015 | 2.5 | |||
Turnout | 40,461 | 95.5 | |||
Two-party-preferred result | |||||
Labor | Eddie Ward | 58.0 | -6.3 | ||
Liberal | John Mant | 42.0 | +6.3 | ||
Labor hold | Swing | -6.3 | |||
Party | Candidate | Votes | % | ±% | |
---|---|---|---|---|---|
Labor | Eddie Ward | 37,863 | 65.5 | -3.5 | |
Liberal | Ivan Dougherty | 16,348 | 28.3 | +4.8 | |
Protestant People | Wal Campbell | 3,578 | 6.2 | +6.2 | |
Total formal votes | 57,789 | 97.1 | |||
Informal votes | 1,716 | 2.9 | |||
Turnout | 59,505 | 92.0 | |||
Two-party-preferred result | |||||
Labor | Eddie Ward | 67.6 | -3.4 | ||
Liberal | Ivan Dougherty | 32.4 | +3.4 | ||
Labor hold | Swing | -3.4 | |||
Party | Candidate | Votes | % | ±% | |
---|---|---|---|---|---|
Labor | Eddie Ward | 36,531 | 69.0 | +19.9 | |
United Australia | Vincent Brady | 12,430 | 23.5 | -7.0 | |
Liberal Democratic | Hugh Angrave | 2,377 | 4.5 | +4.5 | |
One Parliament | Ernest Carr | 1,141 | 2.2 | +2.2 | |
Independent | Arthur Shirley | 494 | 0.9 | +0.9 | |
Total formal votes | 52,973 | 96.4 | |||
Informal votes | 1,967 | 3.6 | |||
Turnout | 54,940 | 94.8 | |||
Two-party-preferred result | |||||
Labor | Eddie Ward | 71.0 | +4.9 | ||
United Australia | Vincent Brady | 29.0 | -4.9 | ||
Labor hold | Swing | +4.9 | |||
Party | Candidate | Votes | % | ±% | |
---|---|---|---|---|---|
Labor | Eddie Ward | 23,685 | 49.1 | -6.9 | |
United Australia | Lewis Nott | 12,211 | 25.3 | -9.7 | |
Labor (N-C) | Steve Gould | 5,547 | 11.5 | +11.5 | |
United Australia | James Catts | 2,508 | 5.2 | +5.2 | |
Independent | Fred Aarons | 2,264 | 4.7 | +4.7 | |
Independent | Diana Gould | 1,867 | 3.9 | +3.9 | |
Atokist | Louis Phillips | 187 | 0.4 | +0.4 | |
Total formal votes | 48,269 | 95.3 | |||
Informal votes | 2,386 | 4.7 | |||
Turnout | 50,655 | 90.5 | |||
Two-party-preferred result | |||||
Labor | Eddie Ward | 66.1 | +8.1 | ||
United Australia | Lewis Nott | 33.9 | -8.1 | ||
Labor hold | Swing | +8.1 | |||
Party | Candidate | Votes | % | ±% | |
---|---|---|---|---|---|
Labor | Eddie Ward | 28,484 | 56.0 | +51.3 | |
United Australia | Arthur Butterell | 20,429 | 40.2 | -2.1 | |
Independent | Thomas Grant | 1,603 | 3.2 | +3.2 | |
Independent | Louis Phillips | 348 | 0.7 | +0.7 | |
Total formal votes | 50,864 | 97.0 | |||
Informal votes | 1,587 | 3.0 | |||
Turnout | 52,451 | 93.7 | |||
Two-party-preferred result | |||||
Labor | Eddie Ward | 58.0 | +58.0 | ||
United Australia | Arthur Butterell | 42.0 | -2.1 | ||
Labor gain from Labor (NSW) | Swing | +2.1 |
Party | Candidate | Votes | % | ±% | |
---|---|---|---|---|---|
Labor (NSW) | Eddie Ward | 25,567 | 49.9 | +3.9 | |
United Australia | Arthur Butterell | 21,686 | 42.3 | +1.2 | |
Labor | George Laughlan | 2,400 | 4.7 | -8.2 | |
Communist | Bill McDougall | 1,592 | 3.1 | +3.1 | |
Total formal votes | 51,245 | 96.1 | |||
Informal votes | 2,070 | 3.9 | |||
Turnout | 53,315 | 92.0 | |||
Two-party-preferred result | |||||
Labor (NSW) | Eddie Ward | 55.9 | +0.2 | ||
United Australia | Arthur Butterell | 44.1 | -0.2 | ||
Labor (NSW) hold | Swing | +0.2 | |||
Party | Candidate | Votes | % | ±% | |
---|---|---|---|---|---|
Labor (NSW) | Eddie Ward | 17,461 | 47.0 | +4.6 | |
United Australia | William McCall | 16,304 | 43.9 | -0.3 | |
Labor | Lou Cunningham | 2,817 | 7.6 | -5.7 | |
Communist | Jack Miles | 597 | 1.6 | +1.6 | |
Total formal votes | 37,179 | 97.3 | |||
Informal votes | 1,018 | 2.7 | |||
Turnout | 38,197 | 85.6 | |||
Two-party-preferred result | |||||
Labor (NSW) | Eddie Ward | 18,676 | 50.2 | +1.9 | |
United Australia | William McCall | 18,503 | 49.8 | -1.9 | |
Labor (NSW) gain from United Australia | Swing | +1.9 |
Party | Candidate | Votes | % | ±% | |
---|---|---|---|---|---|
United Australia | John Clasby | 16,977 | 44.2 | +12.6 | |
Labor (NSW) | Eddie Ward | 16,291 | 42.4 | +42.4 | |
Labor | George Buckland | 5,112 | 13.3 | -55.1 | |
Total formal votes | 38,380 | 96.2 | |||
Informal votes | 1,514 | 3.8 | |||
Turnout | 39,894 | 91.7 | |||
Two-party-preferred result | |||||
United Australia | John Clasby | 19,831 | 51.7 | +11.7 | |
Labor (NSW) | Eddie Ward | 18,549 | 48.3 | -11.7 | |
United Australia gain from Labor | Swing | +11.7 |
Party | Candidate | Votes | % | ±% | |
---|---|---|---|---|---|
Labor | Eddie Ward | 19,975 | 54.1 | -14.3 | |
Nationalist | Lionel Courtenay | 16,333 | 44.2 | +12.6 | |
Communist | Bill Mountjoy | 611 | 1.7 | +1.7 | |
Total formal votes | 36,919 | 97.2 | |||
Informal votes | 1,068 | 2.8 | |||
Turnout | 37,987 | 81.3 | |||
Two-party-preferred result | |||||
Labor | Eddie Ward | 55.7 | -14.3 | ||
Nationalist | Lionel Courtenay | 44.3 | +14.3 | ||
Labor hold | Swing | -14.3 | |||
Party | Candidate | Votes | % | ±% | |
---|---|---|---|---|---|
Labor | John West | 25,105 | 68.4 | +10.0 | |
Nationalist | Hyman Diamond | 11,583 | 31.6 | -10.0 | |
Total formal votes | 36,688 | 96.2 | |||
Informal votes | 1,451 | 3.8 | |||
Turnout | 38,139 | 89.1 | |||
Labor hold | Swing | +10.0 | |||
Party | Candidate | Votes | % | ±% | |
---|---|---|---|---|---|
Labor | John West | 19,651 | 58.4 | +4.6 | |
Nationalist | Julian Simpson | 13,994 | 41.6 | -4.6 | |
Total formal votes | 33,645 | 94.8 | |||
Informal votes | 1,852 | 5.2 | |||
Turnout | 35,497 | 87.9 | |||
Labor hold | Swing | +4.6 | |||
Party | Candidate | Votes | % | ±% | |
---|---|---|---|---|---|
Labor | John West | 18,822 | 53.8 | -5.3 | |
Nationalist | Richard Orchard | 16,169 | 46.2 | +5.3 | |
Total formal votes | 34,991 | 98.0 | |||
Informal votes | 729 | 2.0 | |||
Turnout | 35,720 | 85.6 | |||
Labor hold | Swing | -5.3 | |||
Party | Candidate | Votes | % | ±% | |
---|---|---|---|---|---|
Labor | John West | 10,885 | 59.1 | +1.3 | |
Nationalist | Sir Benjamin Fuller | 7,518 | 40.9 | -1.3 | |
Total formal votes | 18,403 | 95.8 | |||
Informal votes | 801 | 4.2 | |||
Turnout | 19,204 | 47.3 | |||
Labor hold | Swing | +1.3 | |||
Party | Candidate | Votes | % | ±% | |
---|---|---|---|---|---|
Labor | John West | 12,751 | 57.8 | -42.2 | |
Nationalist | John Willson | 9,327 | 42.2 | +42.2 | |
Total formal votes | 22,078 | 97.3 | |||
Informal votes | 617 | 2.7 | |||
Turnout | 22,695 | 58.1 | |||
Labor hold | Swing | -42.2 | |||
Party | Candidate | Votes | % | ±% | |
---|---|---|---|---|---|
Labor | John West | unopposed | |||
Labor hold | Swing | ||||
Party | Candidate | Votes | % | ±% | |
---|---|---|---|---|---|
Labor | John West | 12,831 | 57.3 | +1.2 | |
Liberal | Lindsay Thompson | 9,568 | 42.7 | -1.2 | |
Total formal votes | 22,399 | 96.8 | |||
Informal votes | 736 | 3.2 | |||
Turnout | 23,135 | 51.1 | |||
Labor hold | Swing | +1.2 | |||
Party | Candidate | Votes | % | ±% | |
---|---|---|---|---|---|
Labor | John West | 14,174 | 56.1 | -0.1 | |
Liberal | John Willson | 11,077 | 43.9 | +0.1 | |
Total formal votes | 25,251 | 97.2 | |||
Informal votes | 733 | 2.8 | |||
Turnout | 25,984 | 58.0 | |||
Labor hold | Swing | -0.1 | |||
Party | Candidate | Votes | % | ±% | |
---|---|---|---|---|---|
Labour | John West | 10,487 | 57.1 | +12.0 | |
Liberal | Samuel Lees | 7,890 | 42.9 | -12.0 | |
Total formal votes | 18,377 | 99.0 | |||
Informal votes | 181 | 1.0 | |||
Turnout | 18,558 | 58.9 | |||
Labour gain from Liberal | Swing | +12.0 |
Party | Candidate | Votes | % | ±% | |
---|---|---|---|---|---|
Anti-Socialist | George Reid | 7,229 | 54.9 | -6.4 | |
Labour | John West | 5,936 | 45.1 | +12.5 | |
Total formal votes | 13,165 | 98.0 | |||
Informal votes | 275 | 2.0 | |||
Turnout | 13,440 | 49.0 | |||
Anti-Socialist hold | Swing | -9.5 | |||
Party | Candidate | Votes | % | ±% | |
---|---|---|---|---|---|
Free Trade | George Reid | 8,103 | 61.3 | -6.7 | |
Labour | Thomas Thrower | 4,308 | 32.6 | +32.6 | |
Protectionist | Robert Peel | 799 | 6.1 | +6.1 | |
Total formal votes | 13,210 | 97.3 | |||
Informal votes | 362 | 2.7 | |||
Turnout | 13,572 | 38.8 | |||
Free Trade hold | Swing | -7.9 | |||
Party | Candidate | Votes | % | ±% | |
---|---|---|---|---|---|
Free Trade | George Reid | 1,697 | 82.7 | +20.7 | |
Protectionist | William Maguire | 259 | 12.6 | +12.6 | |
Independent | John Blake | 96 | 4.7 | +4.7 | |
Total formal votes | 2,052 | ||||
Free Trade hold | Swing | +20.7 | |||
Party | Candidate | Votes | % | ±% | |
---|---|---|---|---|---|
Free Trade | George Reid | 6,191 | 68.0 | +68.0 | |
Ind. Protectionist | Harry Foran | 2,139 | 23.5 | +23.5 | |
Ind. Protectionist | John Cleary | 517 | 5.7 | +5.7 | |
Independent | James Toomey | 253 | 2.8 | +2.8 | |
Total formal votes | 9,100 | 96.7 | |||
Informal votes | 313 | 3.3 | |||
Turnout | 9,413 | 61.7 | |||
Free Trade win | (new seat) | ||||
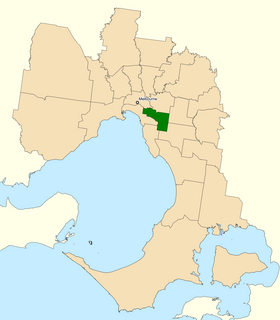
The Division of Higgins is an Australian Electoral Division in Victoria for the Australian House of Representatives. The division covers 41 km2 (16 sq mi) in Melbourne's south-eastern suburbs. The main suburbs include Armadale, Ashburton, Carnegie, Glen Iris, Kooyong, Malvern, Malvern East, Murrumbeena, Prahran and Toorak; along with parts of Camberwell, Ormond and South Yarra. Though historically a safe conservative seat, Higgins was won by the Liberal Party by a margin of just 3.9 percent over the Labor Party at the 2019 election, the closest result in the seat’s history.
In Australia, electoral districts for the Australian House of Representatives are called divisions or more commonly referred to as electorates or seats. There are currently 151 single-member electorates for the Australian House of Representatives.
The Division of Corangamite is an Australian electoral division in the state of Victoria. The division was proclaimed in 1900, and was one of the original 65 divisions to be contested at the first federal election. It is named for Lake Corangamite, although the lake no longer falls within the division's boundaries.
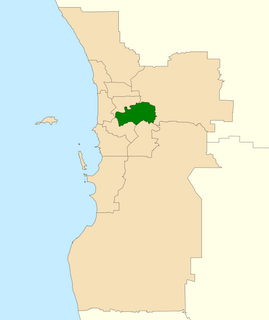
The Division of Swan is an Australian electoral division located in Western Australia.
The Division of Ballarat is an Australian electoral division in the state of Victoria. The division was proclaimed in 1900, and was one of the original 65 divisions to be contested at the first federal election. It was named for the provincial city of the same name by Scottish squatter Archibald Yuille, who established the first settlement − his sheep run called Ballaarat − in 1837, with the name derived from a local Wathawurrung word for the area, balla arat, thought to mean "resting place".
The Division of Batman was an Australian Electoral Division in the state of Victoria. It took its name from John Batman, one of the founders of the city of Melbourne. The division was created in 1906, replacing the Division of Northern Melbourne, and was abolished in 2019 and replaced by the Division of Cooper.
The Division of Bendigo is an Australian electoral division in the state of Victoria. The division was proclaimed in 1900, and was one of the original 65 divisions to be contested at the first federal election. It is named for the city of Bendigo.
The Division of Braddon is an Australian electoral division in the state of Tasmania. The current MP is Gavin Pearce of the Liberal Party, who was elected at the 2019 federal election.
The Division of Maranoa is an Australian electoral division in Queensland.
The Division of Indi is an Australian electoral division in the state of Victoria. The division is located in the north-east of the state, adjoining the border with New South Wales. The largest settlements in the division are the regional cities of Wodonga, Wangaratta, and Benalla. Other towns in the electorate include Rutherglen, Mansfield, Beechworth, Myrtleford, Bright, Alexandra, Tallangatta, Corryong and a number of other small villages. While Indi is one of the largest electorates in Victoria, much of it is located within the largely uninhabited Australian Alps. While Wodonga serves as a regional hub for much of the more heavily populated northern part of the electorate, the southern part is closer to Melbourne than Wodonga.
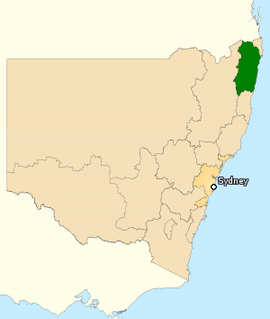
The Division of Page is an Australian electoral division in the state of New South Wales.
The Australian People's Party was a registered political party in Australia. It was registered by the Australian Electoral Commission in March 2017. It was formed in 2014. The party recruited enough members to gain registration in March 2017. The party says its aim is to improve standards of living and rights for all Australians through commonsense policies. The party describes itself as a centrist party. The party was de-registered in November 2021 by the Australian Electoral Commission for not having 500 members.
In Australia, a redistribution is the process of redrawing the boundaries of electoral divisions for the House of Representatives arising from changes in population and changes in the number of representatives. There is no redistribution for the Senate as each State constitutes a division, though with multiple members. The Australian Electoral Commission (AEC), an independent statutory authority, oversees the apportionment and redistribution process for federal divisions, taking into account a number of factors. Politicians, political parties and the public may make submissions to the AEC on proposed new boundaries, but any interference with their deliberations is considered a serious offence.
This is a list of electoral results for the Division of Banks in Australian federal elections from the division's creation in 1949 until the present.
This is a list of electoral results for the Division of New England in Australian federal elections from the division's creation in 1901 until the present.
The 2019 Australian federal election was held on Saturday 18 May 2019 to elect members of the 46th Parliament of Australia. The election had been called following the dissolution of the 45th Parliament as elected at the 2016 double dissolution federal election. All 151 seats in the House of Representatives and 40 of the 76 seats in the Senate were up for election.
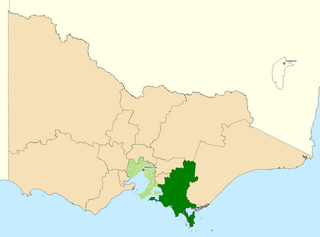
The Division of Monash is an Australian Electoral Division in the state of Victoria, which was contested for the first time at the 2019 federal election.
The Division of Cooper is an Australian Electoral Division in the state of Victoria. It takes in the northern suburbs of Melbourne. The division was contested for the first time at the 2019 federal election, with Ged Kearney of the Australian Labor Party (ALP) elected as its inaugural member of parliament. She had previously represented the Division of Batman since the 2018 by-election.
The Division of Fraser is an Australian electoral division in the state of Victoria, which was contested for the first time at the 2019 federal election.
The 2022 Australian federal election will be held on or before 21 May 2022 to elect members of the 47th Parliament of Australia.