This is a list of electoral division results for the Australian 1937 federal election.
Party | Candidate | Votes | % | ±% | |
---|---|---|---|---|---|
United Australia | Albert Lane | 28,342 | 49.3 | +2.9 | |
Labor | John Donovan | 23,539 | 41.0 | +41.0 | |
Social Credit | Stanley Allen | 5,562 | 9.7 | −1.4 | |
Total formal votes | 57,443 | 97.9 | |||
Informal votes | 1,254 | 2.1 | |||
Turnout | 58,697 | 98.0 | |||
Two-party-preferred result | |||||
United Australia | Albert Lane | 29,780 | 51.8 | +0.4 | |
Labor | John Donovan | 27,663 | 48.2 | −0.4 | |
United Australia hold | Swing | +0.4 | |||
Party | Candidate | Votes | % | ±% | |
---|---|---|---|---|---|
Country | Harold Thorby | 26,378 | 52.2 | +17.0 | |
Labor | William Folster | 24,114 | 47.8 | +41.5 | |
Total formal votes | 50,492 | 98.2 | |||
Informal votes | 921 | 1.8 | |||
Turnout | 51.413 | 96.5 | |||
Country hold | Swing | −1.8 | |||
Party | Candidate | Votes | % | ±% | |
---|---|---|---|---|---|
Labor | Tom Sheehan | 38,201 | 70.3 | +45.2 | |
Independent Labor | Cyril Glassop | 16,125 | 29.7 | +29.7 | |
Total formal votes | 56,642 | 95.9 | |||
Informal votes | 2,316 | 4.1 | |||
Turnout | 56,642 | 97.0 | |||
Labor gain from Labor (NSW) | Swing | +78.6 |
Party | Candidate | Votes | % | ±% | |
---|---|---|---|---|---|
Country | Earle Page | 32,000 | 63.2 | −1.0 | |
Labor | Abraham Brindley | 18,646 | 36.8 | +36.8 | |
Total formal votes | 50,646 | 98.3 | |||
Informal votes | 888 | 1.7 | |||
Turnout | 51,534 | 95.9 | |||
Country hold | Swing | −7.2 | |||
Party | Candidate | Votes | % | ±% | |
---|---|---|---|---|---|
Labor | Sol Rosevear | 32,646 | 57.7 | +51.0 | |
United Australia | Arthur Brough | 23,961 | 42.3 | +4.0 | |
Total formal votes | 56,607 | 97.7 | |||
Informal votes | 1,305 | 2.3 | |||
Turnout | 57,912 | 96.9 | |||
Labor gain from Labor (NSW) | Swing | −0.1 |
Party | Candidate | Votes | % | ±% | |
---|---|---|---|---|---|
Labor | Joe Clark | 32,515 | 66.2 | +37.6 | |
Independent | Alexander Huie | 16,581 | 33.8 | +33.8 | |
Total formal votes | 49,096 | 97.3 | |||
Informal votes | 1,347 | 2.7 | |||
Turnout | 50,443 | 94.6 | |||
Labor gain from Labor (NSW) | Swing | +66.2 |
Party | Candidate | Votes | % | ±% | |
---|---|---|---|---|---|
Labor | Eddie Ward | 28,484 | 56.0 | +51.3 | |
United Australia | Arthur Butterell | 20,429 | 40.2 | -2.1 | |
Independent | Thomas Grant | 1,603 | 3.2 | +3.2 | |
Independent | Louis Phillips | 348 | 0.7 | +0.7 | |
Total formal votes | 50,864 | 97.0 | |||
Informal votes | 1,587 | 3.0 | |||
Turnout | 52,451 | 93.7 | |||
Two-party-preferred result | |||||
Labor | Eddie Ward | 58.0 | +58.0 | ||
United Australia | Arthur Butterell | 42.0 | -2.1 | ||
Labor gain from Labor (NSW) | Swing | +2.1 |
Party | Candidate | Votes | % | ±% | |
---|---|---|---|---|---|
United Australia | John Perkins | 28,872 | 57.5 | +0.9 | |
Labor | Claude Allen | 21,299 | 42.5 | +33.7 | |
Total formal votes | 50,171 | 98.3 | |||
Informal votes | 863 | 1.7 | |||
Turnout | 51,034 | 97.3 | |||
United Australia hold | Swing | -1.3 | |||
Party | Candidate | Votes | % | ±% | |
---|---|---|---|---|---|
Labor | William Scully | 27,140 | 52.4 | +0.1 | |
Country | Ernest Batchelor | 24,679 | 47.6 | -4.9 | |
Total formal votes | 51,819 | 98.9 | |||
Informal votes | 601 | 1.1 | |||
Turnout | 52,420 | 96.8 | |||
Labor hold | Swing | +6.9 | |||
Party | Candidate | Votes | % | ±% | |
---|---|---|---|---|---|
Country | Thomas Collins | 27,784 | 54.1 | +1.2 | |
Labor | Essell Hoad | 23,526 | 45.9 | +32.1 | |
Total formal votes | 51,310 | 98.4 | |||
Informal votes | 853 | 1.6 | |||
Turnout | 52,163 | 96.4 | |||
Country hold | Swing | −2.3 | |||
Party | Candidate | Votes | % | ±% | |
---|---|---|---|---|---|
Labor | Rowley James | unopposed | |||
Labor gain from Labor (NSW) | Swing |
Party | Candidate | Votes | % | ±% | |
---|---|---|---|---|---|
Labor | Dan Mulcahy | 28,379 | 50.4 | +43.3 | |
United Australia | Matthew Calman | 25,547 | 45.3 | +7.4 | |
Social Credit | Ernest Carr | 2,435 | 4.3 | -6.7 | |
Total formal votes | 56,361 | 97.5 | |||
Informal votes | 1,437 | 2.5 | |||
Turnout | 57,798 | 97.5 | |||
Two-party-preferred result | |||||
Labor | Dan Mulcahy | 52.6 | +52.6 | ||
United Australia | Matthew Calman | 47.4 | +4.5 | ||
Labor gain from Labor (NSW) | Swing | -4.5 |
Party | Candidate | Votes | % | ±% | |
---|---|---|---|---|---|
United Australia | John Lawson | 26,392 | 52.1 | +6.8 | |
Labor | Tony Luchetti | 24,272 | 47.9 | +27.1 | |
Total formal votes | 50,664 | 98.4 | |||
Informal votes | 827 | 1.6 | |||
Turnout | 51,491 | 98.6 | |||
United Australia hold | Swing | -1.3 | |||
Party | Candidate | Votes | % | ±% | |
---|---|---|---|---|---|
United Australia | William McCall | 30,971 | 56.1 | +2.5 | |
Labor | Stan Taylor | 20,186 | 36.6 | +29.4 | |
Social Credit | George Carruthers | 4,009 | 7.3 | -3.0 | |
Total formal votes | 55,166 | 97.7 | |||
Informal votes | 1,304 | 2.3 | |||
Turnout | 56,470 | 97.6 | |||
Two-party-preferred result | |||||
United Australia | William McCall | 60.3 | -0.2 | ||
Labor | Stan Taylor | 39.7 | +0.2 | ||
United Australia hold | Swing | -0.2 | |||
Party | Candidate | Votes | % | ±% | |
---|---|---|---|---|---|
Country | Victor Thompson | 29,994 | 61.0 | +16.9 | |
Labor | Leigh Cuthbertson | 19,196 | 39.0 | +39.0 | |
Total formal votes | 49,190 | 97.7 | |||
Informal votes | 1,141 | 2.3 | |||
Turnout | 50,331 | 96.4 | |||
Country hold | Swing | -0.7 | |||
Party | Candidate | Votes | % | ±% | |
---|---|---|---|---|---|
Labor | David Watkins | 44,085 | 79.3 | +21.2 | |
Independent | Hilton Sykes | 11,579 | 20.7 | +20.7 | |
Total formal votes | 55,579 | 95.9 | |||
Informal votes | 2,379 | 4.1 | |||
Turnout | 57,958 | 97.3 | |||
Labor hold | Swing | +21.2 | |||
Party | Candidate | Votes | % | ±% | |
---|---|---|---|---|---|
United Australia | Billy Hughes | 38,386 | 65.9 | +0.8 | |
Labor | Henry Clayden | 16,254 | 27.9 | +27.9 | |
Social Credit | Percival Minahan | 3,568 | 6.1 | -5.6 | |
Total formal votes | 58,208 | 97.7 | |||
Informal votes | 1,344 | 2.3 | |||
Turnout | 59,552 | 97.2 | |||
Two-party-preferred result | |||||
United Australia | Billy Hughes | 69.0 | -2.0 | ||
Labor | Henry Clayden | 31.0 | +31.0 | ||
United Australia hold | Swing | -2.0 | |||
Party | Candidate | Votes | % | ±% | |
---|---|---|---|---|---|
United Australia | Sir Charles Marr | 35,468 | 63.7 | +3.7 | |
Labor | Karl Guhl | 20,217 | 36.3 | +36.3 | |
Total formal votes | 55,685 | 98.1 | |||
Informal votes | 1,050 | 1.9 | |||
Turnout | 56,735 | 96.8 | |||
United Australia hold | Swing | -2.6 | |||
Party | Candidate | Votes | % | ±% | |
---|---|---|---|---|---|
United Australia | Sir Frederick Stewart | 37,972 | 67.9 | +2.8 | |
Labor | Albert Rowe | 14,747 | 26.4 | +22.4 | |
Independent | Dick George | 2,118 | 3.8 | +3.8 | |
Independent | Harold Meggitt | 1,100 | 2.0 | +2.0 | |
Total formal votes | 55,937 | 97.4 | |||
Informal votes | 1,504 | 2.6 | |||
Turnout | 57,441 | 96.4 | |||
Two-party-preferred result | |||||
United Australia | Sir Frederick Stewart | 69.8 | +0.4 | ||
Labor | Albert Rowe | 30.2 | +30.2 | ||
United Australia hold | Swing | +0.4 | |||
Party | Candidate | Votes | % | ±% | |
---|---|---|---|---|---|
Labor | Joe Gander | 33,738 | 60.3 | +3.5 | |
United Australia | Reuben Jenner | 22,239 | 39.7 | +7.7 | |
Total formal votes | 55,977 | 96.4 | |||
Informal votes | 1,468 | 2.6 | |||
Turnout | 57,445 | 96.8 | |||
Labor gain from Labor (NSW) | Swing | +60.3 |
Party | Candidate | Votes | % | ±% | |
---|---|---|---|---|---|
Country | Roland Green | 15,842 | 30.3 | -1.2 | |
Labor | Jim Fredericks | 15,253 | 29.3 | +29.3 | |
Country | Larry Anthony | 12,524 | 24.1 | +24.1 | |
Country | Robert Gibson | 8,433 | 16.2 | +16.2 | |
Total formal votes | 52,052 | 97.6 | |||
Informal votes | 1,276 | 2.4 | |||
Turnout | 53,328 | 97.0 | |||
Two-party-preferred result | |||||
Country | Larry Anthony | 28,940 | 55.6 | +4.5 | |
Country | Roland Green | 23,112 | 44.4 | +44.4 | |
Country hold | Swing | +4.5 | |||
Party | Candidate | Votes | % | ±% | |
---|---|---|---|---|---|
Country | Horace Nock | 24,756 | 49.4 | -5.6 | |
Labor | William Quirk | 20,182 | 40.3 | +27.2 | |
Independent | Robert Ballantyne | 5,165 | 10.3 | +10.3 | |
Total formal votes | 50,103 | 98.1 | |||
Informal votes | 975 | 1.9 | |||
Turnout | 51,078 | 95.7 | |||
Two-party-preferred result | |||||
Country | Horace Nock | 28,661 | 57.2 | -2.1 | |
Labor | William Quirk | 21,442 | 42.8 | +2.1 | |
Country hold | Swing | -2.1 | |||
Party | Candidate | Votes | % | ±% | |
---|---|---|---|---|---|
United Australia | Sydney Gardner | 24,691 | 47.6 | +5.0 | |
Labor | Gordon Cross | 22,923 | 44.2 | +44.2 | |
Independent | John Metcalfe | 4,220 | 8.1 | +8.1 | |
Total formal votes | 51,834 | 97.1 | |||
Informal votes | 1,553 | 2.9 | |||
Turnout | 53,387 | 96.2 | |||
Two-party-preferred result | |||||
United Australia | Sydney Gardner | 27,544 | 53.1 | -3.1 | |
Labor | Gordon Cross | 24,290 | 46.9 | +46.9 | |
United Australia hold | Swing | -3.1 | |||
Party | Candidate | Votes | % | ±% | |
---|---|---|---|---|---|
United Australia | Sir Archdale Parkhill | 26,568 | 43.9 | -27.4 | |
Independent UAP | Percy Spender | 17,322 | 28.6 | +28.6 | |
Labor | Walter Salter | 8,494 | 14.0 | +14.0 | |
Independent UAP | Joseph Hamlet | 8,200 | 13.5 | +13.5 | |
Total formal votes | 60,584 | 98.2 | |||
Informal votes | 1,118 | 1.8 | |||
Turnout | 61,702 | 97.2 | |||
Two-party-preferred result | |||||
Independent UAP | Percy Spender | 31,446 | 51.9 | +51.9 | |
United Australia | Sir Archdale Parkhill | 29,138 | 48.1 | -29.4 | |
Independent UAP gain from United Australia | Swing | +29.4 |
Party | Candidate | Votes | % | ±% | |
---|---|---|---|---|---|
United Australia | John Jennings | 31,187 | 53.8 | -1.1 | |
Labor | William Dignam | 26,788 | 46.2 | +39.7 | |
Total formal votes | 57,975 | 98.0 | |||
Informal votes | 1,157 | 2.0 | |||
Turnout | 59,132 | 96.5 | |||
United Australia hold | Swing | -4.9 | |||
Party | Candidate | Votes | % | ±% | |
---|---|---|---|---|---|
United Australia | Eric Harrison | 40,398 | 67.4 | +1.7 | |
Labor | Thomas Conway | 19,499 | 32.6 | +32.6 | |
Total formal votes | 59,897 | 97.8 | |||
Informal votes | 1,343 | 2.2 | |||
Turnout | 61,240 | 96.1 | |||
United Australia hold | Swing | -3.6 | |||
Party | Candidate | Votes | % | ±% | |
---|---|---|---|---|---|
Labor | Bert Lazzarini | 31,188 | 55.3 | +51.9 | |
United Australia | Henry Storey | 25,190 | 44.7 | −1.4 | |
Total formal votes | 56,378 | 97.8 | |||
Informal votes | 1,241 | 2.2 | |||
Turnout | 57,619 | 96.9 | |||
Labor gain from Labor (NSW) | Swing | +55.3 |
Party | Candidate | Votes | % | ±% | |
---|---|---|---|---|---|
Labor | Jack Beasley | unopposed | |||
Labor gain from Labor (NSW) | Swing |
Party | Candidate | Votes | % | ±% | |
---|---|---|---|---|---|
United Australia | Thomas White | 36,602 | 58.1 | −13.7 | |
Labor | Phillip Nash | 13,746 | 21.8 | −2.0 | |
Independent | John Atkinson | 12,613 | 20.0 | +20.0 | |
Total formal votes | 62,961 | 97.9 | |||
Informal votes | 1,321 | 2.1 | |||
Turnout | 64,282 | 96.5 | |||
Two-party-preferred result | |||||
United Australia | Thomas White | 67.1 | −6.9 | ||
Labor | Phillip Nash | 32.9 | +6.9 | ||
United Australia hold | Swing | −6.9 | |||
Party | Candidate | Votes | % | ±% | |
---|---|---|---|---|---|
Labor | Reg Pollard | 24,784 | 50.6 | +5.7 | |
United Australia | Stanley Walker | 24,186 | 49.4 | +16.1 | |
Total formal votes | 48,970 | 99.1 | |||
Informal votes | 467 | 0.9 | |||
Turnout | 49,437 | 97.1 | |||
Labor gain from United Australia | Swing | +3.5 |
Party | Candidate | Votes | % | ±% | |
---|---|---|---|---|---|
Labor | Frank Brennan | 36,439 | 63.4 | +8.6 | |
United Australia | Albert Peters | 21,013 | 36.6 | -8.6 | |
Total formal votes | 57,452 | 98.2 | |||
Informal votes | 1,037 | 1.8 | |||
Turnout | 58,489 | 96.9 | |||
Labor hold | Swing | +8.6 | |||
Party | Candidate | Votes | % | ±% | |
---|---|---|---|---|---|
Labor | Ernest Duus | 18,834 | 39.5 | −0.5 | |
Country | George Rankin | 15,081 | 31.6 | +7.6 | |
United Australia | Walter Pearce | 13,748 | 28.8 | −6.4 | |
Total formal votes | 47,663 | 98.5 | |||
Informal votes | 740 | 1.5 | |||
Turnout | 48,403 | 96.0 | |||
Two-party-preferred result | |||||
Country | George Rankin | 27,100 | 56.9 | −0.3 | |
Labor | Ernest Duus | 20,563 | 43.1 | +0.3 | |
Country gain from United Australia | Swing | −0.3 |
Party | Candidate | Votes | % | ±% | |
---|---|---|---|---|---|
Labor | Maurice Blackburn | 38,793 | 68.1 | +8.4 | |
United Australia | Richard Griffiths | 18,162 | 31.9 | −2.6 | |
Total formal votes | 56,955 | 97.5 | |||
Informal votes | 1,460 | 2.5 | |||
Turnout | 58,415 | 96.7 | |||
Labor hold | Swing | +3.2 | |||
Party | Candidate | Votes | % | ±% | |
---|---|---|---|---|---|
United Australia | Geoffrey Street | 25,788 | 53.9 | +13.8 | |
Labor | Arthur Haywood | 22,096 | 46.1 | +9.3 | |
Total formal votes | 47,884 | 99.0 | |||
Informal votes | 494 | 1.0 | |||
Turnout | 48,378 | 96.5 | |||
United Australia hold | Swing | −5.7 | |||
Party | Candidate | Votes | % | ±% | |
---|---|---|---|---|---|
United Australia | Richard Casey | 28,845 | 56.5 | −1.5 | |
Labor | Leo Carmody | 22,170 | 43.5 | +4.1 | |
Total formal votes | 51,015 | 98.6 | |||
Informal votes | 701 | 1.4 | |||
Turnout | 51,716 | 96.7 | |||
United Australia hold | Swing | −1.8 | |||
Party | Candidate | Votes | % | ±% | |
---|---|---|---|---|---|
United Australia | William Hutchinson | 30,442 | 59.7 | +5.5 | |
Labor | Paul Jones | 20,512 | 40.3 | +9.5 | |
Total formal votes | 50,954 | 98.2 | |||
Informal votes | 911 | 1.8 | |||
Turnout | 51,865 | 95.8 | |||
United Australia hold | Swing | -6.7 | |||
Party | Candidate | Votes | % | ±% | |
---|---|---|---|---|---|
United Australia | Harold Holt | 33,277 | 55.1 | -12.4 | |
Labor | William Doran | 17,124 | 28.4 | +2.7 | |
Independent | William Bottomley | 9,941 | 16.5 | +16.5 | |
Total formal votes | 60,342 | 97.4 | |||
Informal votes | 1,602 | 2.6 | |||
Turnout | 61,944 | 93.8 | |||
Two-party-preferred result | |||||
United Australia | Harold Holt | 62.4 | -8.5 | ||
Labor | William Doran | 37.6 | +8.5 | ||
United Australia hold | Swing | -8.5 | |||
Party | Candidate | Votes | % | ±% | |
---|---|---|---|---|---|
United Australia | James Fairbairn | 27,085 | 53.0 | -7.9 | |
Country | Reginald Skeat | 12,497 | 24.5 | -15.9 | |
Social Credit | Alexander Amess | 6,884 | 13.5 | +13.5 | |
Communist | Ralph Gibson | 4,630 | 9.1 | +2.1 | |
Total formal votes | 51,096 | 96.8 | |||
Informal votes | 1,709 | 3.2 | |||
Turnout | 52,805 | 96.5 | |||
Two-party-preferred result | |||||
United Australia | James Fairbairn | 61.7 | -9.6 | ||
Country | Reginald Skeat | 38.3 | +38.3 | ||
United Australia hold | Swing | -9.6 | |||
Party | Candidate | Votes | % | ±% | |
---|---|---|---|---|---|
Country | Thomas Paterson | 29,069 | 61.1 | ||
Labor | James McKenna | 18,483 | 38.9 | ||
Total formal votes | 47,552 | 98.4 | |||
Informal votes | 765 | 1.6 | |||
Turnout | 48,317 | 96.2 | |||
Country hold | Swing | ||||
Party | Candidate | Votes | % | ±% | |
---|---|---|---|---|---|
United Australia | Sir Henry Gullett | 31,574 | 53.0 | -3.5 | |
Labor | Sydney Walker | 19,324 | 32.5 | +8.3 | |
Independent | Rupert Hornabrook | 8,647 | 14.5 | +14.5 | |
Total formal votes | 59,545 | 97.6 | |||
Informal votes | 1,450 | 2.4 | |||
Turnout | 60,995 | 96.2 | |||
Two-party-preferred result | |||||
United Australia | Sir Henry Gullett | 60.3 | -5.9 | ||
Labor | Sydney Walker | 39.7 | +5.9 | ||
United Australia hold | Swing | -5.9 | |||
Party | Candidate | Votes | % | ±% | |
---|---|---|---|---|---|
Country | John McEwen | 30,660 | 61.2 | +13.2 | |
Labor | William Hartshorne | 19,478 | 38.8 | +3.3 | |
Total formal votes | 50,138 | 98.6 | |||
Informal votes | 699 | 1.4 | |||
Turnout | 50,837 | 96.7 | |||
Country hold | Swing | −1.7 | |||
Party | Candidate | Votes | % | ±% | |
---|---|---|---|---|---|
United Australia | Robert Menzies | 31,690 | 51.3 | −11.4 | |
Labor | Thomas Brennan | 15,247 | 24.7 | +6.6 | |
Independent | Leslie Hollins | 14,841 | 24.0 | +24.0 | |
Total formal votes | 61,778 | 97.9 | |||
Informal votes | 1,326 | 2.1 | |||
Turnout | 63,104 | 95.6 | |||
Two-party-preferred result | |||||
United Australia | Robert Menzies | 57.3 | −15.0 | ||
Labor | Thomas Brennan | 42.7 | +15.0 | ||
United Australia hold | Swing | −15.0 | |||
Party | Candidate | Votes | % | ±% | |
---|---|---|---|---|---|
Labor | Arthur Drakeford | 37,111 | 62.3 | +12.5 | |
United Australia | Malcolm Fenton | 20,799 | 34.9 | -6.1 | |
Independent | Edward Turner | 1,703 | 2.9 | +2.9 | |
Total formal votes | 59,613 | 97.7 | |||
Informal votes | 1,376 | 2.3 | |||
Turnout | 60,989 | 97.8 | |||
Two-party-preferred result | |||||
Labor | Arthur Drakeford | 63.7 | +6.0 | ||
United Australia | Malcolm Fenton | 36.3 | -6.0 | ||
Labor hold | Swing | +6.0 | |||
Party | Candidate | Votes | % | ±% | |
---|---|---|---|---|---|
Labor | William Maloney | unopposed | |||
Labor hold | Swing | ||||
Party | Candidate | Votes | % | ±% | |
---|---|---|---|---|---|
Labor | Jack Holloway | unopposed | |||
Labor hold | Swing | ||||
Party | Candidate | Votes | % | ±% | |
---|---|---|---|---|---|
Labor | Don McLeod | 19,520 | 39.3 | +6.9 | |
United Australia | Thomas Scholfield | 18,526 | 37.3 | +0.7 | |
Country | Robert Rankin | 11,618 | 23.4 | -6.6 | |
Total formal votes | 49,664 | 98.6 | |||
Informal votes | 700 | 1.4 | |||
Turnout | 50,364 | 96.6 | |||
Two-party-preferred result | |||||
United Australia | Thomas Scholfield | 25,489 | 51.3 | -3.7 | |
Labor | Don McLeod | 24,175 | 48.7 | +3.7 | |
United Australia hold | Swing | -3.7 | |||
Party | Candidate | Votes | % | ±% | |
---|---|---|---|---|---|
Independent | Alexander Wilson | 24,179 | 51.9 | +51.9 | |
Country | Hugh McClelland | 22,396 | 48.1 | +14.8 | |
Total formal votes | 46,575 | 98.9 | |||
Informal votes | 541 | 1.1 | |||
Turnout | 47,116 | 96.1 | |||
Independent gain from Country | Swing | +2.9 |
Party | Candidate | Votes | % | ±% | |
---|---|---|---|---|---|
Labor | James Scullin | 37,381 | 64.0 | +9.0 | |
United Australia | Douglas Knight | 20,999 | 36.0 | +0.2 | |
Total formal votes | 58,380 | 97.7 | |||
Informal votes | 1,393 | 2.3 | |||
Turnout | 59,773 | 94.7 | |||
Labor hold | Swing | +2.4 | |||
Party | Candidate | Votes | % | ±% | |
---|---|---|---|---|---|
Labor | George Lawson | 28,818 | 51.5 | −0.4 | |
United Australia | Graham Hart | 24,808 | 44.3 | +5.2 | |
Social Credit | Ambrose Sawtell | 2,362 | 4.2 | +0.1 | |
Total formal votes | 55,988 | 96.5 | |||
Informal votes | 2,003 | 3.5 | |||
Turnout | 57,991 | 94.6 | |||
Two-party-preferred result | |||||
Labor | George Lawson | 53.6 | −4.9 | ||
United Australia | Graham Hart | 46.4 | +4.9 | ||
Labor hold | Swing | −4.9 | |||
Party | Candidate | Votes | % | ±% | |
---|---|---|---|---|---|
Labor | Frank Forde | 27,221 | 50.4 | −9.9 | |
Country | Edwin Hiskens | 20,543 | 38.0 | +38.0 | |
Social Credit | John Harding | 6,235 | 11.5 | +11.5 | |
Total formal votes | 53,999 | 98.5 | |||
Informal votes | 849 | 1.5 | |||
Turnout | 54,848 | 96.2 | |||
Two-party-preferred result | |||||
Labor | Frank Forde | 56.2 | −4.1 | ||
Country | Edwin Hiskens | 44.8 | +45.8 | ||
Labor hold | Swing | −4.1 | |||
Party | Candidate | Votes | % | ±% | |
---|---|---|---|---|---|
Country | Arthur Fadden | 30,747 | 60.7 | +60.7 | |
Labor | Leslie Bailey | 17,264 | 34.1 | -5.1 | |
Social Credit | Arthur Rushton | 2,617 | 5.2 | +5.2 | |
Total formal votes | 50,628 | 98.5 | |||
Informal votes | 784 | 1.5 | |||
Turnout | 51,412 | 97.7 | |||
Two-party-preferred result | |||||
Country | Arthur Fadden | 63.3 | -2.5 | ||
Labor | Leslie Bailey | 36.7 | +2.5 | ||
Country hold | Swing | -2.5 | |||
Party | Candidate | Votes | % | ±% | |
---|---|---|---|---|---|
Labor | Francis Baker | 27,864 | 48.3 | -5.1 | |
United Australia | Dugald Clark | 23,756 | 41.2 | +6.1 | |
Social Credit | William Moore | 6,108 | 10.6 | -0.9 | |
Total formal votes | 57,728 | 97.2 | |||
Informal votes | 1,681 | 2.8 | |||
Turnout | 59,409 | 97.4 | |||
Two-party-preferred result | |||||
Labor | Francis Baker | 29,026 | 50.3 | -8.9 | |
United Australia | Dugald Clark | 28,702 | 49.7 | +8.9 | |
Labor hold | Swing | -8.9 | |||
Party | Candidate | Votes | % | ±% | |
---|---|---|---|---|---|
Labor | George Martens | 25,766 | 43.6 | -8.7 | |
Country | James Wilkie | 17,252 | 29.2 | +29.2 | |
Communist | Fred Paterson | 12,523 | 21.2 | +12.9 | |
Social Credit | Henry Beck | 3,622 | 6.1 | +6.1 | |
Total formal votes | 59,163 | 95.1 | |||
Informal votes | 3,019 | 4.9 | |||
Turnout | 62,182 | 94.4 | |||
Two-party-preferred result | |||||
Labor | George Martens | 39,263 | 66.4 | +5.4 | |
Country | James Wilkie | 19,900 | 33.6 | +33.6 | |
Labor hold | Swing | +5.4 | |||
Party | Candidate | Votes | % | ±% | |
---|---|---|---|---|---|
Labor | Bill Riordan | 30,356 | 64.0 | +4.3 | |
Country | Alex Kippen | 14,812 | 31.2 | +31.2 | |
Social Credit | Herbert Price | 2,269 | 4.8 | +4.8 | |
Total formal votes | 47,437 | 97.0 | |||
Informal votes | 1,443 | 3.0 | |||
Turnout | 48,880 | 91.3 | |||
Two-party-preferred result | |||||
Labor | Bill Riordan | 66.4 | +2.5 | ||
Country | Alex Kippen | 33.6 | -2.5 | ||
Labor hold | Swing | +2.5 | |||
Party | Candidate | Votes | % | ±% | |
---|---|---|---|---|---|
United Australia | William Jolly | 31,814 | 56.6 | +5.2 | |
Labor | Edmund Taylor | 21,386 | 38.0 | -1.9 | |
Social Credit | Harry Cash | 3,040 | 5.4 | +5.4 | |
Total formal votes | 56,240 | 97.0 | |||
Informal votes | 1,720 | 3.0 | |||
Turnout | 57,960 | 97.3 | |||
Two-party-preferred result | |||||
United Australia | William Jolly | 60.3 | +4.5 | ||
Labor | Edmund Taylor | 39.7 | -4.5 | ||
United Australia hold | Swing | +4.5 | |||
Party | Candidate | Votes | % | ±% | |
---|---|---|---|---|---|
Country | James Hunter | 24,846 | 48.4 | -3.4 | |
Labor | Randolph Bedford | 21,272 | 41.4 | +0.5 | |
Social Credit | Henry Madden | 5,257 | 10.2 | +2.9 | |
Total formal votes | 51,375 | 98.2 | |||
Informal votes | 963 | 1.8 | |||
Turnout | 52,338 | 93.3 | |||
Two-party-preferred result | |||||
Country | James Hunter | 27,914 | 54.3 | -5.7 | |
Labor | Randolph Bedford | 23,461 | 45.7 | +5.7 | |
Country hold | Swing | -5.7 | |||
Party | Candidate | Votes | % | ±% | |
---|---|---|---|---|---|
United Australia | Josiah Francis | 32,813 | 55.3 | +4.1 | |
Labor | John McCoy | 22,021 | 37.1 | -1.1 | |
Social Credit | Henry Hogg | 4,508 | 7.6 | -3.0 | |
Total formal votes | 59,342 | 97.8 | |||
Informal votes | 1,335 | 2.2 | |||
Turnout | 60,677 | 97.7 | |||
Two-party-preferred result | |||||
United Australia | Josiah Francis | 59.1 | +2.6 | ||
Labor | John McCoy | 40.9 | -2.6 | ||
United Australia hold | Swing | +2.6 | |||
Party | Candidate | Votes | % | ±% | |
---|---|---|---|---|---|
Social Credit | Geoffrey Nichols | 20,356 | 39.6 | +27.9 | |
Country | Bernard Corser | 19,437 | 37.8 | -15.9 | |
Labor | George Watson | 11,644 | 22.6 | -9.8 | |
Total formal votes | 51,437 | 98.2 | |||
Informal votes | 942 | 1.8 | |||
Turnout | 52,379 | 95.5 | |||
Two-party-preferred result | |||||
Country | Bernard Corser | 25,991 | 50.5 | -9.3 | |
Social Credit | Geoffrey Nichols | 25,446 | 49.5 | +49.5 | |
Country hold | Swing | -9.3 | |||
Party | Candidate | Votes | % | ±% | |
---|---|---|---|---|---|
United Australia | Fred Stacey | 26,575 | 45.3 | +8.5 | |
Labor | Ken Bardolph | 16,989 | 28.9 | +17.8 | |
Labor | George Edwin Yates | 9,683 | 16.5 | +16.5 | |
Labor | Herbert George | 5,451 | 9.3 | +9.3 | |
Total formal votes | 58,698 | 93.3 | |||
Informal votes | 4,196 | 6.7 | |||
Turnout | 62,894 | 96.5 | |||
Two-party-preferred result | |||||
United Australia | Fred Stacey | 31,721 | 54.0 | +0.8 | |
Labor | Ken Bardolph | 26,977 | 46.0 | −0.8 | |
United Australia hold | Swing | +0.8 | |||
Party | Candidate | Votes | % | ±% | |
---|---|---|---|---|---|
Country | Archie Cameron | 35,559 | 63.6 | +1.3 | |
Independent | Charles Lloyd | 20,375 | 36.4 | +36.4 | |
Total formal votes | 55,934 | 95.4 | |||
Informal votes | 2,724 | 4.6 | |||
Turnout | 58,658 | 96.9 | |||
Country hold | Swing | −5.1 | |||
Party | Candidate | Votes | % | ±% | |
---|---|---|---|---|---|
United Australia | John Price | 31,362 | 51.9 | −9.1 | |
Labor | Kevin McEntee | 12,077 | 20.0 | +7.1 | |
Independent | William Hardy | 9,136 | 15.1 | +15.1 | |
Labor | Leonard Pilton | 7,859 | 13.0 | +13.0 | |
Total formal votes | 60,434 | 94.0 | |||
Informal votes | 3,831 | 6.0 | |||
Turnout | 64,265 | 96.4 | |||
Two-party-preferred result | |||||
United Australia | John Price | 59.8 | −5.9 | ||
Labor | Kevin McEntee | 40.2 | +5.9 | ||
United Australia hold | Swing | −5.9 | |||
Party | Candidate | Votes | % | ±% | |
---|---|---|---|---|---|
Country | Oliver Badman | 24,153 | 52.0 | +52.0 | |
Labor | James Marner | 17,528 | 37.8 | +3.6 | |
Independent | Alfred Parker | 4,736 | 10.2 | +10.2 | |
Total formal votes | 46,417 | 95.8 | |||
Informal votes | 2,029 | 4.2 | |||
Turnout | 48,446 | 97.2 | |||
Two-party-preferred result | |||||
Country | Oliver Badman | 57.1 | +57.1 | ||
Labor | James Marner | 42.9 | +2.9 | ||
Country gain from United Australia | Swing | -2.9 |
Party | Candidate | Votes | % | ±% | |
---|---|---|---|---|---|
Labor | Norman Makin | 43,215 | 70.7 | +8.8 | |
United Australia | Harry Hatwell | 17,918 | 29.3 | +29.3 | |
Total formal votes | 61,133 | 95.8 | |||
Informal votes | 2,662 | 4.2 | |||
Turnout | 63,795 | 97.1 | |||
Labor hold | Swing | +4.0 | |||
Party | Candidate | Votes | % | ±% | |
---|---|---|---|---|---|
United Australia | Charles Hawker | 32,113 | 63.4 | -1.7 | |
Labor | Raymond Davis | 18,508 | 36.6 | +17.4 | |
Total formal votes | 50,621 | 96.1 | |||
Informal votes | 2,073 | 3.9 | |||
Turnout | 52,694 | 96.5 | |||
United Australia hold | Swing | -10.6 | |||
Party | Candidate | Votes | % | ±% | |
---|---|---|---|---|---|
Country | John Prowse | 22,894 | 54.4 | -5.7 | |
Labor | Ernest Hoar | 19,153 | 45.6 | +17.0 | |
Total formal votes | 42,047 | 96.7 | |||
Informal votes | 1,430 | 3.3 | |||
Turnout | 43,477 | 94.2 | |||
Country hold | Swing | -9.4 | |||
Party | Candidate | Votes | % | ±% | |
---|---|---|---|---|---|
Labor | John Curtin | 29,548 | 55.2 | +9.5 | |
United Australia | Eric Isaachsen | 21,857 | 40.9 | +0.5 | |
Independent | Henry Wright | 2,081 | 3.9 | +3.9 | |
Total formal votes | 53,486 | 96.7 | |||
Informal votes | 1,827 | 3.3 | |||
Turnout | 55,313 | 94.7 | |||
Two-party-preferred result | |||||
Labor | John Curtin | 57.2 | +4.6 | ||
United Australia | Eric Isaachsen | 42.8 | -4.6 | ||
Labor hold | Swing | +4.6 | |||
Party | Candidate | Votes | % | ±% | |
---|---|---|---|---|---|
Labor | Albert Green | 25,771 | 73.6 | -26.4 | |
United Australia | Stephen Kellow | 9,235 | 26.4 | +26.4 | |
Total formal votes | 35,006 | 96.0 | |||
Informal votes | 1,457 | 4.0 | |||
Turnout | 36,463 | 88.4 | |||
Labor hold | Swing | -26.4 | |||
Party | Candidate | Votes | % | ±% | |
---|---|---|---|---|---|
United Australia | Walter Nairn | 21,800 | 41.1 | +22.6 | |
Labor | Tom Burke | 18,091 | 34.1 | +0.1 | |
United Australia | Jack Simons | 10,035 | 18.9 | +18.9 | |
Independent | Viv James | 3,085 | 5.8 | +5.8 | |
Total formal votes | 53,011 | 96.4 | |||
Informal votes | 1,980 | 3.6 | |||
Turnout | 54,991 | 93.6 | |||
Two-party-preferred result | |||||
United Australia | Walter Nairn | 31,942 | 60.3 | +2.9 | |
Labor | Tom Burke | 21,069 | 39.7 | -2.9 | |
United Australia hold | Swing | +2.9 | |||
Party | Candidate | Votes | % | ±% | |
---|---|---|---|---|---|
Country | Henry Gregory | 26,299 | 58.1 | -5.9 | |
Labor | John Steele | 18,951 | 41.9 | +5.9 | |
Total formal votes | 45,250 | 96.5 | |||
Informal votes | 1,623 | 3.5 | |||
Turnout | 46,873 | 92.5 | |||
Country hold | Swing | -5.9 | |||
Party | Candidate | Votes | % | ±% | |
---|---|---|---|---|---|
Labor | Claude Barnard | 12,583 | 50.4 | +22.8 | |
United Australia | Allan Guy | 9,760 | 39.1 | −2.4 | |
Independent | John Watson | 2,621 | 10.5 | −0.5 | |
Total formal votes | 24,964 | 97.6 | |||
Informal votes | 612 | 2.4 | |||
Turnout | 25,576 | 96.5 | |||
Two-party-preferred result | |||||
Labor | Claude Barnard | 55.7 | +5.4 | ||
United Australia | Allan Guy | 44.3 | −5.4 | ||
Labor hold | Swing | +5.4 | |||
Party | Candidate | Votes | % | ±% | |
---|---|---|---|---|---|
United Australia | George Bell | 13,557 | 52.5 | -1.9 | |
Labor | Edwin Brown | 12,270 | 47.5 | +1.9 | |
Total formal votes | 25,827 | 97.9 | |||
Informal votes | 559 | 2.1 | |||
Turnout | 26,386 | 95.8 | |||
United Australia hold | Swing | -1.9 | |||
Party | Candidate | Votes | % | ±% | |
---|---|---|---|---|---|
Labor | Gerald Mahoney | 11,652 | 47.5 | -1.7 | |
United Australia | John McPhee | 10,123 | 41.3 | -0.7 | |
Independent Labor | Maxwell Hickman | 2,159 | 8.8 | +8.8 | |
Social Credit | Athol Smith | 600 | 2.4 | -6.3 | |
Total formal votes | 24,534 | 96.8 | |||
Informal votes | 1,067 | 4.2 | |||
Turnout | 25,601 | 96.3 | |||
Two-party-preferred result | |||||
Labor | Gerald Mahoney | 13,218 | 53.9 | +3.6 | |
United Australia | John McPhee | 11,316 | 46.1 | -3.6 | |
Labor hold | Swing | +3.6 | |||
Party | Candidate | Votes | % | ±% | |
---|---|---|---|---|---|
Labor | Charles Frost | 15,348 | 58.0 | +14.9 | |
United Australia | Hugh Warner | 11,133 | 42.0 | +2.2 | |
Total formal votes | 26,481 | 97.8 | |||
Informal votes | 599 | 2.2 | |||
Turnout | 27,080 | 97.0 | |||
Labor hold | Swing | +5.6 | |||
Party | Candidate | Votes | % | ±% | |
---|---|---|---|---|---|
United Australia | Joseph Lyons | 12,365 | 53.2 | -4.3 | |
Labor | Lancelot Spurr | 6,384 | 27.4 | +27.4 | |
Labor | Maurice Weston | 4,511 | 19.4 | +19.4 | |
Total formal votes | 23,260 | 96.8 | |||
Informal votes | 776 | 3.2 | |||
Turnout | 24,036 | 94.3 | |||
Two-party-preferred result | |||||
United Australia | Joseph Lyons | 55.1 | -4.3 | ||
Labor | Lancelot Spurr | 44.9 | +4.3 | ||
United Australia hold | Swing | -4.3 | |||
Party | Candidate | Votes | % | ±% | |
---|---|---|---|---|---|
Independent | Adair Blain | 963 | 38.2 | -11.6 | |
Labor | Robert Toupein | 920 | 36.5 | -9.2 | |
Independent | Ronald Hughes-Jones | 333 | 13.2 | +13.2 | |
Independent | Harold Nelson | 305 | 12.1 | +12.1 | |
Total formal votes | 2,521 | 98.8 | |||
Informal votes | 32 | 1.2 | |||
Turnout | 2,553 | 80.1 | |||
Two-party-preferred result | |||||
Independent | Adair Blain | 1,310 | 52.0 | +0.2 | |
Labor | Robert Toupein | 1,211 | 48.0 | -0.2 | |
Independent hold | Swing | +0.2 | |||
The National Party of Australia, also known as The Nationals or The Nats, is a centre-right Australian political party. Traditionally representing graziers, farmers, and regional voters generally, it began as the Australian Country Party in 1920 at a federal level.
The 1998 Australian federal election was held to determine the members of the 39th Parliament of Australia. It was held on 3 October 1998. All 148 seats of the House of Representatives and 40 seats of the 76-seat Senate were up for election. The incumbent centre-right Liberal/National Coalition government led by Prime Minister John Howard of the Liberal Party and coalition partner Tim Fischer of the National Party defeated the centre-left Australian Labor Party opposition led by Opposition Leader Kim Beazley, despite losing the nationwide popular and two-party preferred vote.
Lang Labor was a faction of the Australian Labor Party (ALP) consisting of the supporters of Jack Lang, who served two terms as Premier of New South Wales and was the party's state leader from 1923 to 1939.
In Australian politics, the two-party-preferred vote is the result of an election or opinion poll after preferences have been distributed to the highest two candidates, who in some cases can be independents. For the purposes of TPP, the Liberal/National Coalition is usually considered a single party, with Labor being the other major party. Typically the TPP is expressed as the percentages of votes attracted by each of the two major parties, e.g. "Coalition 50%, Labor 50%", where the values include both primary votes and preferences. The TPP is an indicator of how much swing has been attained/is required to change the result, taking into consideration preferences, which may have a significant effect on the result.
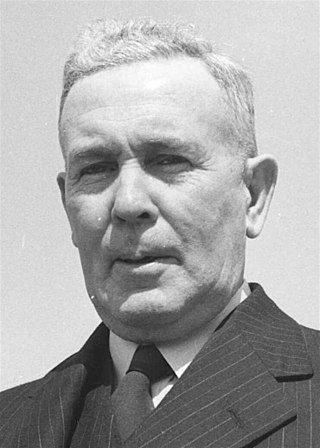
The 1946 Australian federal election was held in Australia on 28 September 1946. All 74 seats in the House of Representatives and 19 of the 36 seats in the Senate were up for election. The incumbent Labor Party led by Prime Minister Ben Chifley defeated the opposition Liberal–Country coalition, led by Robert Menzies. It was the Liberal Party's first federal election since its creation. This was the first time the Labor party had won a second consecutive election. This was also the last time the Labor party would win a federal election until the 1972 election.
The 1943 Australian federal election was held in Australia on 21 August 1943. All 74 seats in the House of Representatives and 19 of the 36 seats in the Senate were up for election. The incumbent Labor Party, led by Prime Minister John Curtin, defeated the opposition Country–UAP coalition led by Arthur Fadden in a landslide.
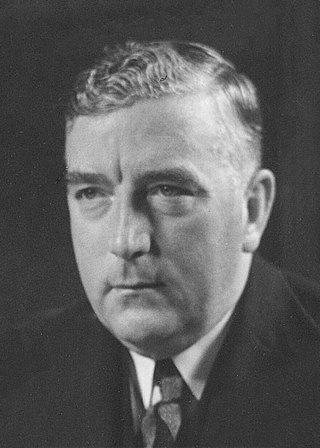
The 1940 Australian federal election was held in Australia on 21 September 1940. All 74 seats in the House of Representatives and 19 of the 36 seats in the Senate were up for election. The incumbent Coalition, consisting of the United Australia Party led by Prime Minister Robert Menzies and the Country Party led by Archie Cameron, defeated the opposition Labor Party under John Curtin despite losing the overall popular vote.
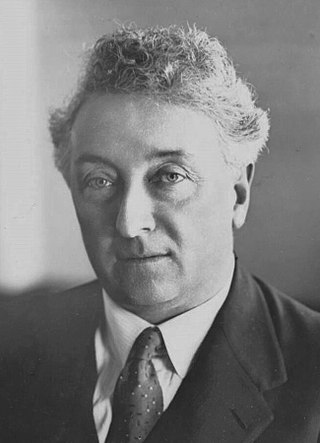
The 1937 Australian federal election was held in Australia on 23 October 1937. All 74 seats in the House of Representatives, and 19 of the 36 seats in the Senate were up for election. The incumbent UAP–Country coalition government, led by Prime Minister Joseph Lyons, defeated the opposition Labor Party under John Curtin.
The 1934 Australian federal election was held in Australia on 15 September 1934. All 74 seats in the House of Representatives, and 18 of the 36 seats in the Senate were up for election. The incumbent United Australia Party led by Prime Minister of Australia Joseph Lyons formed a minority government, with 33 out of 74 seats in the House.
Queanbeyan was an electoral district of the Legislative Assembly in the Australian state of New South Wales from 1859 to 1913, in the Queanbeyan area. It replaced parts of the electoral district of United Counties of Murray and St Vincent and the electoral district of Southern Boroughs. It was merged with the electoral district of Monaro in 1913, when much of its former territory had been absorbed in the Australian Capital Territory.
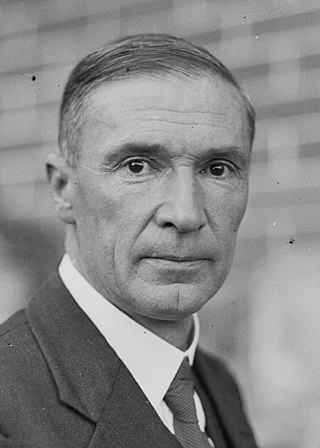
Thomas Paterson was an Australian politician who served as deputy leader of the Country Party from 1929 to 1937. He held ministerial office in the governments of Stanley Bruce and Joseph Lyons, representing the Division of Gippsland in Victoria from 1922 to 1943. He played a leading role in the creation of the Victorian Country Party as the political arm of the Victorian Farmers' Union.
Arthur Lewis was an Australian politician. Born in Melbourne, he received no formal education and was raised in an orphanage. He became a farm labourer and was secretary of the Victorian branch of the Carters and Drivers Union.
This is a list of members of the South Australian House of Assembly from 1933 to 1938, as elected at the 1933 state election:
This is a list of members of the 27th Legislative Assembly of Queensland from 1935 to 1938, as elected at the 1935 state election held on 11 May 1935.
This is a list of electoral results for the Division of Gwydir in Australian federal elections from the division's creation in 1901 until its abolition in 2007.
This is a list of electoral results for the Division of Deakin in Australian federal elections from the division's creation in 1937 until the present.
This is a list of electoral results for the Division of Echuca in Australian federal elections from the division's creation in 1901 until its abolition in 1937.
The Division of Nicholls is an Australian Electoral Division in the state of Victoria, which was contested for the first time at the 2019 federal election.
This is a list of electoral division results for the Australian 1934 federal election.