| ||||||||||||||||||||||||||||||||||||||||
All 148 seats in the House of Representatives 75 seats were needed for a majority in the House 40 (of the 76) seats in the Senate | ||||||||||||||||||||||||||||||||||||||||
---|---|---|---|---|---|---|---|---|---|---|---|---|---|---|---|---|---|---|---|---|---|---|---|---|---|---|---|---|---|---|---|---|---|---|---|---|---|---|---|---|
| ||||||||||||||||||||||||||||||||||||||||
|
1990 Australian federal election |
---|
National results |
State and territory results |
The following tables show results for the Australian House of Representatives at the 1990 federal election held on 24 March 1990. [1]
Party | Votes | % | Swing | Seats | Change | ||||
---|---|---|---|---|---|---|---|---|---|
Liberal | 3,440,902 | 34.76 | +0.44 | 55 | 12 | ||||
National | 833,557 | 8.42 | –3.10 | 14 | 5 | ||||
Country Liberal | 27,668 | 0.28 | +0.05 | 0 | |||||
Liberal–National coalition | 4,302,127 | 43.46 | –2.44 | 69 | 7 | ||||
Labor | 3,904,138 | 39.44 | –6.46 | 78 | 8 | ||||
Democrats | 1,114,216 | 11.26 | +5.26 | ||||||
Greens (state-based) [lower-alpha 1] | 137,351 | 1.37 | |||||||
Independents [lower-alpha 2] | 257,139 | 2.60 | +0.94 | 1 | 1 | ||||
Total | 9,899,674 | 148 | |||||||
Two-party-preferred vote | |||||||||
Labor | 4,930,837 | 49.90 | −0.93 | 78 | 8 | ||||
Liberal–National coalition | 4,950,072 | 50.10 | +0.93 | 69 | 7 | ||||
Invalid/blank votes | 326,126 | 3.19 | –1.75 | ||||||
Turnout | 10,225,800 | 95.32 | |||||||
Registered voters | 10,728,131 | ||||||||
Source: Federal Elections 1990 |
| ||||||||||||||||||||||||||||||||||
All 51 New South Wales seats in the Australian House of Representatives and 6 seats in the Australian Senate | ||||||||||||||||||||||||||||||||||
---|---|---|---|---|---|---|---|---|---|---|---|---|---|---|---|---|---|---|---|---|---|---|---|---|---|---|---|---|---|---|---|---|---|---|
|
Party | Votes | % | Swing | Seats | Change | ||
---|---|---|---|---|---|---|---|
Liberal | 975,083 | 32.76 | −4.19 | 12 | 1 | ||
National | 377,687 | 10.53 | −0.52 | 8 | 2 | ||
Liberal/National Coalition | 1,352,770 | 40.32 | −4.72 | 20 | 3 | ||
Labor | 1,380,780 | 41.16 | +4.01 | 30 | 2 | ||
Democrats | 342,540 | 10.21 | +6.34 | ||||
Independents [lower-alpha 2] | 166,832 | 4.97 | +1.55 | 1 | 1 | ||
Green Alliance [lower-alpha 3] | 45,819 | 1.37 | |||||
Call to Australia | 21,646 | 0.65 | |||||
Independent EFF | 9,375 | 0.28 | |||||
Rex Connor Labor | 8,277 | 0.25 | |||||
New Australia | 6,376 | 0.19 | |||||
Democratic Socialist | 5,809 | 0.17 | |||||
Grey Power | 5,034 | 0.15 | |||||
Environment Inds | 4,866 | 0.15 | |||||
Nuclear Disarmament | 3,210 | 0.10 | +0.07 | ||||
Socialist | 1,337 | 0.04 | |||||
Total | 3,354,671 | 51 | |||||
Two-party-preferred vote | |||||||
Labor | 1,706,398 | 51.94 | +1.65 | 2 | |||
Liberal/National Coalition | 1,578,738 | 48.06 | –1.65 | 3 | |||
Invalid/blank votes | 108,134 | 3.1 | –1.5 | ||||
Turnout | 3,462,805 | 95.4 | |||||
Registered voters | 3,630,841 | ||||||
Source: Federal Elections 1990 |
| ||||||||||||||||||||||||||||||||||
All 38 Victorian seats in the Australian House of Representatives and 6 seats in the Australian Senate | ||||||||||||||||||||||||||||||||||
---|---|---|---|---|---|---|---|---|---|---|---|---|---|---|---|---|---|---|---|---|---|---|---|---|---|---|---|---|---|---|---|---|---|---|
|
Party | Votes | % | Swing | Seats | Change | ||
---|---|---|---|---|---|---|---|
Liberal | 1,018,740 | 39.7 | +1.7 | 21 | 9 | ||
National | 154,069 | 6.0 | −0.3 | 3 | |||
Liberal/National Coalition | 1,172,809 | 45.7 | +1.4 | 24 | 9 | ||
Labor | 951,674 | 37.1 | −9.8 | 14 | 10 | ||
Democrats | 319,149 | 12.43 | +5.7 | ||||
Independents | 55,357 | 2.16 | −4.3 | ||||
Call to Australia | 52,554 | 2.05 | |||||
Democratic Socialist | 6,836 | 0.27 | |||||
Citizens Electoral Council | 3,524 | 0.14 | |||||
Democratic Labor | 2,564 | 0.10 | −0.04 | ||||
Socialist | 918 | 0.04 | |||||
Pensioner | 910 | 0.04 | |||||
Against Further Immigration | 835 | 0.03 | |||||
Total | 2,567,139 | 38 | 1 | ||||
Two-party-preferred vote | |||||||
Liberal/National Coalition | 1,347,048 | 52.54 | +5.1 | 24 | 9 | ||
Labor | 1,216,633 | 47.46 | −5.1 | 14 | 10 | ||
Invalid/blank votes | 94,334 | 3.54 | −1.7 | ||||
Turnout | 2,661,464 | 95.68 | |||||
Registered voters | 2,781,547 | ||||||
Source: Federal Elections 1990 |
| ||||||||||||||||||||||||||||||||||
All 24 Queensland seats in the Australian House of Representatives and 6 seats in the Australian Senate | ||||||||||||||||||||||||||||||||||
---|---|---|---|---|---|---|---|---|---|---|---|---|---|---|---|---|---|---|---|---|---|---|---|---|---|---|---|---|---|---|---|---|---|---|
|
Party | Votes | % | Swing | Seats | Change | ||
---|---|---|---|---|---|---|---|
Liberal | 476,560 | 28.51 | 7.49 | 6 | 1 | ||
National | 280,120 | 16.76 | –12.09 | 3 | 3 | ||
Liberal/National Coalition | 756,680 | 45.27 | –4.60 | 9 | 2 | ||
Labor | 695,291 | 41.59 | –3.37 | 15 | 2 | ||
Democrats | 193,817 | 11.59 | 6.71 | ||||
Independent | 11,499 | 0.69 | 0.51 | ||||
Greens | 10,054 | 0.60 | 0.60 | ||||
Democratic Socialist | 2,728 | 0.16 | 0.16 | ||||
Conservative | 1,528 | 0.09 | 0.09 | ||||
Total | 1,671,597 | 24 | |||||
Two-party-preferred vote | |||||||
Labor | 837,508 | 50.19 | +0.87 | 15 | 2 | ||
Liberal/National Coalition | 831,015 | 49.81 | –0.87 | 9 | 2 | ||
Invalid/blank votes | 38,065 | 2.23 | –1.18 | ||||
Turnout | 1,709,662 | 94.71 | |||||
Registered voters | 1,805,141 | ||||||
Source: Federal Elections 1990 |
| ||||||||||||||||||||||||||||||||||
All 14 Western Australia seats in the Australian House of Representatives and 6 seats in the Australian Senate | ||||||||||||||||||||||||||||||||||
---|---|---|---|---|---|---|---|---|---|---|---|---|---|---|---|---|---|---|---|---|---|---|---|---|---|---|---|---|---|---|---|---|---|---|
|
Party | Votes | % | Swing | Seats | Change | ||
---|---|---|---|---|---|---|---|
Liberal | 392,870 | 43.91 | 2.12 | 6 | 2 | ||
National | 21,681 | 2.42 | -4.48 | ||||
Liberal/National Coalition | 414,551 | 46.33 | -2.36 | 4 | 2 | ||
Labor | 316,186 | 35.34 | -12.14 | 9 | 1 | ||
Democrats | 75,197 | 8.40 | +4.97 | ||||
Greens | 67,164 | 7.51 | |||||
Grey Power | 12,043 | 1.35 | |||||
Independents | 5,756 | 0.64 | +0.25 | ||||
Democratic Socialist | 3,336 | 0.37 | |||||
Pensioner | 260 | 0.03 | |||||
Conservative | 206 | 0.02 | |||||
Total | 894,699 | 13 | 1 | ||||
Two-party-preferred vote | |||||||
Labor | 420,816 | 47.13 | -3.78 | 8 | 1 | ||
Liberal/National Coalition | 472,092 | 52.87 | 3.78 | 6 | 2 | ||
Invalid/blank votes | 34,418 | 3.70 | -2.86 | ||||
Turnout | 929,117 | 94.53 | |||||
Registered voters | 982,901 | ||||||
Source: Federal Elections 1990 |
| ||||||||||||||||||||||||||||||||||
All 13 South Australian seats in the Australian House of Representatives and 6 seats in the Australian Senate | ||||||||||||||||||||||||||||||||||
---|---|---|---|---|---|---|---|---|---|---|---|---|---|---|---|---|---|---|---|---|---|---|---|---|---|---|---|---|---|---|---|---|---|---|
|
Party | Votes | % | Swing | Seats | Change | ||
---|---|---|---|---|---|---|---|
Liberal | 381,172 | 42.65 | +0.14 | 6 | 1 | ||
Labor | 339,218 | 37.95 | -6.60 | 7 | 1 | ||
Democrats | 135,546 | 15.17 | +7.38 | ||||
Call to Australia | 22,297 | 2.49 | |||||
Independents | 8,104 | 0.91 | 0.02 | ||||
Grey Power | 3,907 | 0.44 | |||||
Greens | 1,878 | 0.21 | |||||
Democratic Socialist | 1,632 | 0.18 | |||||
Total | 893,754 | 13 | |||||
Two-party-preferred vote | |||||||
Labor | 441,659 | 49.5 | -0.7 | 7 | 1 | ||
Liberal/National Coalition | 450.503 | 50.5 | +0.7 | 6 | 1 | ||
Invalid/blank votes | 34,143 | 3.68 | -3.16 | ||||
Turnout | 927,897 | 96.01 | |||||
Registered voters | 966,431 | ||||||
Source: Federal Elections 1990 |
| ||||||||||||||||||||||||||||||||||
All 5 Tasmanian seats in the Australian House of Representatives and 6 seats in the Australian Senate | ||||||||||||||||||||||||||||||||||
---|---|---|---|---|---|---|---|---|---|---|---|---|---|---|---|---|---|---|---|---|---|---|---|---|---|---|---|---|---|---|---|---|---|---|
|
Party | Votes | % | Swing | Seats | Change | |
---|---|---|---|---|---|---|
Liberal | 140,722 | 48.61 | −2.44 | 4 | ||
Labor | 115,053 | 39.74 | −3.25 | 1 | ||
Democrats | 24,876 | 8.59 | +2.63 | |||
United Tasmania | 6,367 | 2.20 | ||||
Independent | 2,159 | 0.75 | ||||
Democratic Socialist | 327 | 0.11 | ||||
Total | 289,504 | 5 | ||||
Two-party-preferred vote | ||||||
Liberal | 138,556 | 52.10 | −1.00 | 4 | ||
Labor | 150,709 | 47.90 | +1.00 | 1 | ||
Invalid/blank votes | 9,774 | 3.27 | −1.68 | |||
Turnout | 299,278 | 96.5 | ||||
Registered voters | 300,763 | |||||
Source: Federal Elections 1990 |
| ||||||||||||||||||||||||||||||||||
Both Australian Capital Territory seats in the Australian House of Representatives and both seats in the Australian Senate | ||||||||||||||||||||||||||||||||||
---|---|---|---|---|---|---|---|---|---|---|---|---|---|---|---|---|---|---|---|---|---|---|---|---|---|---|---|---|---|---|---|---|---|---|
|
Party | Votes | % | Swing | Seats | Change | |
---|---|---|---|---|---|---|
Labor | 71,830 | 44.88 | -9.04 | 2 | ||
Liberal | 55,755 | 34.83 | 4.55 | |||
Democrats | 23,091 | 14.43 | 7.59 | |||
Green Democratic | 6,069 | 3.79 | 0.00 | |||
Nuclear Disarmament | 2,368 | 1.48 | -3.19 | |||
Independent | 949 | 0.59 | -0.96 | |||
Total | 160,062 | 2 | ||||
Two-party-preferred vote | ||||||
Labor | 93,498 | 58.54 | -4.71 | 2 | ||
Liberal | 66,206 | 41.46 | 4.71 | 0 | ||
Invalid/blank votes | 4,871 | 2.95 | -0.53 | |||
Turnout | 164,933 | 95.78 | ||||
Registered voters | 172,200 | |||||
Source: Psephos Adam Carr's Election Archive 1990 |
| ||||||||||||||||||||||||||||||||||
The one Northern Territory seat in the Australian House of Representatives and both seats in the Australian Senate | ||||||||||||||||||||||||||||||||||
---|---|---|---|---|---|---|---|---|---|---|---|---|---|---|---|---|---|---|---|---|---|---|---|---|---|---|---|---|---|---|---|---|---|---|
|
Party | Candidate | Votes | % | ±% | |
---|---|---|---|---|---|
Labor | Warren Snowdon | 34,106 | 50.0 | +3.1 | |
Country Liberal | Helen Galton | 27,668 | 40.5 | +4.5 | |
Independent | Don Beaton | 1,900 | 2.8 | +2.8 | |
Independent | Bob Liddle | 1,427 | 2.1 | +2.1 | |
Independent | Tig Donnellan | 1,380 | 2.0 | +2.0 | |
Independent | Strider | 975 | 1.4 | +1.4 | |
Independent | Ron Sterry | 801 | 1.2 | +1.2 | |
Total formal votes | 68,257 | 96.6 | |||
Informal votes | 2,387 | 3.4 | |||
Turnout | 70,644 | 89.4 | |||
Two-party-preferred result | |||||
Labor | Warren Snowdon | 37,498 | 55.0 | +2.8 | |
Country Liberal | Helen Galton | 30,650 | 45.0 | -2.8 | |
Labor hold | Swing | +2.8 |
The Australian Greens, commonly known as The Greens, are a confederation of Green state and territory political parties in Australia. As of the 2022 federal election, the Greens are the third largest political party in Australia by vote and the fourth largest by elected representation. The leader of the party is Adam Bandt, with Mehreen Faruqi serving as deputy leader. Larissa Waters currently holds the role of Senate leader.
The Greens (WA) is a member party of the Australian Greens in Western Australia. The Greens (WA) was formed following the merger of the Western Australian Green Party with the Green Earth Alliance composed of the Vallentine Peace Group and Alternative Coalition in 1990. The Party became officially affiliated with the Australian Greens in 2003.
The 1990 Australian federal election was held in Australia on 24 March 1990. All 148 seats in the House of Representatives and 40 seats in the 76-member Senate were up for election. The incumbent Australian Labor Party led by Bob Hawke defeated the opposition Liberal Party of Australia led by Andrew Peacock with coalition partner the National Party of Australia led by Charles Blunt despite losing the nationwide popular and two-party-preferred vote. The election saw the reelection of a Hawke government, the fourth successive term.
This is a list of electoral results for the Division of Bennelong in Australian federal elections from the electorate's creation in 1949 until the present.
This is a list of electoral results for the Division of Bradfield in Australian federal elections from the electorate's creation in 1949 until the present.
This is a list of electoral results for the Division of Calare in Australian federal elections from the division's creation in 1906 until the present.
This is a list of electoral results for the Division of Cunningham in Australian federal elections from the division's creation in 1949 until the present.
This is a list of electoral results for the Division of Kingsford Smith in Australian federal elections from the division's creation in 1949 until the present.
This is a list of electoral results for the Division of Lyne in Australian federal elections from the electorate's creation in 1949 until the present.
This is a list of electoral results for the Division of Mackellar in Australian federal elections from the division's creation in 1949 until the present.
This is a list of electoral results for the Division of Mitchell in Australian federal elections from the division's creation in 1949 until the present.
Francis Clarke was an Australian politician.
This is a list of electoral results for the Division of Newcastle in Australian federal elections from the electorate's creation in 1901 until the present.
This is a list of electoral results for the Division of North Sydney in Australian federal elections from the electorate's creation in 1901 until the present.
This is a list of electoral results for the Division of Parramatta in Australian federal elections from the division's creation in 1901 until the present.
John Archibald McCallum was an Australian school teacher and politician, Senator for New South Wales.
The following tables show results for the Australian House of Representatives at the 1998 federal election held on 3 October 1998.
This is a list of electoral division results for the Australian 1990 federal election in the state of New South Wales.
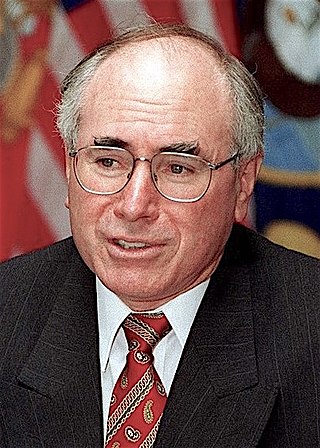
The following tables show results for the Australian House of Representatives at the 1996 federal election held on 2 March 1996.
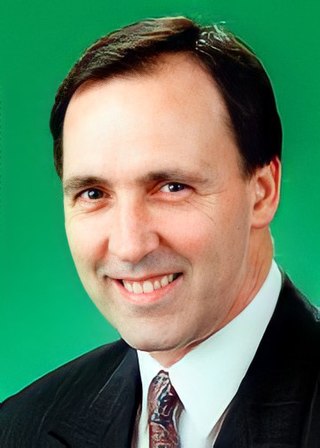
The following tables show results for the Australian House of Representatives at the 1993 federal election held on 13 March 1993.