Results of the 1925 Australian federal election (House of Representatives)

Last updated

Australian federal election, 14 November 1925 [1]
House of Representatives
<< 19221928 >>

Contents

Enrolled voters3,302,016
Votes cast2,987,200 Turnout 91.39+32.03
Informal votes70,562Informal2.36–2.15
Summary of votes by party
PartyPrimary votes %SwingSeatsChange
  Labor 1,313,62745.04%+2.74%23– 6
  Nationalist 1,238,39742.46%+7.23%37+ 11
  Country 313,36310.74%–1.82%13– 1
  Independent 51,2511.76%–2.80%1± 0
Total2,916,638  75 

This is a list of electoral division results for the Australian 1925 federal election.

New South Wales

Barton

1925 Australian federal election: Barton
PartyCandidateVotes%±%
Nationalist Thomas Ley 26,17251.0+8.6
Labor Frederick McDonald 25,11249.0−8.6
Total formal votes51,28498.8
Informal votes6321.2
Turnout 51,91695.4
Nationalist gain from Labor Swing +8.6

Calare

1925 Australian federal election: Calare
PartyCandidateVotes%±%
Nationalist Sir Neville Howse 21,64559.1+24.5
Labor William Webster 14,49939.6−2.4
Independent William Southwick4611.3+1.3
Total formal votes36,60597.8
Informal votes8302.2
Turnout 37,43591.9
Two-party-preferred result
Nationalist Sir Neville Howse 59.8+4.5
Labor William Webster 40.2−4.5
Nationalist hold Swing +4.5

Cook

1925 Australian federal election: Cook
PartyCandidateVotes%±%
Labor Edward Riley 25,76467.8+2.8
Nationalist Arthur Philip12,22932.2+11.1
Total formal votes37,99398.0
Informal votes7642.0
Turnout 38,75792.2
Labor hold Swing −6.9

Cowper

1925 Australian federal election: Cowper
PartyCandidateVotes%±%
Country Earle Page 24,57170.0+2.7
Labor Lockhart Easton10,51030.0+30.0
Total formal votes35,08198.5
Informal votes5441.5
Turnout 35,62592.8
Country hold Swing +2.7

Dalley

1925 Australian federal election: Dalley
PartyCandidateVotes%±%
Labor William Mahony 24,45564.1−2.6
Nationalist James Thomson13,70235.9+11.0
Total formal votes38,15797.9
Informal votes8012.1
Turnout 38,95892.0
Labor hold Swing −8.9

Darling

1925 Australian federal election: Darling
PartyCandidateVotes%±%
Labor Arthur Blakeley 20,96565.5+20.2
Nationalist John Dowling11,04334.5+2.0
Total formal votes32,00897.6
Informal votes7772.4
Turnout 32,78580.8
Labor hold Swing +0.4

East Sydney

1925 Australian federal election: East Sydney
PartyCandidateVotes%±%
Labor John West 18,82253.8-5.3
Nationalist Richard Orchard 16,16946.2+5.3
Total formal votes34,99198.0
Informal votes7292.0
Turnout 35,72085.6
Labor hold Swing -5.3

Eden-Monaro

1925 Australian federal election: Eden-Monaro
PartyCandidateVotes%±%
Nationalist Austin Chapman 23,37164.6+3.5
Labor Charles Morgan 12,82835.4-3.5
Total formal votes36,19998.3
Informal votes6101.7
Turnout 36,80991.4
Nationalist hold Swing +3.5

Gwydir

1925 Australian federal election: Gwydir
PartyCandidateVotes%±%
Labor Lou Cunningham 15,53145.5-0.8
Country Aubrey Abbott 10,50930.8-5.6
Nationalist Joseph McGowan8,08023.7+6.4
Total formal votes34,12097.5
Informal votes8812.5
Turnout 35,00188.1
Two-party-preferred result
Country Aubrey Abbott 18,12453.1+3.2
Labor Lou Cunningham 15,99646.9-3.2
Country gain from Labor Swing +3.2

Hume

1925 Australian federal election: Hume
PartyCandidateVotes%±%
Labor Parker Moloney 18,86050.4−2.5
Nationalist Angus Campbell12,52933.5+5.9
Country Victor Miers6,01116.1−3.4
Total formal votes37,40098.4
Informal votes6051.6
Turnout 38,00590.7
Two-party-preferred result
Labor Parker Moloney 52.0−2.9
Nationalist Angus Campbell48.0+2.9
Labor hold Swing −2.9

Hunter

1925 Australian federal election: Hunter
PartyCandidateVotes%±%
Labor Matthew Charlton 31,24471.3-28.7
Nationalist Alfred Horsfall 12,55028.7+28.7
Total formal votes43,79498.2
Informal votes7911.8
Turnout 44,58592.2
Labor hold Swing -28.7

Lang

1925 Australian federal election: Lang
PartyCandidateVotes%±%
Nationalist Sir Elliot Johnson 22,75655.9+6.6
Labor George Smith17,94144.1+2.4
Total formal votes40,69798.5
Informal votes5241.5
Turnout 41,32185.7
Nationalist hold Swing +1.5

Macquarie

1925 Australian federal election: Macquarie
PartyCandidateVotes%±%
Nationalist Arthur Manning 18,45651.3+7.0
Labor Ben Chifley 17,55348.7+0.7
Total formal votes36,00998.4
Informal votes5881.6
Turnout 36,59792.4
Nationalist hold Swing +1.1

Martin

1925 Australian federal election: Martin
PartyCandidateVotes%±%
Nationalist Herbert Pratten 31,73064.76+64.76
Labor Henry McDicken 17,26335.24+35.24
Total formal votes48,99398.03
Informal votes9861.97
Turnout 49,97993.84
Nationalist hold Swing -35.24

New England

1925 Australian federal election: New England
PartyCandidateVotes%±%
Country Victor Thompson 20,89658.5+22.9
Labor John Heiss14,82441.5+6.1
Total formal votes35,72097.3
Informal votes9872.7
Turnout 36,70789.1
Country hold Swing +0.0

Newcastle

1925 Australian federal election: Newcastle
PartyCandidateVotes%±%
Labor David Watkins 27,29162.5+7.9
Nationalist George Waller16,37837.5+12.9
Total formal votes43,66998.2
Informal votes8051.8
Turnout 44,47492.0
Labor hold Swing -6.9

North Sydney

1925 Australian federal election: North Sydney
PartyCandidateVotes%±%
Nationalist Billy Hughes 33,85571.5+13.3
Labor Joe Lamaro 13,50028.5+28.5
Total formal votes47,35598.8
Informal votes5811.2
Turnout 47,93692.9
Nationalist hold Swing +13.3

Parkes

1925 Australian federal election: Parkes
PartyCandidateVotes%±%
Nationalist Charles Marr 28,32062.8+1.0
Labor William Dunn16,80837.2-1.0
Total formal votes45,12898.3
Informal votes7881.7
Turnout 45,91690.2
Nationalist hold Swing +1.0

Parramatta

1925 Australian federal election: Parramatta
PartyCandidateVotes%±%
Nationalist Eric Bowden 30,30965.7+0.3
Labor James Stone15,80934.3-0.3
Total formal votes46,11898.1
Informal votes8961.9
Turnout 47,01491.9
Nationalist hold Swing +0.3

Reid

1925 Australian federal election: Reid
PartyCandidateVotes%±%
Labor Percy Coleman 37,02754.7+0.2
Nationalist Percy Shortland22,34345.3+5.2
Total formal votes49,37098.1
Informal votes9441.9
Turnout 50,31492.6
Labor hold Swing -3.9

Richmond

1925 Australian federal election: Richmond
PartyCandidateVotes%±%
Country Roland Green 11,75531.8+5.2
Labor Harry Green11,25730.4+30.4
Country John Williams7,05119.1+19.1
Nationalist Joseph Greene6,93518.7-26.1
Total formal votes36,99897.2
Informal votes1,0572.8
Turnout 38,05588.3
Two-party-preferred result
Country Roland Green 25,05667.7+14.4
Labor Harry Green11,94232.3+32.3
Country hold Swing +14.4

Riverina

1925 Australian federal election: Riverina
PartyCandidateVotes%±%
Country William Killen 20,49054.3+16.2
Labor James Hoad 17,24945.7+4.6
Total formal votes37,73997.9
Informal votes7942.1
Turnout 38,53386.1
Country hold Swing +0.0

Robertson

1925 Australian federal election: Robertson
PartyCandidateVotes%±%
Nationalist Sydney Gardner 22,77762.6+24.6
Labor Gordon Cross13,58637.4+2.8
Total formal votes36,36397.6
Informal votes8992.4
Turnout 37,26292.5
Nationalist hold Swing +0.8

South Sydney

1925 Australian federal election: South Sydney
PartyCandidateVotes%±%
Labor Edward Riley 22,39351.1-7.8
Nationalist George Baker21,41148.9+12.4
Total formal votes43,80498.6
Informal votes6221.4
Turnout 44,42686.3
Labor hold Swing -10.6

Warringah

1925 Australian federal election: Warringah
PartyCandidateVotes%±%
Nationalist Sir Granville Ryrie 34,13280.1-19.9
Labor Thomas Conway8,45519.9+19.9
Total formal votes42,58798.7
Informal votes5461.3
Turnout 43,13392.2
Nationalist hold Swing -19.9

Wentworth

1925 Australian federal election: Wentworth
PartyCandidateVotes%±%
Nationalist Walter Marks 27,94564.4+14.7
Labor William Crick15,43635.6+3.0
Total formal votes43,38198.2
Informal votes7901.8
Turnout 44,17187.7
Nationalist hold Swing +2.5

Werriwa

1925 Australian federal election: Werriwa
PartyCandidateVotes%±%
Labor Bert Lazzarini 20,79953.7+0.6
Nationalist Sir Charles Rosenthal 17,90446.3+8.3
Total formal votes38,70398.4
Informal votes6331.6
Turnout 39,33692.2
Labor hold Swing −0.2

West Sydney

1925 Australian federal election: West Sydney
PartyCandidateVotes%±%
Labor William Lambert 24,60474.0+0.1
Nationalist Lindsay Thompson8,63426.0+26.0
Total formal votes33,23897.4
Informal votes8852.6
Turnout 34,12387.0
Labor hold Swing -1.4

Victoria

Balaclava

1925 Australian federal election: Balaclava
PartyCandidateVotes%±%
Nationalist William Watt 35,45869.7−30.3
Labor John McKellar15,37930.3+30.3
Total formal votes50,83798.7
Informal votes6541.3
Turnout 51,49195.3
Nationalist gain from Liberal Swing −30.3

Ballaarat

1925 Australian federal election: Ballaarat
PartyCandidateVotes%±%
Labor Charles McGrath 19,12151.3+0.9
Nationalist Thomas Ryan 18,14748.7+12.9
Total formal votes37,26899.1
Informal votes3410.9
Turnout 37,60995.2
Labor hold Swing −0.4

Batman

1925 Australian federal election: Batman
PartyCandidateVotes%±%
Labor Frank Brennan 32,42759.0+8.0
Nationalist Samuel Dennis 22,51341.0+18.1
Total formal votes54,94098.6
Informal votes7441.4
Turnout 55,68492.9
Labor hold Swing +5.7

Bendigo

1925 Australian federal election: Bendigo
PartyCandidateVotes%±%
Nationalist Geoffry Hurry 20,15453.5+21.9
Labor Thomas Jude17,50746.5+3.4
Total formal votes37,66198.9
Informal votes4001.1
Turnout 38,06194.6
Nationalist hold Swing +1.8

Bourke

1925 Australian federal election: Bourke
PartyCandidateVotes%±%
Labor Frank Anstey 32,32562.5−7.6
Nationalist Edward Price19,39937.5+7.6
Total formal votes51,72498.7
Informal votes7031.3
Turnout 52,42794.7
Labor hold Swing −7.6

Corangamite

1925 Australian federal election: Corangamite
PartyCandidateVotes%±%
Country William Gibson 21,55755.5+27.0
Labor William Nicol17,29744.5+0.0
Total formal votes38,85498.7
Informal votes5021.3
Turnout 39,35692.2
Country hold Swing +1.6

Corio

1925 Australian federal election: Corio
PartyCandidateVotes%±%
Nationalist John Lister 24,77556.7+5.9
Labor Peter Randles18,91543.3−5.9
Total formal votes43,69098.8
Informal votes5391.2
Turnout 44,22992.7
Nationalist hold Swing +5.9

Echuca

1925 Australian federal election: Echuca
PartyCandidateVotes%±%
Country William Hill 25,32165.3-5.0
Labor Patrick O'Hanlon13,45134.7+34.7
Total formal votes38,77298.5
Informal votes5761.5
Turnout 39,34893.4
Country hold Swing -5.0

Fawkner

1925 Australian federal election: Fawkner
PartyCandidateVotes%±%
Nationalist George Maxwell 26,02859.4+7.2
Labor Alfred Foster 17,80940.6-0.8
Total formal votes43,83798.8
Informal votes5431.2
Turnout 44,38092.7
Nationalist hold Swing +1.4

Flinders

1925 Australian federal election: Flinders
PartyCandidateVotes%±%
Nationalist Stanley Bruce 33,17362.7+7.1
Labor Roy Beardsworth19,17337.3+37.3
Total formal votes52,92198.4
Informal votes8681.6
Turnout 53,78993.4
Nationalist hold Swing +7.1

Gippsland

1925 Australian federal election: Gippsland
PartyCandidateVotes%±%
Country Thomas Paterson 18,42344.6+5.2
Labor James Bermingham13,41732.5+5.1
Ind. Nationalist George Wise 9,42822.8+22.8
Total formal votes41,26897.1
Informal votes1,2402.9
Turnout 42,50893.9
Two-party-preferred result
Country Thomas Paterson 26,05563.1+0.2
Labor James Bermingham15,21336.9+36.9
Country hold Swing +0.2

Henty

1925 Australian federal election: Henty
PartyCandidateVotes%±%
Nationalist Henry Gullett 31,07751.5-28.7
Labor Edward Stewart17,93029.7+9.9
Ind. Nationalist Donald Mackinnon 11,31818.8+18.8
Total formal votes60,32598.5
Informal votes9091.5
Turnout 61,23494.6
Two-party-preferred result
Nationalist Henry Gullett 60.9-39.1
Labor Edward Stewart39.1+39.1
Nationalist hold Swing -39.1

Indi

1925 Australian federal election: Indi
PartyCandidateVotes%±%
Country Robert Cook 21,16156.7+17.4
Labor David Black16,15343.3+8.3
Total formal votes37,31498.5
Informal votes5501.5
Turnout 37,86493.7
Country hold Swing −6.5

Kooyong

1925 Australian federal election: Kooyong
PartyCandidateVotes%±%
Nationalist John Latham 36,95467.7+20.3
Labor Lionel Batten17,66432.3+13.5
Total formal votes54,61898.7
Informal votes7451.3
Turnout 55,36394.5
Nationalist gain from Liberal Swing +18.3

Maribyrnong

1925 Australian federal election: Maribyrnong
PartyCandidateVotes%±%
Labor James Fenton 28,62159.5-3.7
Nationalist Thomas White 19,48340.5+3.7
Total formal votes48,10499.0
Informal votes4961.0
Turnout 48,60093.6
Labor hold Swing -3.7

Melbourne

1925 Australian federal election: Melbourne
PartyCandidateVotes%±%
Labor William Maloney 26,60767.0-10.2
Nationalist William Hendry13,08233.0+10.2
Total formal votes39,68997.7
Informal votes9212.3
Turnout 40,61087.2
Labor hold Swing -10.2

Melbourne Ports

1925 Australian federal election: Melbourne Ports
PartyCandidateVotes%±%
Labor James Mathews 29,41667.7-5.4
Nationalist Frank Wilcher14,03532.3+5.4
Total formal votes43,45198.2
Informal votes7921.8
Turnout 44,24389.7
Labor hold Swing -5.4

Wannon

1925 Australian federal election: Wannon
PartyCandidateVotes%±%
Nationalist Arthur Rodgers 16,67842.5+8.8
Labor John McNeill 16,61042.3+1.2
Country David Anderson5,99515.3-9.9
Total formal votes39,28398.4
Informal votes6401.6
Turnout 39,92395.1
Two-party-preferred result
Nationalist Arthur Rodgers 21,21854.0+4.8
Labor John McNeill 18,06546.0-4.8
Nationalist gain from Labor Swing +4.8

Wimmera

1925 Australian federal election: Wimmera
PartyCandidateVotes%±%
Independent Country Percy Stewart 32,12877.8+77.8
Independent Lucas de Garis9,15422.2+22.2
Total formal votes41,28296.9
Informal votes1,3123.1
Turnout 42,59487.7
Independent Country gain from Country Swing +77.8

Yarra

1925 Australian federal election: Yarra
PartyCandidateVotes%±%
Labor James Scullin 31,45174.8-3.2
Nationalist Marcus Towler10,61025.2+3.2
Total formal votes42,06197.8
Informal votes9642.2
Turnout 43,02591.8
Labor hold Swing -3.2

Queensland

Brisbane

1925 Australian federal election: Brisbane
PartyCandidateVotes%±%
Nationalist Donald Cameron 20,90255.1+3.1
Labor John Fihelly 16,71144.1−3.9
Independent Labor Herbert Collie3220.8+0.8
Total formal votes37,93597.3
Informal votes1,0352.7
Turnout 38,97090.8
Two-party-preferred result
Nationalist Donald Cameron 55.5+3.5
Labor John Fihelly 44.5−3.5
Nationalist hold Swing +3.5

Capricornia

1925 Australian federal election: Capricornia
PartyCandidateVotes%±%
Labor Frank Forde 22,52451.9+0.0
Country William Doherty20,84648.1+41.9
Total formal votes543,37097.2
Informal votes1,2612.8
Turnout 44,63191.1
Labor hold Swing −0.6

Darling Downs

1925 Australian federal election: Darling Downs
PartyCandidateVotes%±%
Nationalist Sir Littleton Groom 23,64863.1+4.5
Labor Duncan McInnes13,80336.9-4.5
Total formal votes37,45197.2
Informal votes1,0632.8
Turnout 38,51493.1
Nationalist hold Swing +4.5

Herbert

1925 Australian federal election: Herbert
PartyCandidateVotes%±%
Nationalist Lewis Nott 22,38550.3-1.4
Labor Ted Theodore 22,11749.7+1.4
Total formal votes44,50295.3
Informal votes2,1884.7
Turnout 46,69090.2
Nationalist hold Swing -1.4

Kennedy

1925 Australian federal election: Kennedy
PartyCandidateVotes%±%
Nationalist Grosvenor Francis unopposed
Nationalist gain from Labor Swing

Lilley

1925 Australian federal election: Lilley
PartyCandidateVotes%±%
Nationalist George Mackay 27,96664.7-0.5
Labor John Mattingley15,22835.3+35.3
Total formal votes43,19496.8
Informal votes1,4453.2
Turnout 44,63993.4
Nationalist hold Swing -0.5

Maranoa

1925 Australian federal election: Maranoa
PartyCandidateVotes%±%
Country James Hunter 14,46352.6-1.8
Labor Samuel Brassington 13,02447.4+1.8
Total formal votes27,48797.1
Informal votes8242.9
Turnout 28,31183.8
Country hold Swing -1.8

Moreton

1925 Australian federal election: Moreton
PartyCandidateVotes%±%
Nationalist Josiah Francis 25,65063.2+18.7
Labor Horace Lee14,90736.8-1.4
Total formal votes40,55796.8
Informal votes1,3253.2
Turnout 41,88294.1
Nationalist hold Swing +3.7

Oxley

1925 Australian federal election: Oxley
PartyCandidateVotes%±%
Nationalist James Bayley 25,42155.7+2.4
Labor James Sharpe 20,23344.3-2.4
Total formal votes45,65496.5
Informal votes1,6753.5
Turnout 47,32992.2
Nationalist hold Swing +2.4

Wide Bay

1925 Australian federal election: Wide Bay
PartyCandidateVotes%±%
Nationalist Edward Corser 25,87764.5+26.1
Labor Andrew Thompson 14,23135.5+1.5
Total formal votes40,10896.7
Informal votes1,3483.3
Turnout 41,45691.8
Nationalist hold Swing +4.0

South Australia

Adelaide

1925 Australian federal election: Adelaide
PartyCandidateVotes%±%
Labor George Edwin Yates 19,69350.9−0.8
Nationalist George McLeay 19,01849.1+29.2
Total formal votes38,71195.2
Informal votes1,9534.8
Turnout 40,66488.4
Labor hold Swing −2.7

Angas

1925 Australian federal election: Angas
PartyCandidateVotes%±%
Nationalist Walter Parsons 20,42850.3+50.3
Labor Moses Gabb 20,17849.7−8.3
Total formal votes40,60696.1
Informal votes1,6403.9
Turnout 42,24694.2
Nationalist gain from Labor Swing +8.3

Barker

1925 Australian federal election: Barker
PartyCandidateVotes%±%
Nationalist Malcolm Cameron 24,35661.6+61.6
Labor Alwyn Roberts15,20938.4−4.7
Total formal votes39,56595.2
Informal votes1,9934.8
Turnout 41,55893.7
Nationalist gain from Liberal Swing +9.3

Boothby

1925 Australian federal election: Boothby
PartyCandidateVotes%±%
Nationalist Jack Duncan-Hughes 23,60257.6+36.4
Labor Harry Kneebone 17,40942.4+3.0
Total formal votes41,01196.5
Informal votes1,4833.5
Turnout 42,49493.8
Nationalist gain from Liberal Swing +2.9

Grey

1925 Australian federal election: Grey
PartyCandidateVotes%±%
Labor Andrew Lacey 16,42752.6-1.1
Nationalist John Lyons 14,78047.4+1.1
Total formal votes31,20795.9
Informal votes1,3184.1
Turnout 32,52591.8
Labor hold Swing -1.1

Hindmarsh

1925 Australian federal election: Hindmarsh
PartyCandidateVotes%±%
Labor Norman Makin 29,09765.2-3.4
Nationalist John Verran 15,50434.8+3.4
Total formal votes44,60195.6
Informal votes2,0584.4
Turnout 46,65994.3
Labor hold Swing -3.4

Wakefield

1925 Australian federal election: Wakefield
PartyCandidateVotes%±%
Nationalist Richard Foster 21,84664.8+64.8
Labor Even George 11,84235.2-1.5
Total formal votes33,68895.0
Informal votes1,7735.0
Turnout 35,46193.3
Nationalist gain from Liberal Swing +9.5

Western Australia

Forrest

1925 Australian federal election: Forrest
PartyCandidateVotes%±%
Country John Prowse 21,76060.9-18.6
Labor Thomas Lowry13,97639.1+39.1
Total formal votes35,73696.5
Informal votes1,3013.5
Turnout 37,03789.9
Country hold Swing -18.6

Fremantle

1925 Australian federal election: Fremantle
PartyCandidateVotes%±%
Independent William Watson 20,56858.1+17.5
Labor John Curtin 14,81241.9+2.0
Total formal votes35,38097.6
Informal votes8772.4
Turnout 36,25792.2
Independent hold Swing +1.2

Kalgoorlie

1925 Australian federal election: Kalgoorlie
PartyCandidateVotes%±%
Labor Albert Green 14,24557.6+0.2
Nationalist John Mullany 10,47642.4-0.2
Total formal votes24,72197.2
Informal votes7172.8
Turnout 25,43886.0
Labor hold Swing +0.2

Perth

1925 Australian federal election: Perth
PartyCandidateVotes%±%
Nationalist Edward Mann 21,51762.8-3.0
Labor Dick Lane12,76837.2+3.0
Total formal votes34,28596.7
Informal votes1,1613.3
Turnout 35,44691.3
Nationalist hold Swing +3.9

Swan

1925 Australian federal election: Swan
PartyCandidateVotes%±%
Country Henry Gregory 24,97866.2+66.2
Labor Ben Davies12,77333.8+33.8
Total formal votes37,75196.7
Informal votes1,2693.3
Turnout 39,02088.4
Country hold Swing -33.8

Tasmania

Bass

1925 Australian federal election: Bass
PartyCandidateVotes%±%
Nationalist Syd Jackson 10,92957.0+6.8
Labor Harold Holmes5,65429.5+8.0
Labor John Swain2,58213.5+13.5
Total formal votes19,16594.1
Informal votes1,1925.9
Turnout 29,35788.5
Two-party-preferred result
Nationalist Syd Jackson 58.3+4.7
Labor Harold Holmes41.7−4.7
Nationalist hold Swing +4.7

Darwin

1925 Australian federal election: Darwin
PartyCandidateVotes%±%
Nationalist George Bell 9,68248.1+17.5
Labor Henry Lane 7,54137.5+37.5
Nationalist Hubert Nichols 2,88614.4+14.4
Total formal votes20,10995.5
Informal votes9394.5
Turnout 21,04890.7
Two-party-preferred result
Nationalist George Bell 12,16460.5+10.9
Labor Henry Lane 7,94539.5+39.5
Nationalist gain from Country Swing +10.9

Denison

1925 Australian federal election: Denison
PartyCandidateVotes%±%
Nationalist Sir John Gellibrand 10,78252.2+0.2
Labor David O'Keefe 9,88247.8+1.3
Total formal votes20,66497.9
Informal votes4502.1
Turnout 21,11488.5
Nationalist gain from Labor Swing +2.6

Franklin

1925 Australian federal election: Franklin
PartyCandidateVotes%±%
Nationalist Alfred Seabrook 6,10731.5+30.2
Nationalist William McWilliams 5,87930.3+30.3
Labor Eric Ogilvie 5,83630.1-5.5
Labor Douglas Thompson1,5748.1+8.1
Total formal votes19,39693.6
Informal votes1,3256.4
Turnout 20,72186.5
Two-party-preferred result
Nationalist Alfred Seabrook 10,78755.6-0.7
Labor Eric Ogilvie 8,60944.4+0.7
Nationalist hold Swing -0.7

Wilmot

1925 Australian federal election: Wilmot
PartyCandidateVotes%±%
Labor Jens Jensen 7,11838.7+6.5
Country Llewellyn Atkinson 5,44829.6-14.3
Nationalist Percy Best 3,13417.1+7.8
Nationalist Atherfield Newman2,68114.6+14.6
Total formal votes18,38194.3
Informal votes1,1215.7
Turnout 19,50289.7
Two-party-preferred result
Country Llewellyn Atkinson 10,74657.0-4.2
Labor Jens Jensen 7,90543.0+4.2
Country hold Swing -4.2

Northern Territory

Northern Territory

1925 Australian federal election: Northern Territory
PartyCandidateVotes%±%
Labor Harold Nelson 85362.4+25.0
Nationalist Charles Story51337.6+37.6
Total formal votes1,36698.2
Informal votes251.8
Turnout 1,39179.1
Labor hold Swing +12.0

See also

Related Research Articles

The Liberal Party was a parliamentary party in Australian federal politics between 1909 and 1917. The party was founded under Alfred Deakin's leadership as a merger of the Protectionist Party and Anti-Socialist Party, an event known as the Fusion.

<span class="mw-page-title-main">Division of Barton</span> Australian federal electoral division

The Division of Barton is an Australian electoral division in the state of New South Wales.

<span class="mw-page-title-main">Littleton Groom</span> Australian politician

Sir Littleton Ernest Groom KCMG KC was an Australian politician. He held ministerial office under four prime ministers between 1905 and 1925, and subsequently served as Speaker of the House of Representatives from 1926 to 1929.

<span class="mw-page-title-main">Lang Labor</span> Political party in Australia

Lang Labor was a faction of the Australian Labor Party (ALP) consisting of the supporters of Jack Lang, who served two terms as Premier of New South Wales and was the party's state leader from 1923 to 1939. It controlled the New South Wales branch of the ALP throughout most of the 1920s and 1930s. The faction broke away to form separate parliamentary parties on several occasions and stood competing candidates against the ALP in state and federal elections.

The Country and Progressive National Party was a short-lived conservative political party in the Australian state of Queensland. Formed in 1925, it combined the state's conservative forces in a single party and held office between 1929 and 1932 under the leadership of Arthur Edward Moore. Following repeated election defeat it split into separate rural and urban wings in 1936.
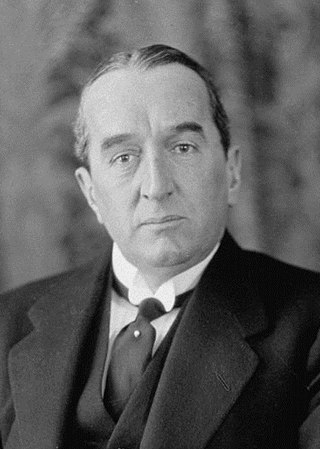
<span class="mw-page-title-main">1925 Australian federal election</span> Australian federal election

The 1925 Australian federal election was held in Australia on 14 November 1925. All 75 seats in the House of Representatives and 22 of the 36 seats in the Senate were up for election. The incumbent Nationalist–Country coalition, led by Prime Minister Stanley Bruce, defeated the opposition Labor Party led by Matthew Charlton in a landslide. This was the first time any party had won a fourth consecutive federal election.

<span class="mw-page-title-main">1922 Australian federal election</span> Australian federal election

The 1922 Australian federal election was held in Australia on 16 December 1922. All 75 seats in the House of Representatives, and 19 of the 36 seats in the Senate were up for election. The incumbent Nationalist Party, led by Prime Minister Billy Hughes lost its majority. However, the opposition Labor Party led by Matthew Charlton did not take office as the Nationalists sought a coalition with the fledgling Country Party led by Earle Page. The Country Party made Hughes's resignation the price for joining, and Hughes was replaced as Nationalist leader by Stanley Bruce.

<span class="mw-page-title-main">1928 Tasmanian state election</span>

The 1928 Tasmanian state election was held on Wednesday, 30 May 1928 in the Australian state of Tasmania to elect 30 members of the Tasmanian House of Assembly. The election used the Hare-Clark proportional representation system — six members were elected from each of five electorates.

This is a list of members of the Western Australian Legislative Assembly between the 1939 election and the 1943 election, together known as the 17th Parliament.

This is a list of electoral results for the Division of Warringah in Australian federal elections from the division's creation in 1922 until the present.

This is a list of electoral results for the Division of Dalley in Australian federal elections from the division's creation in 1901 until its abolition in 1969.

Members of the New South Wales Legislative Assembly who served in the 27th parliament of New South Wales held their seats from 1925 to 1927. They were elected at the 1925 state election on 30 May 1925. The Speaker was James Dooley.
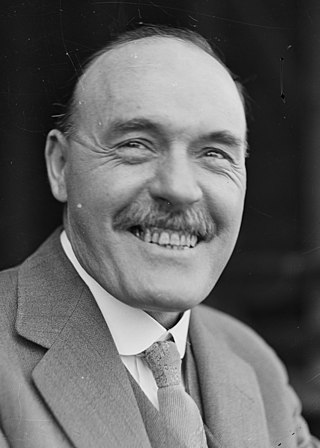
<span class="mw-page-title-main">1925 New South Wales state election</span> State election for New South Wales, Australia in May 1925

The 1925 New South Wales state election was held on 30 May 1925. This election was for all of the 90 seats in the 27th New South Wales Legislative Assembly and was conducted in multiple-member constituencies using the Hare Clark single transferable vote. The 26th parliament of New South Wales was dissolved on 18 April 1925 by the Governor, Sir Dudley de Chair, on the advice of the Premier Sir George Fuller.

This is a list of members of the South Australian House of Assembly from 1924 to 1927, as elected at the 1924 state election:

<span class="mw-page-title-main">Tasmanian National Party</span> Political party in Australia

The Tasmanian Nationals are a political party in the Australian state of Tasmania, aligned with the National Party of Australia. The party is not currently registered with the Tasmanian Electoral Commission, and is not separately registered with the Australian Electoral Commission, unlike the other state branches of the Nationals.

The National Party, known as the United Party from 1923, was a political party in the Australian state of Queensland from 1917 to 1925. Although allied with the federal Nationalist Party, it had different origins in state politics. It sought to combine the state's Liberal Party with the Country Party but the latter soon withdrew. In 1923 the party sought a further unification with the Country Party but only attracted a few recruits. Then in 1925 it merged with the Country Party, initially as the Country Progressive Party with a few members left out and then they were absorbed into the renamed Country and Progressive National Party.

This is a list of electoral division results for the Australian 1922 federal election.

St George, an electoral district of the Legislative Assembly in the Australian state of New South Wales was created in 1894 and abolished in 1904.

The Australian states each elected three members of the Australian Senate at the 1903 federal election to serve a six-year term starting on 1 January 1904.

References

  1. "Details of Australian election results, 1925". University of Western Australia. Retrieved 23 July 2018.