Results of the 2007 Australian federal election (House of Representatives)

Last updated

Australian House of Representatives elections, 2007
Flag of Australia (converted).svg
  2004 24 November 2007 (2007-11-24) 2010  

All 150 seats in the Australian House of Representatives
76 seats needed for a majority
Turnout94.8%
PartyLeader%Seats+/–
Labor Kevin Rudd 43.4%83+23
Liberal John Howard 36.3%55−19
National Mark Vaile 5.5%10−2
This lists parties that won seats. See the complete results below.
Prime Minister beforePrime Minister after
PMincoffs.jpg John Howard
Coalition
Kevin Rudd
Labor
Kevin Rudd official portrait.jpg

The following tables show state-by-state results in the Australian House of Representatives at the 2007 federal election, 83 Labor, 65 coalition (55 Liberal, 10 National), 2 independent. [1] [2] [3] Detailed results for all 150 seats are also available. The Nationals were reduced to nine seats and the coalition to 64 when independent Rob Oakeshott won the 2008 Lyne by-election.

Contents

Australia

Electoral divisions: Australia National2007.GIF
Electoral divisions: Australia
House of Reps (IRV) — Turnout 94.76% (CV) — Informal 3.95% [4] [5] 2007 Australian House.svg
PartyVotes%SwingSeatsChange
  Labor 5,388,14743.38+5.7483Increase2.svg 23
  Liberal  4,506,23636.28–4.1955Decrease2.svg 19
  National 682,4245.49–0.4010Decrease2.svg 2
  Country Liberal 40,2980.32–0.020Decrease2.svg 1
Liberal–National coalition 5,228,95842.09−4.6165Decrease2.svg 22
  Greens 967,7817.79+0.60
  Family First 246,7921.99–0.02
  Christian Democrats 104,7050.84+0.22
  Democrats 89,8100.72–0.51
Total12,419,863  150
Two-party-preferred vote
  Labor 6,545,75952.70+5.4483Increase2.svg 23
  Liberal/National coalition 5,874,10447.30–5.4465Decrease2.svg 22
Invalid/blank votes510,9513.95−1.23
Registered voters/turnout13,646,53994.72
Source: Commonwealth Election 2007

New South Wales

2007 Australian federal election
(New South Wales)
Flag of New South Wales.svg
  2004 24 November 2007 2010  

All 49 New South Wales seats in the Australian House of Representatives
and 6 seats in the Australian Senate
 First partySecond party
  Kevin Rudd official portrait.jpg PMincoffs.jpg
Leader Kevin Rudd John Howard
Party Labor Liberal/National coalition
Last election21 seats21 seats
Seats won28 seats15 seats
Seat changeIncrease2.svg 7Decrease2.svg 6
Popular vote1,791,1711,645,493
Percentage44.12%40.53%
SwingIncrease2.svg 7.24Decrease2.svg 4.82
TPP 53.68%46.32%
TPP swingIncrease2.svg 5.61Decrease2.svg 5.61

Map12007.gif
Map22007.gif
Turnout 94.99% (CV) — Informal 4.95% [4] [5]
PartyVotes%SwingSeatsChange
  Labor 1,791,17144.12+7.4228Increase2.svg 7
  Liberal  1,324,31132.62–3.5415Decrease2.svg 6
  National 321,1827.91–1.285Decrease2.svg 1
Liberal–National coalition 1,645,49340.53−4.8120Decrease2.svg 7
  Greens 320,0317.88–0.21
  Christian Democrats 77,9031.92+0.70
  Family First Party 35,4690.87+0.10
  Australian Democrats 11,1060.27–0.80
  Climate Change Coalition 9,4700.23+0.23
  Citizens Electoral Council 9,0450.22–0.08
  One Nation 8,4260.21–1.19
  Liberty and Democracy Party 4,9060.12+0.12
  Socialist Alliance 3,9700.10–0.01
  Socialist Equality Party 3,4350.08+0.08
  Climate Conservatives 2,0740.05+0.05
  The Fishing Party 1,0730.03–0.04
  Non-Custodial Parents Party 7950.02–0.01
  Independents 134,4243.31–0.691Decrease2.svg 1
 Not Affiliated6950.02–0.02
Total4,059,48649Decrease2.svg 1
Two-party-preferred vote
  Labor 2,179,02953.68+5.6128Increase2.svg 7
  Liberal/National coalition 1,880,45746.32–5.6120Decrease2.svg 7
Invalid/blank votes211,5194.95−1.17
Registered voters/turnout4,496,20894.99
Source: Commonwealth Election 2007

Independents: Tony Windsor

Liberal to Labor: Bennelong, Dobell, Eden-Monaro, Lindsay, Parramatta (notional), Robertson

National to Labor: Page

Independent to National: Calare

Gwydir (National) was abolished in the last redistribution. Liberal-held Macquarie, a notionally Labor seat, was also won by the Labor Party. [6]

Victoria

2007 Australian federal election
(Victoria)
Flag of Victoria (Australia).svg
  2004 24 November 2007 2010  

All 37 Victorian seats in the Australian House of Representatives
and 6 seats in the Australian Senate
 First partySecond party
  Kevin Rudd official portrait.jpg PMincoffs.jpg
Leader Kevin Rudd John Howard
Party Labor Liberal/National coalition
Last election19 seats18 seats
Seats won21 seats16 seats
Seat changeIncrease2.svg 2Decrease2.svg 2
Popular vote1,416,2151,302,785
Percentage44.69%41.11%
SwingIncrease2.svg 4.24Decrease2.svg 5.64
TPP 54.27%45.73%
TPP swingIncrease2.svg 5.27Decrease2.svg 5.27

Map32007.gif
Map42007.gif
Electoral divisions: Victoria Map32007.gif
Electoral divisions: Victoria
Electoral divisions: Melbourne area Map42007.gif
Electoral divisions: Melbourne area
Turnout 95.17% (CV) — Informal 3.26% [4]
PartyVotes%SwingSeatsChange
  Labor 1,416,21544.69+4.2421Increase2.svg 2
  Liberal  1,206,92638.09–5.1514Decrease2.svg 2
  National 95,8593.02–0.492Steady2.svg
Liberal–National coalition 1,302,78541.11−5.6416Decrease2.svg 2
  Greens 258,8468.17+0.72
  Family First 95,6633.02+0.64
  Democrats 38,8141.22+0.15
  Citizens Electoral Council 8,6560.27–0.20
  Democratic Labor 6,0180.19+0.14
  Liberty and Democracy Party 3,2800.10+0.10
  Socialist Alliance 2,2900.07–0.05
  What Women Want 1,8250.06+0.06
  Christian Democrats 1,2110.04+0.02
  Socialist Equality 6910.02+0.02
  One Nation 4330.01–0.13
  Independents 31,6451.00+0.00
 Not Affiliated5390.02–0.05
Total3,168,89937
Two-party-preferred vote
  Labor 1,719,74954.27+5.2721Increase2.svg 2
  Liberal/National coalition 1,449,15045.73–5.2716Decrease2.svg 2
Invalid/blank votes106,7213.26−0.84
Registered voters/turnout3,441,82295.17
Source: Commonwealth Election 2007

Liberal to Labor: Corangamite, Deakin. [6]

Queensland

2007 Australian federal election
(Queensland)
Flag of Queensland.svg
  2004 24 November 2007 2010  

All 29 Queensland seats in the Australian House of Representatives
and 6 seats in the Australian Senate
 First partySecond party
  Kevin Rudd official portrait.jpg PMincoffs.jpg
Leader Kevin Rudd John Howard
Party Labor Liberal/National coalition
Last election6 seats21 seats
Seats won15 seats13 seats
Seat changeIncrease2.svg 9Decrease2.svg 8
Popular vote1,020,6651,057,942
Percentage42.91%44.47%
SwingIncrease2.svg 8.13Decrease2.svg 5.33
TPP 50.44%49.56%
TPP swingIncrease2.svg 7.53Decrease2.svg 7.53

Map52007.gif
Map62007.gif
Electoral divisions: Queensland Map52007.gif
Electoral divisions: Queensland
Electoral divisions: Brisbane area Map62007.gif
Electoral divisions: Brisbane area
Turnout 94.41% (CV) — Informal 3.56% [4]
PartyVotes%SwingSeatsChange
  Labor 1,020,66542.91+8.1315Increase2.svg 9
  Liberal  818,43834.40–5.0110Decrease2.svg 7
  National 239,50410.07+0.323Decrease2.svg 1
Liberal–National coalition 1,057,94244.47−4.6813Decrease2.svg 8
  Australian Greens 133,9385.63+0.57
  Family First 54,0582.27–1.40
  Democrats 22,4270.94–0.43
  One Nation 8,6190.36–1.62
  Citizens Electoral Council 3,6680.15–0.21
  Liberty and Democracy Party 3,5310.15+0.15
  Socialist Alliance 1,1740.05–0.01
  Fishing Party 1,0100.04+0.04
  Christian Democrats 7530.03+0.03
  Independents 71,0682.99–0.201
Total2,378,853  29Increase2.svg 1
Two-party-preferred vote
  Labor 1,199,91750.44+7.5315Increase2.svg 9
  Liberal/National coalition 1,178,93649.56–7.5313Decrease2.svg 8
Invalid/blank votes87,7083.56−1.60
Registered voters/turnout2,612,50494.41
Source: Commonwealth Election 2007

Independents: Bob Katter

Liberal to Labor: Blair, Bonner, Forde, Leichhardt, Longman, Moreton, Petrie

National to Labor: Flynn (notional), Dawson. [6]

Western Australia

2007 Australian federal election
(Western Australia)
Flag of Western Australia.svg
  2004 24 November 2007 2010  

All 15 Western Australian seats in the Australian House of Representatives
and 6 seats in the Australian Senate
 First partySecond party
  PMincoffs.jpg Kevin Rudd official portrait.jpg
Leader John Howard Kevin Rudd
Party Liberal/National coalition Labor
Last election10 seats5 seats
Seats won 11 seats4 seats
Seat changeIncrease2.svg 1Decrease2.svg 1
Popular vote558,824433,342
Percentage47.45%36.80%
SwingDecrease2.svg 1.24Increase2.svg 2.05
TPP 53.26%46.74%
TPP swingDecrease2.svg 2.14Increase2.svg 2.14

Map72007.gif
Electoral divisions: Western Australia
Electoral divisions: Western Australia Map72007.gif
Electoral divisions: Western Australia
Turnout 93.26% (CV) — Informal 3.85% [4]
PartyVotes%SwingSeatsChange
  Liberal 545,36546.31–1.8211Increase2.svg 1
  Labor 433,34236.80+2.054Decrease2.svg 1
  Greens 105,1068.93+1.26
  Christian Democrats 24,8382.11–0.14
  Family First 14,2151.21+0.97
  One Nation 13,5291.15–1.37
  National 13,4591.14+0.58
  Citizens Electoral Council 3,1150.26–0.34
  Liberty and Democracy Party 2,7300.23+0.23
  Socialist Alliance 1,1410.10–0.05
  What Women Want 5900.05+0.05
  Socialist Equality 1570.01+0.01
  Independents 19,9501.69+0.34
Total1,177,537  15
Two-party-preferred vote
  Liberal 627,21153.26–2.1411Increase2.svg 1
  Labor 550,32646.74+2.144Decrease2.svg 1
Invalid/blank votes47,1523.85−1.47
Registered voters/turnout1,313,20193.26
Source: Commonwealth Election 2007

Labor to Liberal: Cowan, Swan

Liberal to Labor: Hasluck. [6]

South Australia

2007 Australian federal election
(South Australia)
Flag of South Australia.svg
  2004 24 November 2007 2010  

All 11 South Australian seats in the Australian House of Representatives
and 6 seats in the Australian Senate
 First partySecond party
  Kevin Rudd official portrait.jpg PMincoffs.jpg
Leader Kevin Rudd John Howard
Party Labor Liberal/National coalition
Last election3 seats8 seats
Seats won6 seats5 seats
Seat changeIncrease2.svg 3Decrease2.svg 3
Popular vote 426,639425,041
Percentage43.18%43.02%
SwingIncrease2.svg 6.43Decrease2.svg 5.40
TPP 52.40%47.60%
TPP swingIncrease2.svg 6.76Decrease2.svg 6.76

Map82007.gif
Electoral divisions: South Australia
Turnout 95.42% (CV) — Informal 3.78% [4]
PartyVotes%SwingSeatsChange
  Labor 426,63943.18+6.436Increase2.svg 3
  Liberal  412,62141.76–5.645Decrease2.svg 3
  National 12,4201.26+0.240Steady2.svg
Liberal–National coalition 425,04143.01−5.415Decrease2.svg 3
  Greens 68,6406.95+1.51
  Family First 40,0314.05–0.26
  Democrats 14,9571.51–0.37
  One Nation 1,6430.17–0.96
  Liberty and Democracy Party 1,6370.17+0.17
  What Women Want 1,4550.15+0.15
  Climate Conservatives 1,1650.12+0.12
  Independents 6,9440.70–1.34
Total988,152  11
Two-party-preferred vote
  Labor 517,81852.40+6.766Increase2.svg 3
  Liberal 470,33447.60–6.765Decrease2.svg 3
Invalid/blank votes38,8303.78−1.78
Registered voters/turnout1,076,22095.42
Source: Commonwealth Election 2007

Liberal to Labor: Kingston, Makin, Wakefield. [6]

Tasmania

2007 Australian federal election
(Tasmania)
Flag of Tasmania.svg
  2004 24 November 2007 2010  

All 5 Tasmanian seats in the Australian House of Representatives
and 6 seats in the Australian Senate
 First partySecond party
  Kevin Rudd official portrait.jpg PMincoffs.jpg
Leader Kevin Rudd John Howard
Party Labor Liberal/National coalition
Last election3 seats2 seats
Seats won5 seats0 seats
Seat changeIncrease2.svg 2Decrease2.svg 2
Popular vote139,077124,280
Percentage42.77%38.22%
SwingDecrease2.svg 1.81Decrease2.svg 3.76
TPP 56.21%43.79%
TPP swingIncrease2.svg 2.02Decrease2.svg 2.02

2007 Australian federal election in Tasmania.svg
Results by electorate
Turnout 95.76% (CV) — Informal 2.92% [4]
PartyVotes%SwingSeatsChange
  Labor 139,07742.77–1.815Increase2.svg 2
  Liberal 124,28038.22–3.760Decrease2.svg 2
  Greens 43,89313.50+3.62
  Family First 7,3562.26–0.58
  Citizens Electoral Council 1,8560.57+0.20
  Socialist Alliance 8590.26–0.09
  Liberty and Democracy Party 6060.19+0.19
  Independents 7,2152.22+2.22
Total325,142  5
Two-party-preferred vote
  Labor 182,75756.21+2.025Increase2.svg 2
  Liberal 142,38543.79–2.020Decrease2.svg 2
Invalid/blank votes9,7962.92−0.67
Registered voters/turnout349,75395.76
Source: Commonwealth Election 2007

Liberal to Labor: Bass, Braddon. [6]

Territories

Australian Capital Territory

2007 Australian federal election
(Australian Capital Territory)
Flag of the Australian Capital Territory.svg
  2004 24 November 2007 2010  

All 2 Australian Capital Territory seats in the Australian House of Representatives
and all 2 seats in the Australian Senate
 First partySecond party
  Kevin Rudd official portrait.jpg PMincoffs.jpg
Leader Kevin Rudd John Howard
Party Labor Liberal/National coalition
Last election2 seats0 seats
Seats won20
Seat changeSteady2.svgSteady2.svg
Popular vote114,24474,295
Percentage51.10%33.23%
SwingIncrease2.svg 2.05Decrease2.svg 2.00
TPP 63.40%36.60%
TPP swingIncrease2.svg 1.86Decrease2.svg 1.86
Electoral divisions: Australian Capital Territory (ACT) and the Northern Territory Map102007.gif
Electoral divisions: Australian Capital Territory (ACT) and the Northern Territory
Turnout 95.85% (CV) — Informal 2.31% [4]
PartyVotes%SwingSeatsChange
  Labor 114,24451.10+0.852Steady2.svg
  Liberal 74,29533.23–2.000Steady2.svg
  Australian Greens 29,42413.16+2.40
  Australian Democrats 2,5091.12–1.28
  Citizens Electoral Council 1,2950.58+0.21
  Socialist Alliance 5390.24–0.75
  Independents 1,2750.57+0.57
Total223,5812
Two-party-preferred vote
  Labor 141,74563.40+1.862Steady2.svg
  Liberal 81,83636.60–1.860Steady2.svg
Invalid/blank votes5,2892.31−1.13
Registered voters/turnout238,78695.85
Source: Commonwealth Election 2007

Northern Territory

2007 Australian federal election
(Northern Territory)
Flag of the Northern Territory.svg
  2004 24 November 2007 2010  

All 2 Northern Territory seats in the Australian House of Representatives
and all 2 seats in the Australian Senate
 First partySecond party
  Kevin Rudd official portrait.jpg PMincoffs.jpg
Leader Kevin Rudd John Howard
Party Labor Liberal/National coalition
Last election 1 seat 1 seat
Seats won20
Seat changeIncrease2.svg 1Decrease2.svg 1
Popular vote46,79440,298
Percentage47.65%41.03
SwingIncrease2.svg 3.38Decrease2.svg 2.81
TPP 55.41%44.59%
TPP swingIncrease2.svg 3.26Decrease2.svg 3.26
Turnout 86.53% (CV) — Informal 3.85% [4]
PartyVotes%SwingSeatsChange
  Labor 46,79447.65+3.382Increase2.svg 1
  Country Liberal 40,29841.03–2.810Decrease2.svg 1
  Greens 7,9038.05+1.84
  Liberty and Democracy Party 3580.36+0.36
  Citizens Electoral Council 2450.25–0.01
  Independents 2,6152.66+0.70
Total98,2132
Two-party-preferred vote
  Labor 54,41855.41+3.262Increase2.svg 1
  Country Liberal 43,79544.59–3.260Decrease2.svg 1
Invalid/blank votes3,9363.85−0.60
Registered voters/turnout118,04586.53
Source: Commonwealth Election 2007

CLP to Labor: Solomon. [6]

See also

Notes

  1. The independent members were Tony Windsor (New England, NSW) and Bob Katter (Kennedy, Qld). The independent member for Calare, Peter Andren, did not contest the election.

Related Research Articles

<span class="mw-page-title-main">2001 Australian federal election</span> Election for the 40th Parliament of Australia

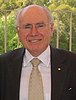
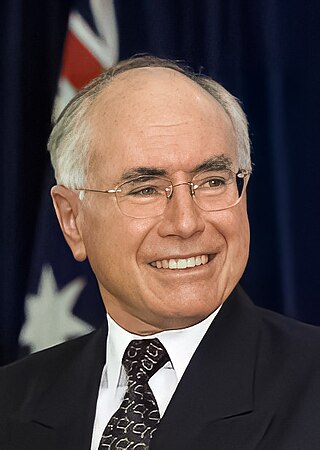
The 2001 Australian federal election was held in Australia on 10 November 2001. All 150 seats in the House of Representatives and 40 seats in the 76-member Senate were up for election. The incumbent Liberal Party of Australia led by Prime Minister of Australia John Howard and coalition partner the National Party of Australia led by John Anderson defeated the opposition Australian Labor Party led by Kim Beazley. Future Opposition Leader Peter Dutton entered parliament at this election. As of 2023 this was the most recent federal election to have a rematch in 11 years, and the most recent repeated election when Howard beat Beazley just 3 years earlier and until 2013 to have both major party leaders running in previous federal elections as major party leaders when in 2013, and the last for both major party leaders to appear in consecutive federal elections in 24 years.

<span class="mw-page-title-main">2004 Australian federal election</span> Election for the 41st Parliament of Australia

The 2004 Australian federal election was held in Australia on 9 October 2004. All 150 seats in the House of Representatives and 40 seats in the 76-member Senate were up for election. The incumbent Liberal Party of Australia led by Prime Minister of Australia John Howard and coalition partner the National Party of Australia led by John Anderson defeated the opposition Australian Labor Party led by Mark Latham.

Peter James Andren AM was an Australian politician. He was an independent member of the Australian House of Representatives from March 1996 until October 2007, representing the electorate of Calare, New South Wales.

<span class="mw-page-title-main">Bob Katter</span> Australian politician

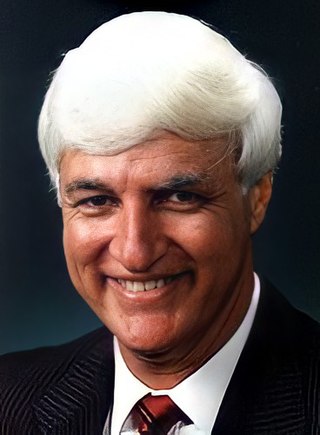
Robert Bellarmine Carl Katter is an Australian politician who has been a member of the House of Representatives since 1993. He was previously active in Queensland state politics from 1974 to 1992. Katter was a member of the National Party until 2001, when he left to sit as an independent. He formed his own party, Katter's Australian Party, in 2011.

<span class="mw-page-title-main">Division of Corangamite</span> Australian federal electoral division

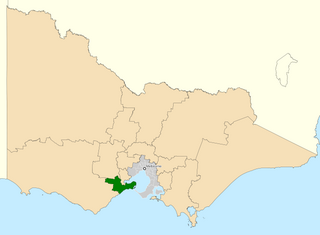
The Division of Corangamite is an Australian electoral division in the state of Victoria. The division was proclaimed in 1900, and was one of the original 65 divisions to be contested at the first federal election. It is named for Lake Corangamite, although the lake no longer falls within the division's boundaries.

<span class="mw-page-title-main">Division of Swan</span> Australian federal electoral division

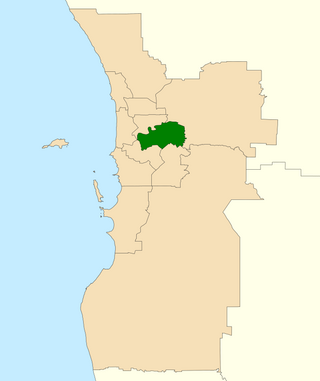
The Division of Swan is an Australian electoral division located in Western Australia.

<span class="mw-page-title-main">Division of Calare</span> Australian federal electoral division

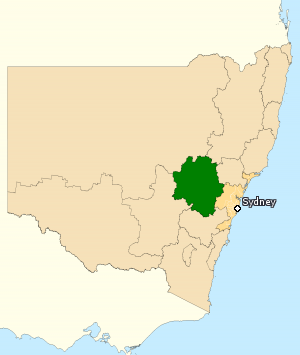
The Division of Calare is an Australian electoral division in the state of New South Wales.

The Division of Kennedy is an Australian electoral division in the state of Queensland.

<span class="mw-page-title-main">1990 Australian federal election</span> Election

The 1990 Australian federal election was held in Australia on 24 March 1990. All 148 seats in the House of Representatives and 40 seats in the 76-member Senate were up for election. The incumbent Australian Labor Party, led by Bob Hawke, defeated the opposition Liberal Party of Australia, led by Andrew Peacock, with its coalition partner, the National Party of Australia, led by Charles Blunt, despite losing the nationwide popular and two-party-preferred vote. The result saw the re-election of the Hawke government for a fourth successive term.

<span class="mw-page-title-main">2010 Australian federal election</span> Election for the 43rd Parliament of Australia

The 2010 Australian federal election was held on Saturday, 21 August 2010 to elect members of the 43rd Parliament of Australia. The incumbent centre-left Australian Labor Party led by Prime Minister Julia Gillard won a second term against the opposition centre-right Liberal Party of Australia led by Opposition Leader Tony Abbott and Coalition partner the National Party of Australia, led by Warren Truss, after Labor formed a minority government with the support of three independent MPs and one Australian Greens MP.

The following tables show state-by-state results in the Australian House of Representatives at the 2010 federal election, Labor 72, Coalition 72, Nationals (WA) 1, Australian Greens 1, with 4 independents.

Katter's Australian Party (KAP) is an agrarian populist political party in Australia that advocates for a synthesis of agrarian socialist economic policies and conservative social policies. It was founded by Bob Katter, an independent and former Nationals MP for the seat of Kennedy, with a registration application lodged to the Australian Electoral Commission in 2011.

The following is a pendulum based on the outcome of the 2010 federal election and changes since, including the redistributions of seats in South Australia and Victoria. It is a Mackerras pendulum, invented by psephologist Malcolm Mackerras, which works by lining up all of the seats held in Parliament according to the percentage point margin on a two-candidate-preferred basis. The two-party result is also known as the swing required for the seat to change hands. Given a uniform swing to the opposition or government parties in an election, the number of seats that change hands can be predicted. Swings are never uniform, but in practice variations of swing among the Australian states usually tend to cancel each other out. Seats are arranged in safeness categories according to the Australian Electoral Commission's (AEC) classification of safeness. "Safe" seats require a swing of over 10 per cent to change, "fairly safe" seats require a swing of between 6 and 10 per cent, while "marginal" seats require a swing of less than 6 per cent. The swings for South Australian and Victorian seats are notional, based on calculations by the AEC.

<span class="mw-page-title-main">2016 Australian federal election</span> Election for the 45th Parliament of Australia

The 2016 Australian federal election was a double dissolution election held on Saturday 2 July to elect all 226 members of the 45th Parliament of Australia, after an extended eight-week official campaign period. It was the first double dissolution election since the 1987 election and the first under a new voting system for the Senate that replaced group voting tickets with optional preferential voting.

The following tables show state-by-state results in the Australian House of Representatives at the 2013 federal election, Coalition 90, Labor 55, Australian Greens 1, Palmer United Party 1, Katter's Australian Party 1, with 2 independents.

<span class="mw-page-title-main">2019 Australian federal election</span> Election for the 46th Parliament of Australia

The 2019 Australian federal election was held on Saturday 18 May 2019 to elect members of the 46th Parliament of Australia. The election had been called following the dissolution of the 45th Parliament as elected at the 2016 double dissolution federal election. All 151 seats in the House of Representatives and 40 of the 76 seats in the Senate were up for election.

The following tables show state-by-state results in the Australian House of Representatives at the 2016 federal election, Coalition 76, Labor 69, Australian Greens 1, Nick Xenophon Team 1, Katter's Australian Party 1, with 2 independents.

<span class="mw-page-title-main">Next Australian federal election</span> Election for the 48th Parliament of Australia

The next Australian federal election will be held on or before 27 September 2025 to elect members of the 48th Parliament of Australia. All 150 seats in the House of Representatives and likely 40 of the 76 seats in the Senate will be contested. It is expected that at this election, the Labor government of Prime Minister Anthony Albanese will be seeking re-election to a second term in office, opposed by the Liberal/National Coalition under Leader of the Opposition Peter Dutton.

The number of seats won by each party in the Australian House of Representatives at the 2022 federal election were: Coalition 58, Labor 77, Australian Greens 4, Centre Alliance 1, Katter's Australian Party 1, and Independents 10.

<span class="mw-page-title-main">Results of the 2007 Australian federal election in New South Wales</span>

This is a list of electoral division results in the Australian 2007 federal election for the state of New South Wales.

References

  1. "Full First Preferences by state – AEC". Results.aec.gov.au. 21 December 2007. Retrieved 19 July 2010.
  2. Two party preferred by state – AEC
  3. "State of the Parties". ABC. Retrieved 19 July 2010.
  4. 1 2 3 4 5 6 7 8 9 "Lower house results: AEC". Results.aec.gov.au. Retrieved 19 July 2010.
  5. 1 2 "UWA election summaries". Elections.uwa.edu.au. 20 March 2010. Retrieved 19 July 2010.
  6. 1 2 3 4 5 6 7 Bennett, Scott; Kopras, Andrew; Newman, Gerrard (2005). "Commonwealth Election 2007" (PDF). Research Paper 30 2007–08. Parliamentary Library. ISSN   1834-9854.