Results of the 1943 Australian federal election (House of Representatives)

Last updated


This is a list of electoral division results for the Australian 1943 federal election.

Contents

Australian federal election, 21 August 1943 [1]
House of Representatives
<< 19401946 >>

Enrolled voters4,466,749
Votes cast4,249,369 Turnout 95.13+1.27
Informal votes148,785Informal3.50+0.95
Summary of votes by party
PartyPrimary votes %SwingSeatsChange
  Labor 2,058,58250.20%+10.04%49+ 17
  United Australia 898,12821.90%–8.34%14– 9
  Country 350,3788.54%–4.97%9– 4
  One Parliament 87,1122.11%+2.11%0± 0
  Communist 81,8161.98%+1.98%0± 0
  Liberal Democratic 42,1491.02%+1.02%0± 0
  State Labor 29,7520.72%–1.89%0± 0
  Independent 501,05412.15%+4.69%2± 0
Total4,100,584  74 

New South Wales

1943 Australian federal election (New South Wales)
Flag of New South Wales.svg
  1940 21 August 1943 1946  

All 28 NSW seats in the House of Representatives
14 seats needed for a majority
 First partySecond party
  JohnCurtin.jpg FaddenPEO.jpg
Leader John Curtin Arthur Fadden
Party Labor Coalition
Seats before1212
Seats won217
Seat changeIncrease2.svg 9Decrease2.svg 5
Popular vote834,855404,101
Percentage53.8%25.6%
SwingIncrease2.svg 18.5ppDecrease2.svg 13.3pp

Barton

1943 Australian federal election: Barton
PartyCandidateVotes%±%
Labor H. V. Evatt 51,29674.2+16.8
United Australia Frank Browne 15,89723.0−12.4
Protestant People Thomas Claydon1,9362.8+2.8
Total formal votes69,12998.3
Informal votes1,1791.7
Turnout 70,30899.3
Two-party-preferred result
Labor H. V. Evatt 75.6+13.5
United Australia Frank Browne 24.4−13.5
Labor hold Swing +13.5

Calare

1943 Australian federal election: Calare
PartyCandidateVotes%±%
Labor John Breen 27,07154.4+27.8
Country Albert Reid 10,27520.6−14.0
Independent Harold Thorby 6,27012.6+12.6
Country Reg Edols5,14210.3+10.3
One Parliament Percy Phelan1,0292.1+2.1
Total formal votes49,78797.9
Informal votes1,0612.1
Turnout 50,84897.3
Two-party-preferred result
Labor John Breen 59.9+6.5
Country Albert Reid 40.1−6.5
Labor hold Swing +6.5

Cook

1943 Australian federal election: Cook
PartyCandidateVotes%±%
Labor Tom Sheehan 39,65368.9+36.3
State Labor Sid Conway12,13121.1+21.1
One Parliament Albert Jones3,2385.6+5.6
Protestant Labor Cyril Glassop2,5574.4+4.4
Total formal votes57,57996.7
Informal votes1,9863.3
Turnout 59,56598.0
Two-party-preferred result
Labor Tom Sheehan 76.4+40.0
State Labor Sid Conway23.6+23.6
Labor gain from Labor (N-C) Swing +40.0

Cowper

1943 Australian federal election: Cowper
PartyCandidateVotes%±%
Country Sir Earle Page 24,01745.5−8.2
Labor John Howard21,37540.5+18.6
Independent Joseph McElhone5,40310.2−6.0
One Parliament Alexander Moore1,9363.7+3.7
Total formal votes52,73198.7
Informal votes6901.3
Turnout 53,42197.0
Two-party-preferred result
Country Sir Earle Page 27,73652.6−12.3
Labor John Howard24,99547.4+12.3
Country hold Swing −12.3

Dalley

1943 Australian federal election: Dalley
PartyCandidateVotes%±%
Labor Sol Rosevear 44,12774.8+41.3
One Parliament Ernest de Faria10,76018.2+18.2
Communist Lance Sharkey 4,0876.9+6.9
Total formal votes58,97496.9
Informal votes1,8643.1
Turnout 60,83898.0
Two-party-preferred result
Labor Sol Rosevear 81.1+38.3
One Parliament Ernest de Faria18.9+18.9
Labor gain from Labor (N-C) Swing +38.3

Darling

1943 Australian federal election: Darling
PartyCandidateVotes%±%
Labor Joe Clark 32,54071.6+8.2
One Parliament James Butler12,93628.4+28.4
Total formal votes45,47697.5
Informal votes1,1802.5
Turnout 46,65690.9
Labor hold Swing −1.9

East Sydney

1943 Australian federal election: East Sydney
PartyCandidateVotes%±%
Labor Eddie Ward 36,53169.0+19.9
United Australia Vincent Brady12,43023.5-7.0
Liberal Democratic Hugh Angrave2,3774.5+4.5
One Parliament Ernest Carr 1,1412.2+2.2
Independent Arthur Shirley 4940.9+0.9
Total formal votes52,97396.4
Informal votes1,9673.6
Turnout 54,94094.8
Two-party-preferred result
Labor Eddie Ward 71.0+4.9
United Australia Vincent Brady29.0-4.9
Labor hold Swing +4.9

Eden-Monaro

1943 Australian federal election: Eden-Monaro
PartyCandidateVotes%±%
Labor Allan Fraser 23,66248.9+14.4
Liberal Democratic Denzil Macarthur-Onslow 10,51021.7+21.7
United Australia John Perkins 10,16221.0-30.9
Independent Bill Beale3,2106.6+1.3
Independent Jonas Crabtree3650.8+0.8
Independent Cecil Gray2620.5+0.5
Independent John Egan2110.4+0.4
Total formal votes48,38296.6
Informal votes1,6953.4
Turnout 50,07797.1
Two-party-preferred result
Labor Allan Fraser 55.4+10.2
Liberal Democratic Denzil Macarthur-Onslow 46.6+46.6
Labor gain from United Australia Swing +10.8

Gwydir

1943 Australian federal election: Gwydir
PartyCandidateVotes%±%
Labor William Scully 28,40459.5+4.1
Country Colin Gale14,32030.0-13.0
Independent Edmund Daniel3,9858.3+8.3
One Parliament William Mills1,0272.2+2.2
Total formal votes47,73698.6
Informal votes6841.4
Turnout 48,42095.0
Two-party-preferred result
Labor William Scully 63.7+4.9
Country Colin Gale36.3-4.9
Labor hold Swing +4.9

Hume

1943 Australian federal election: Hume
PartyCandidateVotes%±%
Labor Arthur Fuller 25,42049.6+26.7
Country Thomas Collins 19,62938.3−3.9
Independent Vernon Lawrence4,6679.1+9.1
Communist John McLeod1,1432.2+2.2
Liberal Democratic John Neeld4060.8+0.8
Total formal votes51,26597.6
Informal votes1,2422.4
Turnout 52,50796.0
Two-party-preferred result
Labor Arthur Fuller 56.3+7.2
Country Thomas Collins 43.7−7.2
Labor gain from Country Swing +7.2

Hunter

1943 Australian federal election: Hunter
PartyCandidateVotes%±%
Labor Rowley James unopposed
Labor hold Swing

Lang

1943 Australian federal election: Lang
PartyCandidateVotes%±%
Labor Dan Mulcahy 41,70161.5+41.2
United Australia William Harris16,64924.6-11.0
Communist Adam Ogston4,3126.4+6.4
Independent John Metcalfe3,8995.7+5.7
Independent Henry Mulcahy1,2491.8+1.8
Total formal votes67,81097.3
Informal votes1,8812.7
Turnout 69,69197.7
Two-party-preferred result
Labor Dan Mulcahy 71.0+71.0
United Australia William Harris29.0-5.0
Labor gain from Labor (N-C) Swing +5.0

Macquarie

1943 Australian federal election: Macquarie
PartyCandidateVotes%±%
Labor Ben Chifley 36,93765.0+20.4
United Australia Arthur Hebblewhite15,69327.6-12.7
One Parliament Albert Walker2,7664.9+4.9
Independent Country Millie Sullivan1,4712.6+2.6
Total formal votes56,83798.1
Informal votes1,1201.9
Turnout 57,98793.6
Two-party-preferred result
Labor Ben Chifley 68.8+10.7
United Australia Arthur Hebblewhite31.2-10.7
Labor hold Swing +10.7

Martin

1943 Australian federal election: Martin
PartyCandidateVotes%±%
Labor Fred Daly 27,99946.9+11.9
United Australia William McCall 19,88633.3-16.8
State Labor Albert Sloss 3,5976.0-8.9
Liberal Democratic George Mills3,5916.0+6.0
Independent John Lee 1,6902.8+2.8
Independent Eleanor Glencross 8331.4+1.4
Independent Gerrard Armstrong7871.3+1.3
Independent Edward Beck5640.9+0.9
  Independent Nationalist William Milne5070.8+0.8
Independent Isabella Stenning1700.3+0.3
Independent UAP Rupert Nicholson860.1+0.1
Total formal votes59,71093.4
Informal votes4,2286.6
Turnout 63,93897.6
Two-party-preferred result
Labor Fred Daly 55.7+8.3
United Australia William McCall 44.3-8.3
Labor gain from United Australia Swing +8.3

New England

1943 Australian federal election: New England
PartyCandidateVotes%±%
Labor Herbert Oxford22,34246.9+13.8
Country Joe Abbott 21,63645.4-21.5
Independent Charles Abbott2,5075.3+5.3
One Parliament James Fowler6801.4+1.4
Independent Albert Royal4681.0+1.0
Total formal votes47,63396.8
Informal votes1,5523.2
Turnout 49,18595.5
Two-party-preferred result
Country Joe Abbott 24,33751.1-9.5
Labor Herbert Oxford23,29648.9+9.5
Country hold Swing -9.5

Newcastle

1943 Australian federal election: Newcastle
PartyCandidateVotes%±%
Labor David Watkins 44,37969.2-5.2
Communist Stan Deacon7,27111.3+11.3
Independent James Bayley5,6168.8+8.8
Independent Labor Fred Wright4,7537.4+7.4
Independent Labor John Cain2,0673.2+3.2
Total formal votes64,08696.3
Informal votes2,4483.7
Turnout 66,53497.0
Two-party-preferred result
Labor David Watkins incalculable ?
Labor hold Swing  ?

North Sydney

1943 Australian federal election: North Sydney
PartyCandidateVotes%±%
United Australia Billy Hughes 29,96244.1-17.2
Labor Leo Haylen24,98935.7+20.2
Independent Patrick Williams6,1329.0+9.0
Independent Eric Bentley3,3494.9+4.9
Communist Jack Miles 2,8214.2+4.2
One Parliament Jack Lewis9381.4+1.4
Independent Oliver Partington4550.7+0.7
Total formal votes67,94695.3
Informal votes3,3234.7
Turnout 71,26998.4
Two-party-preferred result
United Australia Billy Hughes 36,06653.1-14.5
Labor Leo Haylen31,88046.9+46.9
United Australia hold Swing -14.5

Parkes

1943 Australian federal election: Parkes
PartyCandidateVotes%±%
Labor Les Haylen 29,89148.5+10.8
United Australia Sir Charles Marr 17,14127.8-22.7
Liberal Democratic Nigel Love 12,02019.5+19.5
  Australian Women's Party Pauline Budge1,3012.1+2.1
One Parliament Arthur Miles9291.5+1.5
Independent Francis Wilson1710.3+0.3
Independent Arthur Thompson1550.3+0.3
Total formal votes61,60896.7
Informal votes2,0743.3
Turnout 63,68297.4
Two-party-preferred result
Labor Les Haylen 52.9+10.3
United Australia Sir Charles Marr 47.1-10.3
Labor gain from United Australia Swing +10.3

Parramatta

1943 Australian federal election: Parramatta
PartyCandidateVotes%±%
United Australia Sir Frederick Stewart 25,26738.3-26.8
Labor Arthur Treble24,68037.4+19.9
Liberal Democratic Ormond Bissett8,88413.5+13.5
 National UnityRobert Firebrace5,8068.8+8.8
Independent Dexter Moore1,0691.6+1.6
Independent UAP Howard Miscamble3360.5+0.5
Total formal votes66,04296.9
Informal votes2,1103.1
Turnout 68,15296.7
Two-party-preferred result
United Australia Sir Frederick Stewart 39,15059.3-6.4
Labor Arthur Treble26,89240.7+6.4
United Australia hold Swing -6.4

Reid

1943 Australian federal election: Reid
PartyCandidateVotes%±%
Lang Labor Jack Lang 26,53241.4+41.4
Labor Charles Morgan 22,31334.8+4.8
United Australia David Knox6,99610.9+10.9
State Labor Jack Hughes 3,7295.8-4.8
Independent UAP Dick George2,8634.5+4.5
One Parliament Alfred Turner1,7282.7+2.7
Total formal votes64,16196.0
Informal votes2,6714.0
Turnout 66,83297.4
Two-party-preferred result
Labor Charles Morgan 34,15453.2+1.2
Lang Labor Jack Lang 30,00746.8-1.2
Labor hold Swing +1.2

Richmond

1943 Australian federal election: Richmond
PartyCandidateVotes%±%
Country Larry Anthony 25,92948.2-16.7
Labor Arthur Dodd17,03031.6+0.6
One Parliament Alfred Anderson 10,88820.2+20.2
Total formal votes53,84798.7
Informal votes7121.3
Turnout 54,55995.8
Two-party-preferred result
Country Larry Anthony 34,24663.6-3.3
Labor Arthur Dodd19,60136.4+3.3
Country hold Swing -3.3

Riverina

1943 Australian federal election: Riverina
PartyCandidateVotes%±%
Labor Joe Langtry 25,39755.3+33.6
Country Lindsay McIvor9,42720.5-9.4
Country Russell Scilley5,61312.2+12.2
Independent Robert Ballantyne2,9926.5+6.5
Independent Robert McKenzie1,8604.1+4.1
Liberal Democratic George Simons4891.1+1.1
Independent Frank Rieck1310.3+0.3
Total formal votes45,90994.9
Informal votes2,4645.1
Turnout 48,37396.0
Two-party-preferred result
Labor Joe Langtry 63.1+11.5
Country Lindsay McIvor46.9-11.5
Labor hold Swing +11.5

Robertson

1943 Australian federal election: Robertson
PartyCandidateVotes%±%
Labor Thomas Williams 28,92749.6+16.4
United Australia Eric Spooner 21,74637.3-10.6
State Labor Walter Evans4,6337.9+1.3
One Parliament Donald Brown2,5504.4+4.4
Independent Roberta Galagher4800.8+0.8
Total formal votes58,33697.1
Informal votes1,7622.9
Turnout 60,09895.0
Two-party-preferred result
Labor Thomas Williams 58.9+9.2
United Australia Eric Spooner 41.1-9.2
Labor gain from United Australia Swing +9.2

Warringah

1943 Australian federal election: Warringah
PartyCandidateVotes%±%
United Australia Percy Spender 34,17748.5−20.3
Labor Ronald Ashworth23,72333.7+22.7
Independent Stephen Stack9,38113.3+13.3
Independent Gerald Robinson1,6442.3+2.3
One Parliament Douglas Morris1,0781.5+1.5
  Independent Middle Class Edward Doherty4250.6+0.6
Total formal votes70,42897.5
Informal votes1,7732.5
Turnout 72,20195.5
Two-party-preferred result
United Australia Percy Spender 42,60060.5−15.0
Labor Ronald Ashworth27,82839.5+15.0
United Australia hold Swing −15.0

Watson

1943 Australian federal election: Watson
PartyCandidateVotes%±%
Labor Max Falstein 35,40052.3+18.0
United Australia Norman Whitfield18,58827.5-17.5
State Labor Richard Wilson5,6628.4-1.2
Independent UAP Les Fingleton2,3043.4+3.4
Liberal Democratic Arthur Dudley2,2183.3+3.3
Independent Harry Yates1,9422.9+2.9
Independent UAP Hubert O'Connell 1,5792.3+2.3
Total formal votes67,69395.9
Informal votes2,8734.1
Turnout 70,56698.0
Two-party-preferred result
Labor Max Falstein 62.1+10.1
United Australia Norman Whitfield37.9-10.1
Labor hold Swing +10.1

Wentworth

1943 Australian federal election: Wentworth
PartyCandidateVotes%±%
Labor Jessie Street 31,04843.5+20.4
United Australia Eric Harrison 23,51932.9-32.7
 National Government Bill Wentworth 14,87520.8+20.8
Liberal Democratic Charles Mayo1,6542.3+2.3
Independent Thomas Whitehouse3110.4+0.4
Total formal votes71,40797.4
Informal votes1,8972.6
Turnout 73,30498.5
Two-party-preferred result
United Australia Eric Harrison 36,87151.6-14.2
Labor Jessie Street 34,53648.4+14.2
United Australia hold Swing -14.2

Werriwa

1943 Australian federal election: Werriwa
PartyCandidateVotes%±%
Labor Bert Lazzarini 46,34668.7+27.2
One Parliament Arthur Brown12,99619.3+19.3
Independent Michel Kartzoff8,12212.0+12.0
Total formal votes67,46497.8
Informal votes1,5202.2
Turnout 68,98495.3
Two-candidate-preferred result
Labor Bert Lazzarini 74.7+9.6
One Parliament Arthur Brown25.3+25.3
Labor hold Swing +9.6

West Sydney

1943 Australian federal election: West Sydney
PartyCandidateVotes%±%
Labor Jack Beasley 34,40469.7+47.7
State Labor Horace Foley 9,16618.6+14.5
One Parliament Eddington Sherwood4,4819.1+9.1
Independent Malinda Ivey9571.9+1.9
 Soldiers Labor William McCristal 3520.7+0.7
Total formal votes49,36096.6
Informal votes1,7483.4
Turnout 51,10894.9
Two-party-preferred result
Labor Jack Beasley 79.2+43.5
State Labor Horace Foley 20.8+20.8
Labor gain from Labor (N-C) Swing +43.5

Victoria

1943 Australian federal election (Victoria)
Flag of Victoria (Australia).svg
  1940 21 August 1943 1946  

All 20 Victorian seats in the House of Representatives
14 seats needed for a majority
 First partySecond party
  FaddenPEO.jpg JohnCurtin.jpg
Leader Arthur Fadden John Curtin
Party Coalition Labor
Seats before129
Seats won129
Seat changeSteady2.svgSteady2.svg
Popular vote361,581518,600
Percentage30.8%44.1%
SwingDecrease2.svg 12.0ppIncrease2.svg 0.6pp

Balaclava

1943 Australian federal election: Balaclava
PartyCandidateVotes%±%
United Australia Thomas White 38,69851.6−12.4
Labor John Barry 27,28136.3+11.3
Independent Frank Barnes4,0875.4+5.4
Independent Constance Duncan 2,9003.9+3.9
 ProgressiveHelen Maxwell1,6802.2+2.2
Independent George Morris4090.5+0.5
Total formal votes75,05596.2
Informal votes3,9643.8
Turnout 78,01998.4
Two-party-preferred result
United Australia Thomas White 56.6−12.0
Labor John Barry 43.4+12.0
United Australia hold Swing −12.0

Ballaarat

1943 Australian federal election: Ballaarat
PartyCandidateVotes%±%
Labor Reg Pollard 26,42854.5+6.7
United Australia Bill Roff19,75040.7+0.6
 Christian IndependentGordon Irish2,3334.8+4.8
Total formal votes48,51199.0
Informal votes4801.0
Turnout 48,99197.6
Two-party-preferred result
Labor Reg Pollard 57.9+7.6
United Australia Bill Roff42.1−7.6
Labor hold Swing +7.6

Batman

1943 Australian federal election: Batman
PartyCandidateVotes%±%
Labor Frank Brennan 42,07364.3+4.6
United Australia Arthur McAdam13,64720.9-19.4
Services and Citizens Ian Malloch7,63511.7+11.7
Independent Joseph Cahir1,0901.7+1.7
Independent Christina Debney5900.9+0.9
Services Gordon Currie3800.6+0.6
Total formal votes65,41596.9
Informal votes2,0703.1
Turnout 67,48598.4
Two-party-preferred result
Labor Frank Brennan 74.6+14.9
United Australia Arthur McAdam25.4-14.9
Labor hold Swing +14.9

Bendigo

1943 Australian federal election: Bendigo
PartyCandidateVotes%±%
Country George Rankin 20,05044.9−4.4
Labor Bert de Grandi19,10742.8+4.7
Independent UAP Morton Garner2,1514.8+4.8
Independent John Crawford2,0894.7+4.7
Independent Labor William Banks1,2922.9+2.9
Total formal votes44,68997.5
Informal votes1,1692.5
Turnout 45,85896.7
Two-party-preferred result
Country George Rankin 23,38652.3−5.2
Labor Bert de Grandi21,30347.7+5.2
Country hold Swing −5.2

Bourke

1943 Australian federal election: Bourke
PartyCandidateVotes%±%
Independent Labor Maurice Blackburn 26,49440.4+40.4
Labor Bill Bryson 24,72237.7−28.5
United Australia David Smith12,00418.3−15.5
Independent John March2,4043.7+3.7
Total formal votes65,62497.8
Informal votes1,4682.2
Turnout 67,09296.6
Two-party-preferred result
Labor Bill Bryson 35,16253.6−12.6
Independent Labor Maurice Blackburn 30,46246.4+46.4
Labor hold Swing −12.6

Corangamite

1943 Australian federal election: Corangamite
PartyCandidateVotes%±%
United Australia Allan McDonald 21,65547.2−9.0
Labor Harold Miller20,69145.1+1.3
Independent Elsie Brushfield1,8564.0+4.0
Independent Country Sydney Donaldson1,6433.6+3.6
Total formal votes45,84598.9
Informal votes5151.1
Turnout 46,36096.6
Two-party-preferred result
United Australia Allan McDonald 24,34253.1−3.1
Labor Harold Miller21,50346.9+3.1
United Australia hold Swing -3.1

Corio

1943 Australian federal election: Corio
PartyCandidateVotes%±%
Labor John Dedman 30,57852.3−0.3
Independent Neil Freeman16,01327.4+27.4
United Australia Rupert Curnow 10,25517.5−22.4
 ProgressiveJames Baker1,5892.7+2.7
Total formal votes58,43598.5
Informal votes9081.5
Turnout 59,34397.1
Two-party-preferred result
Labor John Dedman 54.8−1.6
Independent Neil Freeman45.2+45.2
Labor hold Swing −1.6

Deakin

1943 Australian federal election: Deakin
PartyCandidateVotes%±%
Labor Frank Williamson22,35637.7+5.4
United Australia William Hutchinson 19,37532.7-22.1
Independent Robert Elliott 10,31817.4+17.4
Middle Class Alan Coffey4,1857.1+7.1
Independent UAP Dick Radclyffe1,5262.6+2.6
Independent Arthur Coles1,4712.5+2.5
Total formal votes59,23197.1
Informal votes1,7602.9
Turnout 60,99196.4
Two-party-preferred result
United Australia William Hutchinson 33,57756.7-5.5
Labor Frank Williamson25,65443.3+5.5
United Australia hold Swing -5.5

Fawkner

1943 Australian federal election: Fawkner
PartyCandidateVotes%±%
United Australia Harold Holt 23,93133.4-27.4
Labor Thomas Jude23,50832.8-3.0
Independent William Cremor 15,95822.3+22.3
Independent Vernon Margetts3,4374.8+4.8
Communist Malcolm Good3,3004.6+4.6
Independent Charles Kennett1,1961.7+1.7
Independent Ruth Ravenscroft3810.5+0.5
Total formal votes71,71195.6
Informal votes3,2754.4
Turnout 74,98692.9
Two-party-preferred result
United Australia Harold Holt 41,60258.0-4.5
Labor Thomas Jude30,10942.0+4.5
United Australia hold Swing -4.5

Flinders

1943 Australian federal election: Flinders
PartyCandidateVotes%±%
Labor Frank Lee24,13239.6+11.9
United Australia Rupert Ryan 22,39536.8-2.9
Country Morton Moyes 6,86711.3+11.3
  Australian Women's Party Mabel Brookes 5,3058.7+8.7
Independent Rupert Clark2,1983.6+3.6
Total formal votes60,89797.1
Informal votes1,8172.9
Turnout 62,71495.2
Two-party-preferred result
United Australia Rupert Ryan 31,51851.8-6.6
Labor Frank Lee29,37948.2+6.6
United Australia hold Swing -6.6

Gippsland

1943 Australian federal election: Gippsland
PartyCandidateVotes%±%
Labor Wally Williames22,35845.1+11.6
Country George Bowden 18,10436.5-23.0
Services and Citizens Herbert Birch5,31310.7+10.7
Independent DemocratStephen Ashton2,7345.5+5.5
One Parliament Melvyn Morgan1,1192.3+2.3
Total formal votes49,62897.9
Informal votes1,0842.1
Turnout 50,71297.4
Two-party-preferred result
Country George Bowden 25,98552.4-4.3
Labor Wally Williames23,64347.6+4.3
Country hold Swing -4.3

Henty

1943 Australian federal election: Henty
PartyCandidateVotes%±%
Independent Arthur Coles 32,88544.5-10.1
United Australia Jo Gullett 28,12338.1+38.1
  Independent Labor Bernard Rees4,5986.2+6.2
Services and Citizens Edmund Lind 4,4376.0+6.0
 Women for Canberra Ivy Weber 2,8853.9+3.9
  Independent Liberal Carlyle Ferguson9281.3+1.3
Total formal votes73,85696.6
Informal votes2,5963.4
Turnout 76,45297.5
Two-party-preferred result
Independent Arthur Coles 55.5-8.0
United Australia Jo Gullett 44.5+44.5
Independent hold Swing -8.0

Indi

1943 Australian federal election: Indi
PartyCandidateVotes%±%
Country John McEwen 29,47158.8−2.7
Labor Charles Sandford 18,76737.4−1.1
Communist Gerry O'Day1,9193.8+3.8
Total formal votes50,15798.8
Informal votes5991.2
Turnout 50,75696.0
Two-party-preferred result
Country John McEwen 59.2−2.3
Labor Charles Sandford 40.8+2.3
Country hold Swing −2.3

Kooyong

1943 Australian federal election: Kooyong
PartyCandidateVotes%±%
United Australia Robert Menzies 37,98848.6−14.3
Labor Albert Nicholls20,91226.7+6.1
Middle Class John Nimmo 10,60113.5+13.5
Communist Ted Laurie 6,4028.2+8.2
 Christian IndependentGwendolyn Noad2,3383.0+3.0
Total formal votes78,24198.0
Informal votes1,5992.0
Turnout 79,84097.2
Two-party-preferred result
United Australia Robert Menzies 62.5−7.6
Labor Albert Nicholls37.5+7.6
United Australia hold Swing −7.6

Maribyrnong

1943 Australian federal election: Maribyrnong
PartyCandidateVotes%±%
Labor Arthur Drakeford 48,44167.6+3.0
United Australia Albert Pennell14,46920.2-15.2
 Christian Candidate MovementRobert Firebrace7,47810.4+10.4
 Anti-Conscription Labour Kenneth Kenafick 1,2541.8+1.8
Total formal votes71,64297.8
Informal votes1,6402.2
Turnout 73,28297.5
Two-party-preferred result
Labor Arthur Drakeford 74.5+9.9
United Australia Albert Pennell25.5-9.9
Labor hold Swing +9.9

Melbourne

1943 Australian federal election: Melbourne
PartyCandidateVotes%±%
Labor Arthur Calwell 37,77963.8+11.9
United Australia Elizabeth Couchman 10,31917.4-6.5
Communist Ken Miller5,4779.3+9.3
Middle Class Louis Bickart4,1197.0+7.0
Independent Charles Dicker8081.4+1.4
Services Noble Kerby6801.1+1.1
Total formal votes59,18293.9
Informal votes3,8486.1
Turnout 63,03091.5
Two-party-preferred result
Labor Arthur Calwell 75.2+4.1
United Australia Elizabeth Couchman 24.8-4.1
Labor hold Swing +4.1

Melbourne Ports

1943 Australian federal election: Melbourne Ports
PartyCandidateVotes%±%
Labor Jack Holloway 47,14972.8+6.7
United Australia Frank Preacher17,62927.2-6.7
Total formal votes64,77897.6
Informal votes1,6122.4
Turnout 66,39095.7
Labor hold Swing +6.7

Wannon

1943 Australian federal election: Wannon
PartyCandidateVotes%±%
Labor Don McLeod 25,60951.4+2.8
Country Leonard Rodda 10,77821.6+21.6
United Australia John Menadue9,24818.6-23.6
Independent UAP Thomas Scholfield 4,1908.4+8.4
Total formal votes49,82598.9
Informal votes5551.1
Turnout 50,38098.3
Two-party-preferred result
Labor Don McLeod 54.1+0.4
United Australia John Menadue45.9-0.4
Labor hold Swing +0.4

Wimmera

1943 Australian federal election: Wimmera
PartyCandidateVotes%±%
Independent Alexander Wilson 26,47962.3+18.3
Independent Country Reginald Skeat10,97625.8+25.8
Independent Country Albert Thompson3,2197.6+7.6
Independent Herbert Follett1,4493.4+3.4
Independent Country Eric Phillips3780.9+0.9
Total formal votes42,50197.9
Informal votes9302.1
Turnout 43,43196.6
Two-party-preferred result
Independent Alexander Wilson 67.2+1.0
Independent Country Reginald Skeat32.8+32.8
Independent hold Swing +1.0

Yarra

1943 Australian federal election: Yarra
PartyCandidateVotes%±%
Labor James Scullin 36,70960.4+3.0
United Australia Gilbert Jenkin11,29418.6-14.9
Communist Ralph Gibson 6,58510.8+10.8
Services and Citizens William Jinkins5,1388.5+8.5
Independent Allan MacDonald1,0651.8+1.8
Total formal votes60,79195.9
Informal votes2,6324.1
Turnout 63,42394.9
Two-party-preferred result
Labor James Scullin 74.3+8.7
United Australia Gilbert Jenkin25.7-8.7
Labor hold Swing +8.7

Queensland

1943 Australian federal election (Queensland)
Flag of Queensland.svg
  1940 21 August 1943 1946  

All 10 Queensland seats in the House of Representatives
5 seats needed for a majority
 First partySecond party
  JohnCurtin.jpg FaddenPEO.jpg
Leader John Curtin Arthur Fadden
Party Labor Coalition
Seats before55
Seats won64
Seat changeIncrease2.svg 1Decrease2.svg 1
Popular vote279,372227,615
Percentage47.8%39.0%
SwingIncrease2.svg 1.7ppDecrease2.svg 9.9pp

Brisbane

1943 Australian federal election: Brisbane
PartyCandidateVotes%±%
Labor George Lawson 31,09950.9+0.5
  Independent Democrat Bruce Pie 17,31728.3+28.3
United Australia John Fletcher 10,97618.0−31.6
One Parliament Robert Boardman1,7012.8+2.8
Total formal votes61,09397.0
Informal votes1,9083.0
Turnout 63,00195.3
Two-party-preferred result
Labor George Lawson 53.6+3.2
  Independent Democrat Bruce Pie 46.4+46.4
Labor hold Swing +3.2

Capricornia

1943 Australian federal election: Capricornia
PartyCandidateVotes%±%
Labor Frank Forde 32,39655.9−2.8
United Australia Charles Ward25,59744.1+44.1
Total formal votes57,99398.9
Informal votes6271.1
Turnout 58,62095.7
Labor hold Swing −2.8

Darling Downs

1943 Australian federal election: Darling Downs
PartyCandidateVotes%±%
Country Arthur Fadden 26,12348.6-9.3
Labor Leslie Bailey23,25343.3+1.2
Independent Raymond Mullaly3,3986.3+6.3
One Parliament Hugh Phair9891.8+1.8
Total formal votes53,76398.4
Informal votes8681.6
Turnout 54,63197.9
Two-party-preferred result
Country Arthur Fadden 28,23252.5-5.4
Labor Leslie Bailey25,53147.5+5.4
Country hold Swing -5.4

Griffith

1943 Australian federal election: Griffith
PartyCandidateVotes%±%
Labor William Conelan 38,13857.4+6.9
United Australia Richard Larking19,38829.2-20.3
One Parliament John Carbine3,9005.9+5.9
Independent William Kingwell3,7565.7+5.7
Independent Theophilus Dunstone1,2101.8+1.8
Total formal votes66,39296.9
Informal votes2,1153.1
Turnout 68,50796.3
Two-party-preferred result
Labor William Conelan 65.1+14.6
United Australia Richard Larking34.9-14.6
Labor hold Swing +14.6

Herbert

1943 Australian federal election: Herbert
PartyCandidateVotes%±%
Labor George Martens 22,69737.6-3.1
Communist Fred Paterson 20,62934.2+34.2
Country Archie Graham13,69322.7-12.8
Independent Charles Cook3,3005.5+5.5
Total formal votes60,31997.3
Informal votes1,6732.7
Turnout 61,99291.6
Two-party-preferred result
Labor George Martens 37,21961.7+5.3
Communist Fred Paterson 23,10038.3+38.3
Labor hold Swing +5.3

Kennedy

1943 Australian federal election: Kennedy
PartyCandidateVotes%±%
Labor Bill Riordan 29,55165.2+1.0
Country Wilfrid Simmonds 10,76923.8-12.0
Independent Athena Deane3,7538.3+8.3
Independent Richard Vane-Millbank1,2652.8+2.8
Total formal votes45,33896.8
Informal votes1,4833.2
Turnout 46,82188.0
Two-party-preferred result
Labor Bill Riordan 71.7+7.5
Country Wilfrid Simmonds 28.3-7.5
Labor hold Swing +7.5

Lilley

1943 Australian federal election: Lilley
PartyCandidateVotes%±%
United Australia William Jolly 30,99245.8-12.3
Labor Jim Hadley 30,88245.7+6.8
One Parliament Hans Beiers4,5556.7+6.7
Independent James Julin1,1911.8+1.8
Total formal votes67,62097.6
Informal votes1,6532.4
Turnout 69,27397.8
Two-party-preferred result
Labor Jim Hadley 34,05150.4+9.9
United Australia William Jolly 33,56949.6-9.9
Labor gain from United Australia Swing +9.9

Maranoa

1943 Australian federal election: Maranoa
PartyCandidateVotes%±%
Country Charles Adermann 26,96351.0+6.4
Labor Frank Baker 25,91449.0+1.1
Total formal votes52,87798.7
Informal votes6861.3
Turnout 53,56392.0
Country gain from Labor Swing +2.6

Moreton

1943 Australian federal election: Moreton
PartyCandidateVotes%±%
United Australia Josiah Francis 32,68150.0-9.3
Labor Patrick McInally26,80441.0+0.2
One Parliament Ralph Belcham3,7475.7+5.7
Country John Cantwell2,0933.2+3.2
Total formal votes65,32597.7
Informal votes1,6582.3
Turnout 66,89395.3
Two-party-preferred result
United Australia Josiah Francis 56.7-2.6
Labor Patrick McInally43.3+2.6
United Australia hold Swing -2.6

Wide Bay

1943 Australian federal election: Wide Bay
PartyCandidateVotes%±%
Country Bernard Corser 20,66238.5-2.1
Labor George Watson18,63834.7+5.4
Country James Heading 7,67814.3+14.3
Independent Henry Madden3,7507.0+7.0
Independent Clive Lambourne2,9885.6+5.6
Total formal votes53,71697.7
Informal votes1,2372.3
Turnout 54,95395.0
Two-party-preferred result
Country Bernard Corser 30,34256.5-2.4
Labor George Watson23,37443.5+2.4
Country hold Swing -2.4

South Australia

1943 Australian federal election (South Australia)
Flag of South Australia.svg
  1940 21 August 1943 1946  

All 6 SA seats in the House of Representatives
3 seats needed for a majority
 First partySecond party
  JohnCurtin.jpg FaddenPEO.jpg
Leader John Curtin Arthur Fadden
Party Labor Coalition
Seats before13
Seats won51
Seat changeIncrease2.svg 4Decrease2.svg 2
Popular vote203,784145,665
Percentage54.4%38.9%
SwingIncrease2.svg 14.6ppDecrease2.svg 14.6pp

Adelaide

1943 Australian federal election: Adelaide
PartyCandidateVotes%±%
Labor Cyril Chambers 40,11060.0+26.1
United Australia Fred Stacey 22,63633.8−16.2
Communist Alf Watt2,8544.3+4.3
Independent Labor Edwin Yates 1,2911.9+1.9
Total formal votes66,89196.1
Informal votes2,7143.9
Turnout 69,60595.8
Two-party-preferred result
Labor Cyril Chambers 65.6+20.3
United Australia Fred Stacey 34.4−20.3
Labor gain from United Australia Swing +20.3

Barker

1943 Australian federal election: Barker
PartyCandidateVotes%±%
United Australia Archie Cameron 24,61640.6+40.6
Labor Harry Krantz 24,24040.0+13.3
Independent Frank Halleday 10,50817.3+17.3
Independent John Gartner1,2222.0+2.0
Total formal votes60,58697.1
Informal votes1,8162.9
Turnout 62,40297.5
Two-party-preferred result
United Australia Archie Cameron 31,29451.7+51.7
Labor Harry Krantz 29,29248.3+14.2
United Australia gain from Country Swing −14.2

Boothby

1943 Australian federal election: Boothby
PartyCandidateVotes%±%
United Australia Grenfell Price 32,86945.0−12.4
Labor Thomas Sheehy 30,89642.3+14.3
Communist Alan Finger 6,9869.6+9.6
 Constructive DemocratJohn Turner2,3313.2+3.2
Total formal votes73,08296.6
Informal votes2,5973.4
Turnout 75,67997.4
Two-party-preferred result
Labor Thomas Sheehy 37,19050.9+16.1
United Australia Grenfell Price 35,89239.1−16.1
Labor gain from United Australia Swing +16.1

Grey

1943 Australian federal election: Grey
PartyCandidateVotes%±%
Labor Edgar Russell 25,73552.5+15.1
United Australia Oliver Badman 23,28547.5+47.5
Total formal votes49,02097.5
Informal votes1,2412.5
Turnout 50,26196.5
Labor gain from Country Swing +10.2

Hindmarsh

1943 Australian federal election: Hindmarsh
PartyCandidateVotes%±%
Labor Norman Makin 56,35976.8+11.1
United Australia James Butler17,03023.2-11.1
Total formal votes73,38997.6
Informal votes1,8242.4
Turnout 75,21397.5
Labor hold Swing +11.1

Wakefield

1943 Australian federal election: Wakefield
PartyCandidateVotes%±%
Labor Albert Smith 26,44451.2+4.6
United Australia Jack Duncan-Hughes 25,22948.8-4.6
Total formal votes51,67397.5
Informal votes1,3272.5
Turnout 53,00096.5
Labor gain from United Australia Swing +4.6

Western Australia

1943 Australian federal election (Western Australia)
Flag of Western Australia.svg
  1940 21 August 1943 1946  

All 5 WA seats in the House of Representatives
3 seats needed for a majority
 First partySecond party
  JohnCurtin.jpg FaddenPEO.jpg
Leader John Curtin Arthur Fadden
Party Labor Coalition
Seats before23
Seats won50
Seat changeIncrease2.svg 3Decrease2.svg 3
Popular vote143,77354,772
Percentage56.0%21.1%
SwingIncrease2.svg 17.8ppDecrease2.svg 33.1pp

Forrest

1943 Australian federal election: Forrest
PartyCandidateVotes%±%
Labor Nelson Lemmon 23,93152.9+8.3
Country John Prowse 15,50734.3-21.1
Independent Ian Fergusson-Stewart3,2647.2+7.2
Independent Country Arthur West2,1564.8+4.8
Independent Wildred Lewis3770.8+0.8
Total formal votes45,23597.1
Informal votes1,3432.9
Turnout 46,57897.5
Two-party-preferred result
Labor Nelson Lemmon 58.4+13.8
Country John Prowse 42.6-13.8
Labor gain from Country Swing +13.8

Fremantle

1943 Australian federal election: Fremantle
PartyCandidateVotes%±%
Labor John Curtin 45,35266.9+18.9
Ind. Nationalist Frederick Lee13,04619.2+19.2
United Australia Alex Bracks9,39613.9-32.3
Total formal votes67,79498.2
Informal votes1,2261.8
Turnout 69,02099.1
Two-party-preferred result
Labor John Curtin 69.3+19.0
Ind. Nationalist Frederick Lee30.7+30.7
Labor hold Swing +19.0

Kalgoorlie

1943 Australian federal election: Kalgoorlie
PartyCandidateVotes%±%
Labor Herbert Johnson 23,42467.6-32.4
United Australia Lance Horley6,22718.0+18.0
Communist Kevin Healy 3,0028.7+8.7
United Australia Ralph Shaw1,5384.4+4.4
Independent William McGhie4631.3+1.3
Total formal votes34,65496.9
Informal votes1,0923.1
Turnout 35,74695.5
Two-party-preferred result
Labor Herbert Johnson 75.4-24.6
United Australia Lance Horley24.6+24.6
Labor hold Swing -24.6

Perth

1943 Australian federal election: Perth
PartyCandidateVotes%±%
Labor Tom Burke 25,37642.3+10.8
United Australia Walter Nairn 17,61029.4-33.0
Independent Thomas Hughes 8,11213.5+13.5
Communist Clarrie Boyd3,6396.1+6.1
Independent Stephenson Fox2,6114.4+4.4
Independent Robert Nicholson1,5012.5+2.5
Independent Dorothea Foster4950.8+0.8
Independent William Herbert4190.7+0.7
Independent Thomas Groves1690.3+0.3
Total formal votes59,93293.3
Informal votes4,3116.7
Turnout 64,24399.0
Two-party-preferred result
Labor Tom Burke 33,58156.0+20.5
United Australia Walter Nairn 26,35144.0-20.5
Labor gain from United Australia Swing +20.5

Swan

1943 Australian federal election: Swan
PartyCandidateVotes%±%
Labor Don Mountjoy 25,69050.1+21.9
Country Thomas Marwick 18,12435.3-17.7
Country Cecil Elsegood5,63211.0+11.0
Independent John Tregenza1,8593.6+3.6
Total formal votes51,30597.4
Informal votes1,3692.6
Turnout 52,67494.8
Two-party-preferred result
Labor Don Mountjoy 53.0+10.5
Country Thomas Marwick 47.0−10.5
Labor gain from Country Swing +10.5

Tasmania

1943 Australian federal election (Tasmania)
Flag of Tasmania.svg
  1940 21 August 1943 1946  

All 5 Tasmanian seats in the House of Representatives
3 seats needed for a majority
 First partySecond party
  JohnCurtin.jpg FaddenPEO.jpg
Leader John Curtin Arthur Fadden
Party Labor Coalition
Seats before23
Seats won32
Seat changeIncrease2.svg 1Decrease2.svg 1
Popular vote66,16855,172
Percentage49.3%41.1%
SwingIncrease2.svg 10.5ppDecrease2.svg 2.1pp
TPP 54.8%45.2%

Bass

1943 Australian federal election: Bass
PartyCandidateVotes%±%
Labor Claude Barnard 13,13651.2+1.8
United Australia Desmond Oldham7,08527.6−17.1
Independent John Orchard 4,50917.6+17.6
Independent John Watson4691.8−4.2
Independent Harold Harwood4401.7+1.7
Total formal votes25,63996.1
Informal votes1,0393.9
Turnout 26,67898.4
Two-party-preferred result
Labor Claude Barnard 14,69157.3+3.1
United Australia Desmond Oldham10,94742.7−3.1
Labor hold Swing +3.1

Darwin

1943 Australian federal election: Darwin
PartyCandidateVotes%±%
Labor Eric Reece 7,79928.6+1.6
United Australia Dame Enid Lyons 7,34926.9-10.3
Labor Carrol Bramich 3,83214.0+14.0
United Australia John Leary3,10411.4+11.4
United Australia John Wright 2,88510.6+10.6
Independent Labor Edgar Nicholls1,7096.3+6.3
Communist Roy Harvey6162.3+2.3
Total formal votes27,29495.3
Informal votes1,3554.7
Turnout 28,64996.0
Two-party-preferred result
United Australia Dame Enid Lyons 14,05551.5-7.7
Labor Eric Reece 13,23948.5+7.7
United Australia hold Swing -7.7

Denison

1943 Australian federal election: Denison
PartyCandidateVotes%±%
Labor Frank Gaha 13,20847.3-1.6
United Australia Arthur Beck 10,80338.7-12.4
Independent Labor Gerald Mahoney 3,12011.2+11.2
Communist George Walliss7732.8+2.8
Total formal votes27,90496.2
Informal votes1,0943.8
Turnout 28,99898.4
Two-party-preferred result
Labor Frank Gaha 16,49359.0+10.1
United Australia Arthur Beck 11,41140.9-10.1
Labor gain from United Australia Swing +10.1

Franklin

1943 Australian federal election: Franklin
PartyCandidateVotes%±%
Labor Charles Frost 17,19558.9+5.4
United Australia Denis Warner 9,10131.2-5.4
United Australia Charles Tennant2,9039.9+9.9
Total formal votes29,19997.7
Informal votes8312.8
Turnout 30,03096.2
Two-party-preferred result
Labor Charles Frost 17,49059.9+6.4
United Australia Denis Warner 11,70840.1-6.4
Labor hold Swing +6.4

Wilmot

1943 Australian federal election: Wilmot
PartyCandidateVotes%±%
United Australia Allan Guy 19,41749.6-7.5
Labor Ern Pinkard10,99445.6+2.2
Independent John McGeary1,2595.2+5.2
Total formal votes24,10597.4
Informal votes6562.6
Turnout 24,76196.0
Two-party-preferred result
United Australia Allan Guy 12,46351.7-3.3
Labor Ernest Pinkard11,64248.3+3.3
United Australia hold Swing -3.3

Northern Territory

Northern Territory

1943 Australian federal election: Northern Territory
PartyCandidateVotes%±%
Independent Adair Blain 85935.5-3.4
Independent Labor Bob Murray68228.2-3.4
Independent Labor Jock Nelson 60224.9+24.9
Independent Sydney Barker994.1+4.1
Independent Hector Fuller994.1+4.1
Independent Alexander Grant431.8+1.8
One Parliament Harry Russell361.5+1.5
Total formal votes2,42097.7
Informal votes582.3
Turnout 2,47859.1
Two-party-preferred result
Independent Adair Blain 1,27452.6-9.2
Independent Labor Bob Murray1,14647.4+9.2
Independent hold Swing -9.6

See also

Related Research Articles

<span class="mw-page-title-main">Lance Barnard</span> Australian politician and diplomat

Lance Herbert Barnard AO was an Australian politician and diplomat. He was the deputy leader of the Australian Labor Party (ALP) from 1967 to 1974 and held senior ministerial office in the Whitlam government, most notably as Deputy Prime Minister of Australia from 1972 to 1974.

<span class="mw-page-title-main">Division of Eden-Monaro</span> Australian federal electoral division

The Division of Eden-Monaro is an Australian electoral division in the state of New South Wales.

<span class="mw-page-title-main">Division of Barker</span> Australian federal electoral division

The Division of Barker is an Australian Electoral Division in the south-east of South Australia. The division was established on 2 October 1903, when South Australia's original single multi-member division was split into seven single-member divisions. It is named for Collet Barker, an early explorer of the region at the mouth of the Murray River. The 63,886 km² seat currently stretches from Morgan in the north to Port MacDonnell in the south, taking in the Murray Mallee, the Riverland, the Murraylands and most of the Barossa Valley, and includes the towns of Barmera, Berri, Bordertown, Coonawarra, Keith, Kingston SE, Loxton, Lucindale, Mannum, Millicent, Mount Gambier, Murray Bridge, Naracoorte, Penola, Renmark, Robe, Tailem Bend, Waikerie, and parts of Nuriootpa and Tanunda.

<span class="mw-page-title-main">Division of Forrest</span> Australian federal electoral division

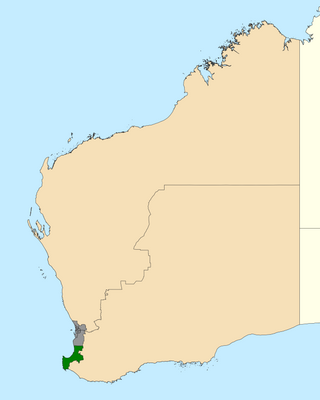
The Division of Forrest is an Australian Electoral Division in Western Australia.

<span class="mw-page-title-main">Division of Maranoa</span> Australian federal electoral division

The Division of Maranoa is an Australian electoral division in Queensland.

<span class="mw-page-title-main">Division of Wentworth</span> Australian federal electoral division

The Division of Wentworth is an Australian electoral division in the state of New South Wales. The division encompasses the suburbs to the east of Sydney CBD, mostly Woollahra and Waverley council in Sydney's Eastern Suburbs.

<span class="mw-page-title-main">Division of New England</span> Australian federal electoral division

The Division of New England is an Australian electoral division in the state of New South Wales.

<span class="mw-page-title-main">NSW Liberal Party</span> Political party in New South Wales

The New South Wales Liberal Party, officially called the Liberal Party of Australia, New South Wales Division, and colloquially known as the NSW Liberal Party, is the state division of the Liberal Party of Australia in New South Wales. The party is currently in Opposition in New South Wales in a coalition with the National Party. The party is part of the federal Liberal Party which is in opposition on the mainland of Australia, with Tasmania being the exception.

<span class="mw-page-title-main">Lang Labor</span> Political party in Australia

Lang Labor was a faction of the Australian Labor Party (ALP) consisting of the supporters of Jack Lang, who served two terms as Premier of New South Wales and was the party's state leader from 1923 to 1939. It controlled the New South Wales branch of the ALP throughout most of the 1920s and 1930s. The faction broke away to form separate parliamentary parties on several occasions and stood competing candidates against the ALP in state and federal elections.

The Australian Labor Party (Non-Communist), which operated from 1940 to 1941, was a breakaway from the Australian Labor Party (ALP), and was associated with the Lang Labor faction and former New South Wales premier Jack Lang.

The State Labor Party, also known as State Labor Party (Hughes-Evans), was an Australian political party which operated exclusively in the state of New South Wales (NSW) in the early 1940s. The party was initially a far-left faction of the Australian Labor Party, strongly opposed to the right-wing faction of the party dominated by Jack Lang, the NSW Premier between 1925 and 1927, and again between 1930 and 1932.

<span class="mw-page-title-main">1943 Australian federal election</span> Australian federal election

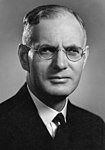
The 1943 Australian federal election was held in Australia on 21 August 1943. All 74 seats in the House of Representatives and 19 of the 36 seats in the Senate were up for election. The incumbent Labor Party, led by Prime Minister John Curtin, defeated the opposition Country–UAP coalition led by Arthur Fadden in a landslide.

<span class="mw-page-title-main">1940 Australian federal election</span> Australian federal election

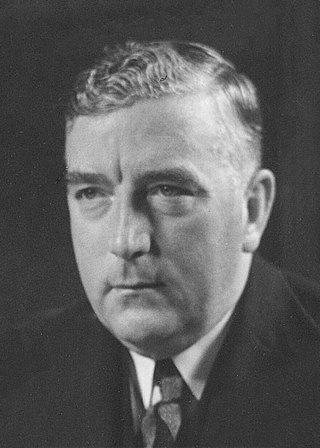
The 1940 Australian federal election was held in Australia on 21 September 1940. All 74 seats in the House of Representatives and 19 of the 36 seats in the Senate were up for election. The incumbent Coalition, consisting of the United Australia Party led by Prime Minister Robert Menzies and the Country Party led by Archie Cameron, defeated the opposition Labor Party under John Curtin despite losing the overall popular vote.

The Liberal Democratic Party (LDP) was an Australian breakaway political party of the United Australia Party that contested the 1943 federal election and the 1944 New South Wales state election. Formed in 1943, it was replaced by the New South Wales division of the Liberal Party of Australia in January 1945.

This is a list of members of the Western Australian Legislative Assembly between the 1939 election and the 1943 election, together known as the 17th Parliament.

Members of the New South Wales Legislative Assembly who served in the 33rd parliament held their seats from 1941 to 1944. They were elected at the 1941 state election, and at by-elections. During this term, the opposition United Australia Party merged with the new Commonwealth Party to form the Democratic Party in late 1943. The merger was only at a state level, however; the federal United Australia Party, however, remained intact during this period. The Speaker was Daniel Clyne.

This is a list of members of the Victorian Legislative Assembly from 1943 to 1945, as elected at the 1943 state election.

The Democratic Party was a short-lived, urban, conservative political party which was active in New South Wales, Australia between November 1943 and 1945. The Democratic Party was formed in November 1943 by the union of the United Australia Party (UAP) in New South Wales and the Commonwealth Party. It was one of the main conservative parties in New South Wales and contested the 1944 state election as a coalition with Country Party.

The Commonwealth Party was a short-lived, urban, conservative political party in New South Wales between May 1943 and January 1944.

References

  1. "Australian Legislative Election of 21 August 1943" (txt). Adam Carr's Election Archive. Retrieved 23 August 2023.