The electoral system of Australia comprises the laws and processes used for the election of members of the Australian Parliament and is governed primarily by the Commonwealth Electoral Act 1918. The system presently has a number of distinctive features including compulsory enrolment; compulsory voting; majority-preferential instant-runoff voting in single-member seats to elect the lower house, the House of Representatives; and the use of the single transferable vote proportional representation system to elect the upper house, the Senate.
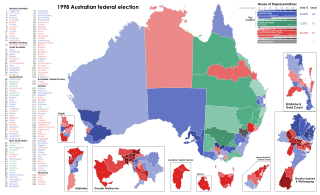
The 1998 Australian federal election was held to determine the members of the 39th Parliament of Australia. It was held on 3 October 1998. All 148 seats of the House of Representatives and 40 seats of the 76-seat Senate were up for election. The incumbent centre-right Liberal/National Coalition government led by Prime Minister John Howard of the Liberal Party and coalition partner Tim Fischer of the National Party defeated the centre-left Australian Labor Party opposition led by Opposition Leader Kim Beazley, despite losing the nationwide popular and two-party preferred vote. However, the Australian Labor Party gained seats from the previous election.

The Family First Party was a conservative political party in Australia which existed from 2002 to 2017. It was founded in South Australia where it enjoyed its greatest electoral support. Since the demise of the Australian Conservatives into which it merged, it has been refounded in that state as the Family First Party (2021), where it contested the state election in 2022, but failed to win a seat.
The Division of Barker is an Australian electoral division in the south-east of South Australia. The division was established on 2 October 1903, when South Australia's original single multi-member division was split into seven single-member divisions. It is named for Collet Barker, an early explorer of the region at the mouth of the Murray River. The 63,886 km² seat currently stretches from Morgan in the north to Port MacDonnell in the south, taking in the Murray Mallee, the Riverland, the Murraylands and most of the Barossa Valley, and includes the towns of Barmera, Berri, Bordertown, Coonawarra, Keith, Kingston SE, Loxton, Lucindale, Mannum, Millicent, Mount Gambier, Murray Bridge, Naracoorte, Penola, Renmark, Robe, Tailem Bend, Waikerie, and parts of Nuriootpa and Tanunda.
The Division of Grey is an Australian electoral division in South Australia. The division was one of the seven established when the former Division of South Australia was redistributed on 2 October 1903 and is named for Sir George Grey, who was Governor of South Australia from 1841 to 1845.
The Division of Mayo is an Australian electoral division located to the east and south of Adelaide, South Australia. Created in the state redistribution of 3 September 1984, the division is named after Helen Mayo, a social activist and the first woman elected to an Australian University Council. The 9,315 km2 rural seat covers an area from the Barossa Valley in the north to Cape Jervis in the south. Taking in the Adelaide Hills, Fleurieu Peninsula and Kangaroo Island regions, its largest population centre is Mount Barker. Its other population centres are Aldgate, Bridgewater, Littlehampton, McLaren Vale, Nairne, Stirling, Strathalbyn and Victor Harbor, and its smaller localities include American River, Ashbourne, Balhannah, Brukunga, Carrickalinga, Charleston, Cherry Gardens, Clarendon, Crafers, Cudlee Creek, Currency Creek, Delamere, Echunga, Forreston, Goolwa, Gumeracha, Hahndorf, Houghton, Inglewood, Kersbrook, Kingscote, Langhorne Creek, Lobethal, Macclesfield, McLaren Flat, Meadows, Middleton, Milang, Mount Compass, Mount Pleasant, Mount Torrens, Mylor, Myponga, Normanville, Norton Summit, Oakbank, Penneshaw, Piccadilly, Port Elliot, Second Valley, Springton, Summertown, Uraidla, Willunga, Woodchester, Woodside, Yankalilla, and parts of Birdwood, Old Noarlunga and Upper Sturt.

The Libertarian Party, formerly known as the Liberal Democratic Party (LDP), is an Australian political party founded in Canberra in 2001. The party espouses smaller government and supports policies that are based on classical liberal, libertarian principles, such as lower taxes, opposing restrictions on civil liberties, decentralisation, uranium mining, and the relaxation of smoking laws.

In Australian politics, the two-party-preferred vote is the result of an election or opinion poll after preferences have been distributed to the highest two candidates, who in some cases can be independents. For the purposes of TPP, the Liberal/National Coalition is usually considered a single party, with Labor being the other major party. Typically the TPP is expressed as the percentages of votes attracted by each of the two major parties, e.g. "Coalition 50%, Labor 50%", where the values include both primary votes and preferences. The TPP is an indicator of how much swing has been attained/is required to change the result, taking into consideration preferences, which may have a significant effect on the result.

The 2010 Australian federal election was held on Saturday, 21 August 2010 to elect members of the 43rd Parliament of Australia. The incumbent centre-left Australian Labor Party led by Prime Minister Julia Gillard won a second term against the opposition centre-right Liberal Party of Australia led by Opposition Leader Tony Abbott and Coalition partner the National Party of Australia, led by Warren Truss, after Labor formed a minority government with the support of three independent MPs and one Australian Greens MP.

Shayne Kenneth Neumann is an Australian politician. He was elected to the Federal seat of Blair in November 2007, and re-elected in 2010, 2013, 2016, 2019 and 2022. In March 2013, Shayne was appointed Parliamentary Secretary to the Attorney-General and Parliamentary Secretary for Health and Ageing. After the 2013 Federal election, he was appointed Shadow Minister for Indigenous Affairs and for Ageing. In 2016, he was appointed Shadow Minister for Immigration and Border Protection. After the 2019 Federal election, he was appointed Shadow Minister for Veterans' Affairs and Defence Personnel.

The following tables show state-by-state results in the Australian Senate at the 2007 federal election, 37 Coalition, 32 Labor, five Green, one Family First, and one independent, Nick Xenophon. Senators are elected for six-year terms, and took their seats from 1 July 2008, but senators representing the territories have three-year terms and take their seats immediately.

The 2013 Australian federal election to elect the members of the 44th Parliament of Australia took place on Saturday 7 September 2013. The centre-right Liberal/National Coalition opposition led by Opposition leader Tony Abbott of the Liberal Party of Australia and Coalition partner the National Party of Australia, led by Warren Truss, defeated the incumbent centre-left Labor Party government of Prime Minister Kevin Rudd in a landslide. It was also the third time in history that a party won 90 or more seats at an Australian election. Labor had been in government for six years since being elected in the 2007 election. This election marked the end of the Rudd-Gillard-Rudd Labor government and the start of the 9 year long Abbott-Turnbull-Morrison Liberal-National Coalition government. Abbott was sworn in by the Governor-General, Quentin Bryce, as Australia's new Prime Minister on 18 September 2013, along with the Abbott Ministry. The 44th Parliament of Australia opened on 12 November 2013, with the members of the House of Representatives and territory senators sworn in. The state senators were sworn in by the next Governor-General Peter Cosgrove on 7 July 2014, with their six-year terms commencing on 1 July.
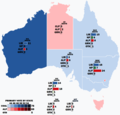
The following tables show state-by-state results in the Australian House of Representatives at the 2010 federal election, Labor 72, Coalition 72, Nationals (WA) 1, Australian Greens 1, with 4 independents.
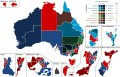
The following tables show state-by-state results in the Australian House of Representatives at the 2013 federal election, Coalition 90, Labor 55, Australian Greens 1, Palmer United Party 1, Katter's Australian Party 1, with 2 independents.

The 2018 South Australian state election to elect members to the 54th Parliament of South Australia was held on 17 March 2018. All 47 seats in the House of Assembly or lower house, whose members were elected at the 2014 election, and 11 of 22 seats in the Legislative Council or upper house, last filled at the 2010 election, were contested. The record-16-year-incumbent Australian Labor Party (SA) government led by Premier Jay Weatherill was seeking a fifth four-year term, but was defeated by the opposition Liberal Party of Australia (SA), led by Opposition Leader Steven Marshall. Nick Xenophon's new SA Best party unsuccessfully sought to obtain the balance of power.
Section 13 of the Constitution of Australia provides for three aspects of the terms of members of the Australian Senate: the timing of elections, the commencement date of their terms and for the Senate to allocate long (six-year) and short (three-year) terms following a double dissolution of the Parliament of Australia. While members of the House of Representatives and territory senators have a maximum three-year term, state senators have a fixed six-year term, subject only to the parliament being dissolved by a double dissolution.
Centre Alliance (CA), formerly known as the Nick Xenophon Team (NXT), is a centrist Australian political party based in the state of South Australia. It currently has one elected representative, Rebekha Sharkie in the House of Representatives.

The 2016 Australian federal election in the Senate was part of a double dissolution election held on Saturday 2 July to elect all 226 members of the 45th Parliament of Australia, after an extended eight-week official campaign period. It was the first double dissolution election since the 1987 election and the first under a new voting system for the Senate that replaced group voting tickets with optional preferential voting.

The 2022 Australian federal election was held on Saturday 21 May 2022 to elect members of the 47th Parliament of Australia. The incumbent Liberal/National Coalition government, led by Prime Minister Scott Morrison, sought to win a fourth consecutive term in office but was defeated by the opposition Labor Party, led by Anthony Albanese. Up for election were all 151 seats in the lower house, the House of Representatives, as well as 40 of the 76 seats in the upper house, the Senate.

The 2022 Australian federal election in the Senate was held on 21 May 2022 to elect 40 of the 76 senators in the Australian Senate, after a six-week campaign. Senators elected at this election took office on 1 July 2022, with the exception of the Senators elected from two territories whose terms commenced from election day. The elected senators sit alongside continuing senators elected in 2019 as part of the 47th Parliament of Australia.