This is a list of electoral division results for the Australian 1919 federal election.
Party | Candidate | Votes | % | ±% | |
---|---|---|---|---|---|
Labor | Michael Considine | 8,786 | 51.7 | +1.8 | |
Returned Soldiers | Arthur Lawrence | 4,735 | 27.9 | +27.9 | |
Nationalist | Charles McAllister | 3,476 | 20.5 | +15.3 | |
Total formal votes | 16,997 | 96.4 | |||
Informal votes | 637 | 3.6 | |||
Turnout | 17,634 | 65.7 | |||
Two-party-preferred result | |||||
Labor | Michael Considine | 53.8 | +53.8 | ||
Returned Soldiers | Arthur Lawrence | 46.2 | +46.2 | ||
Labor hold | Swing | +53.8 | |||
Party | Candidate | Votes | % | ±% | |
---|---|---|---|---|---|
Labor | Thomas Lavelle | 12,628 | 52.3 | +4.1 | |
Nationalist | Henry Pigott | 11,526 | 47.7 | −4.1 | |
Total formal votes | 24,154 | 98.6 | |||
Informal votes | 340 | 1.4 | |||
Turnout | 24,494 | 75.0 | |||
Labor gain from Nationalist | Swing | +4.1 | |||
Party | Candidate | Votes | % | ±% | |
---|---|---|---|---|---|
Labor | James Catts | 14,559 | 62.3 | −2.1 | |
Nationalist | George Holt | 7,248 | 31.0 | −4.6 | |
Ind. Socialist Labor | William McCristal | 1,562 | 6.7 | +6.7 | |
Total formal votes | 23,369 | 90.2 | |||
Informal votes | 2,540 | 9.8 | |||
Turnout | 25,909 | 66.1 | |||
Two-party-preferred result | |||||
Labor | James Catts | 65.7 | +1.3 | ||
Nationalist | George Holt | 34.3 | −1.3 | ||
Labor hold | Swing | +1.3 | |||
Party | Candidate | Votes | % | ±% | |
---|---|---|---|---|---|
Farmers and Settlers | Earle Page | 11,372 | 52.4 | +52.4 | |
Labor | Ross Pryor | 5,712 | 26.3 | +26.3 | |
Nationalist | John Thomson | 4,524 | 21.3 | −78.7 | |
Total formal votes | 21,708 | 94.8 | |||
Informal votes | 1,197 | 5.2 | |||
Turnout | 22,905 | 65.0 | |||
Two-party-preferred result | |||||
Farmers and Settlers | Earle Page | 71.6 | +71.6 | ||
Labor | Ross Pryor | 28.4 | +28.4 | ||
Farmers and Settlers gain from Nationalist | Swing | +71.6 | |||
Party | Candidate | Votes | % | ±% | |
---|---|---|---|---|---|
Labor | William Mahony | 16,242 | 59.7 | +5.7 | |
Nationalist | Walter Clutton | 10,956 | 40.3 | −5.7 | |
Total formal votes | 27,198 | 97.6 | |||
Informal votes | 657 | 2.4 | |||
Turnout | 27,855 | 69.1 | |||
Labor hold | Swing | +5.7 | |||
Party | Candidate | Votes | % | ±% | |
---|---|---|---|---|---|
Labor | Arthur Blakeley | 11,344 | 61.8 | +8.5 | |
Nationalist | Alfred Perkins | 7,004 | 38.2 | −8.5 | |
Total formal votes | 18,348 | 97.8 | |||
Informal votes | 417 | 2.2 | |||
Turnout | 18,765 | 67.8 | |||
Labor hold | Swing | +8.5 | |||
Party | Candidate | Votes | % | ±% | |
---|---|---|---|---|---|
Labor | John West | 12,751 | 57.8 | -42.2 | |
Nationalist | John Willson | 9,327 | 42.2 | +42.2 | |
Total formal votes | 22,078 | 97.3 | |||
Informal votes | 617 | 2.7 | |||
Turnout | 22,695 | 58.1 | |||
Labor hold | Swing | -42.2 | |||
Party | Candidate | Votes | % | ±% | |
---|---|---|---|---|---|
Nationalist | Austin Chapman | 10,253 | 51.2 | -6.0 | |
Labor | Harry Brown | 9,770 | 48.8 | +6.0 | |
Total formal votes | 20,023 | 98.4 | |||
Informal votes | 330 | 1.6 | |||
Turnout | 20,353 | 69.8 | |||
Nationalist hold | Swing | -6.0 | |||
Party | Candidate | Votes | % | ±% | |
---|---|---|---|---|---|
Labor | Lou Cunningham | 10,333 | 49.1 | +5.6 | |
Nationalist | William Webster | 8,699 | 41.4 | -15.1 | |
Independent | James Bell | 1,992 | 9.5 | +9.5 | |
Total formal votes | 21,024 | 93.4 | |||
Informal votes | 1,477 | 6.6 | |||
Turnout | 22,501 | 69.4 | |||
Two-party-preferred result | |||||
Labor | Lou Cunningham | 11,183 | 53.2 | +9.7 | |
Nationalist | William Webster | 9,841 | 46.8 | -9.7 | |
Labor gain from Nationalist | Swing | +9.7 | |||
Party | Candidate | Votes | % | ±% | |
---|---|---|---|---|---|
Labor | Parker Moloney | 11,702 | 52.6 | +4.5 | |
Nationalist | Edwin Townsend | 5,288 | 23.8 | −28.1 | |
Farmers and Settlers | Charles Milthorpe | 5,149 | 23.1 | +23.1 | |
Independent | Andrew Scambler | 125 | 0.6 | +0.6 | |
Total formal votes | 22,264 | 92.8 | |||
Informal votes | 1,735 | 7.2 | |||
Turnout | 23,999 | 70.7 | |||
Two-party-preferred result | |||||
Labor | Parker Moloney | 57.5 | +9.4 | ||
Nationalist | Edwin Townsend | 42.5 | −9.4 | ||
Labor gain from Nationalist | Swing | +9.4 | |||
Party | Candidate | Votes | % | ±% | |
---|---|---|---|---|---|
Labor | Matthew Charlton | 13,692 | 58.9 | +5.5 | |
Nationalist | John Lee | 9,558 | 41.1 | -5.5 | |
Total formal votes | 23,250 | 98.0 | |||
Informal votes | 485 | 2.0 | |||
Turnout | 23,735 | 60.9 | |||
Labor hold | Swing | +5.5 | |||
Party | Candidate | Votes | % | ±% | |
---|---|---|---|---|---|
Nationalist | Hector Lamond | 15,419 | 50.6 | -3.7 | |
Labor | Bertie Sheiles | 12,520 | 41.1 | -4.6 | |
Ind. Socialist Labor | George Burns | 2,075 | 6.8 | +6.8 | |
Independent | Thomas Marshall | 446 | 1.5 | +1.5 | |
Total formal votes | 30,460 | 90.8 | |||
Informal votes | 4,080 | 9.2 | |||
Turnout | 33,540 | 71.8 | |||
Two-party-preferred result | |||||
Nationalist | Hector Lamond | 53.1 | -1.2 | ||
Labor | Bertie Sheiles | 46.9 | +1.2 | ||
Nationalist hold | Swing | -1.2 | |||
Party | Candidate | Votes | % | ±% | |
---|---|---|---|---|---|
Nationalist | Elliot Johnson | 18,939 | 57.3 | -3.1 | |
Labor | Archibald Moate | 14,105 | 42.7 | +3.1 | |
Total formal votes | 33,044 | 98.5 | |||
Informal votes | 515 | 1.5 | |||
Turnout | 33,559 | 67.6 | |||
Nationalist hold | Swing | -3.1 | |||
Party | Candidate | Votes | % | ±% | |
---|---|---|---|---|---|
Labor | Samuel Nicholls | 13,455 | 53.2 | +3.2 | |
Nationalist | Ernest Carr | 11,859 | 46.8 | -3.2 | |
Total formal votes | 25,314 | 98.4 | |||
Informal votes | 407 | 1.6 | |||
Turnout | 25,721 | 73.3 | |||
Labor hold | Swing | +3.2 | |||
Party | Candidate | Votes | % | ±% | |
---|---|---|---|---|---|
Nationalist | Eric Bowden | 20,630 | 57.1 | -3.4 | |
Labor | Con Wallace | 15,524 | 42.9 | +3.4 | |
Total formal votes | 36,154 | 97.8 | |||
Informal votes | 814 | 2.2 | |||
Turnout | 36,968 | 68.6 | |||
Nationalist hold | Swing | -3.4 | |||
Party | Candidate | Votes | % | ±% | |
---|---|---|---|---|---|
Nationalist | Alexander Hay | 12,622 | 57.3 | -42.7 | |
Labor | James Tully | 9,390 | 42.7 | +42.7 | |
Total formal votes | 22,012 | 98.0 | |||
Informal votes | 442 | 2.0 | |||
Turnout | 22,454 | 69.7 | |||
Nationalist hold | Swing | -42.7 | |||
Party | Candidate | Votes | % | ±% | |
---|---|---|---|---|---|
Labor | David Watkins | unopposed | |||
Labor hold | Swing | ||||
Party | Candidate | Votes | % | ±% | |
---|---|---|---|---|---|
Nationalist | Sir Granville Ryrie | 26,438 | 75.5 | -24.5 | |
Labor | Cecil Murphy | 8,558 | 24.5 | +24.5 | |
Total formal votes | 34,996 | 98.2 | |||
Informal votes | 643 | 1.8 | |||
Turnout | 35,639 | 66.9 | |||
Nationalist hold | Swing | -24.5 | |||
Party | Candidate | Votes | % | ±% | |
---|---|---|---|---|---|
Nationalist | Charles Marr | 18,276 | 45.6 | -19.8 | |
Labor | Arthur Jones | 13,807 | 34.4 | -0.2 | |
Ind. Nationalist | Bruce Smith | 8,032 | 20.0 | +20.0 | |
Total formal votes | 40,115 | 92.1 | |||
Informal votes | 3,437 | 7.9 | |||
Turnout | 43,552 | 66.0 | |||
Two-party-preferred result | |||||
Nationalist | Charles Marr | 25,512 | 63.6 | -1.8 | |
Labor | Arthur Jones | 14,603 | 36.4 | +1.8 | |
Nationalist hold | Swing | -1.8 | |||
Party | Candidate | Votes | % | ±% | |
---|---|---|---|---|---|
Nationalist | Sir Joseph Cook | 27,000 | 72.6 | -1.2 | |
Labor | William Hutchinson | 10,205 | 27.4 | +27.4 | |
Total formal votes | 37,205 | 98.6 | |||
Informal votes | 536 | 1.4 | |||
Turnout | 37,741 | 66.2 | |||
Nationalist hold | Swing | -1.2 | |||
Party | Candidate | Votes | % | ±% | |
---|---|---|---|---|---|
Nationalist | Walter Massy-Greene | 14,215 | 66.9 | -8.3 | |
Labor | Ernest O'Dea | 4,650 | 21.9 | -2.9 | |
Independent | John Steel | 2,384 | 11.2 | +11.2 | |
Total formal votes | 21,249 | 93.8 | |||
Informal votes | 1,412 | 6.2 | |||
Turnout | 22,661 | 66.7 | |||
Two-party-preferred result | |||||
Nationalist | Walter Massy-Greene | 72.5 | -2.7 | ||
Labor | Ernest O'Dea | 27.5 | +2.7 | ||
Nationalist hold | Swing | -2.7 | |||
Party | Candidate | Votes | % | ±% | |
---|---|---|---|---|---|
Nationalist | John Chanter | 11,114 | 51.3 | -7.9 | |
Labor | James Hoad | 10,530 | 48.7 | +7.9 | |
Total formal votes | 21,644 | 97.8 | |||
Informal votes | 480 | 2.2 | |||
Turnout | 22,124 | 63.8 | |||
Nationalist hold | Swing | -7.9 | |||
Party | Candidate | Votes | % | ±% | |
---|---|---|---|---|---|
Nationalist | William Fleming | 11,468 | 53.5 | -2.7 | |
Labor | James Kelly | 9,987 | 46.5 | +2.7 | |
Total formal votes | 21,455 | 98.3 | |||
Informal votes | 367 | 1.7 | |||
Turnout | 21,822 | 65.7 | |||
Nationalist hold | Swing | -2.7 | |||
Party | Candidate | Votes | % | ±% | |
---|---|---|---|---|---|
Labor | Edward Riley | 17,521 | 68.3 | +5.0 | |
Nationalist | Frederick Sykes | 8,123 | 31.7 | -5.0 | |
Total formal votes | 25,644 | 97.9 | |||
Informal votes | 559 | 2.1 | |||
Turnout | 26,203 | 59.9 | |||
Labor hold | Swing | +5.0 | |||
Party | Candidate | Votes | % | ±% | |
---|---|---|---|---|---|
Nationalist | Walter Marks | 20,768 | 61.5 | -7.0 | |
Labor | James Dunn | 12,998 | 38.5 | +7.0 | |
Total formal votes | 33,766 | 98.3 | |||
Informal votes | 595 | 1.7 | |||
Turnout | 34,361 | 63.9 | |||
Nationalist hold | Swing | -7.0 | |||
Party | Candidate | Votes | % | ±% | |
---|---|---|---|---|---|
Labor | Bert Lazzarini | 11,948 | 49.6 | +2.4 | |
Nationalist | John Lynch | 7,600 | 31.6 | −21.2 | |
Independent | William Wright | 4,536 | 18.8 | +18.8 | |
Total formal votes | 24,084 | 92.1 | |||
Informal votes | 2,063 | 7.9 | |||
Turnout | 26,147 | 71.6 | |||
Two-party-preferred result | |||||
Labor | Bert Lazzarini | 12,275 | 51.0 | +3.8 | |
Nationalist | John Lynch | 11,809 | 49.0 | −3.8 | |
Labor gain from Nationalist | Swing | +3.8 | |||
Party | Candidate | Votes | % | ±% | |
---|---|---|---|---|---|
Labor | Thomas Ryan | 14,234 | 72.2 | +5.7 | |
Nationalist | Richard Sleath | 5,488 | 27.8 | -5.7 | |
Total formal votes | 19,722 | 96.4 | |||
Informal votes | 738 | 3.6 | |||
Turnout | 20,460 | 66.7 | |||
Labor hold | Swing | +5.7 | |||
Party | Candidate | Votes | % | ±% | |
---|---|---|---|---|---|
Nationalist | William Watt | 19,051 | 58.2 | −8.4 | |
Labor | Percy Smith | 9,311 | 28.4 | −5.0 | |
Returned Services | Norman Worrall | 4,388 | 13.4 | +13.4 | |
Total formal votes | 32,750 | 95.7 | |||
Informal votes | 1,457 | 4.3 | |||
Turnout | 34,207 | 73.4 | |||
Two-party-preferred result | |||||
Nationalist | William Watt | 64.9 | −1.7 | ||
Labor | Percy Smith | 35.1 | +1.7 | ||
Nationalist hold | Swing | −1.7 | |||
Party | Candidate | Votes | % | ±% | |
---|---|---|---|---|---|
Nationalist | Edwin Kerby | 13,569 | 50.0 | +50.0 | |
Labor | Charles McGrath | 13,568 | 50.0 | −50.0 | |
Total formal votes | 27,137 | 99.3 | |||
Informal votes | 202 | 0.7 | |||
Turnout | 27,339 | 82.5 | |||
Nationalist gain from Labor | Swing | +50.0 | |||
Party | Candidate | Votes | % | ±% | |
---|---|---|---|---|---|
Labor | Charles McGrath | 15,058 | 51.7 | +1.7 | |
Nationalist | Edwin Kerby | 11,443 | 39.3 | −10.7 | |
Farmers | John Troup | 2,413 | 8.3 | +8.3 | |
Independent | Edward Callow | 186 | 0.6 | +0.6 | |
Total formal votes | 29,100 | 99.3 | |||
Informal votes | 214 | 0.7 | |||
Turnout | 29,314 | 76.7 | |||
Two-party-preferred result | |||||
Labor | Charles McGrath | 56.1 | +6.1 | ||
Nationalist | Edwin Kerby | 45.9 | −6.1 | ||
Labor gain from Nationalist | Swing | +6.1 | |||
Party | Candidate | Votes | % | ±% | |
---|---|---|---|---|---|
Labor | Frank Brennan | 16,039 | 57.1 | -3.8 | |
Nationalist | William Spence | 12,064 | 42.9 | +3.8 | |
Total formal votes | 28,103 | 98.4 | |||
Informal votes | 466 | 1.6 | |||
Turnout | 28,569 | 76.8 | |||
Labor hold | Swing | -3.8 | |||
Party | Candidate | Votes | % | ±% | |
---|---|---|---|---|---|
Nationalist | Billy Hughes | 14,291 | 55.0 | −2.4 | |
Labor | Alfred Hampson | 11,676 | 45.0 | +2.4 | |
Total formal votes | 25,967 | 99.3 | |||
Informal votes | 186 | 0.7 | |||
Turnout | 26,153 | 82.8 | |||
Nationalist hold | Swing | −2.4 | |||
Party | Candidate | Votes | % | ±% | |
---|---|---|---|---|---|
Labor | Frank Anstey | 21,359 | 53.2 | −1.3 | |
Nationalist | Reginald Tracey | 18,814 | 46.8 | +1.3 | |
Total formal votes | 40,173 | 99.0 | |||
Informal votes | 390 | 1.0 | |||
Turnout | 40,563 | 76.0 | |||
Labor hold | Swing | −1.3 | |||
Party | Candidate | Votes | % | ±% | |
---|---|---|---|---|---|
Labor | Edward Malone | 10,280 | 37.4 | −2.2 | |
Victorian Farmers | William Gibson | 8,632 | 31.4 | +31.4 | |
Nationalist | Allan McDonald | 8,563 | 31.2 | −29.2 | |
Total formal votes | 27,475 | 96.6 | |||
Informal votes | 969 | 3.4 | |||
Turnout | 28,444 | 80.3 | |||
Two-party-preferred result | |||||
Victorian Farmers | William Gibson | 16,864 | 61.4 | +61.4 | |
Labor | Edward Malone | 10,611 | 38.6 | −1.0 | |
Victorian Farmers hold | Swing | +1.0 | |||
Party | Candidate | Votes | % | ±% | |
---|---|---|---|---|---|
Nationalist | John Lister | 13,702 | 45.3 | −12.0 | |
Labor | Alfred Ozanne | 11,658 | 38.5 | −4.2 | |
Victorian Farmers | Arthur Walter | 4,623 | 15.3 | +15.3 | |
Ind. Nationalist | Anwoth Brown | 282 | 0.9 | +0.9 | |
Total formal votes | 30,265 | 96.6 | |||
Informal votes | 1,056 | 3.4 | |||
Turnout | 31,321 | 80.6 | |||
Two-party-preferred result | |||||
Nationalist | John Lister | 17,406 | 57.5 | +0.2 | |
Labor | Alfred Ozanne | 12,859 | 42.5 | −0.2 | |
Nationalist hold | Swing | +0.2 | |||
Party | Candidate | Votes | % | ±% | |
---|---|---|---|---|---|
Victorian Farmers | William Hill | 11,411 | 43.3 | +43.3 | |
Nationalist | James Stewart | 8,734 | 33.1 | -27.6 | |
Labor | Edward Russell | 6,218 | 23.6 | -15.7 | |
Total formal votes | 26,363 | 96.9 | |||
Informal votes | 852 | 3.1 | |||
Turnout | 27,215 | 76.9 | |||
Two-party-preferred result | |||||
Victorian Farmers | William Hill | 16,878 | 64.0 | +64.0 | |
Nationalist | James Stewart | 9,485 | 36.0 | -24.7 | |
Victorian Farmers hold | Swing | +24.7 | |||
Party | Candidate | Votes | % | ±% | |
---|---|---|---|---|---|
Nationalist | George Maxwell | 15,819 | 51.5 | +0.4 | |
Labor | Joseph Hannan | 14,927 | 48.5 | +0.2 | |
Total formal votes | 30,746 | 99.2 | |||
Informal votes | 251 | 0.8 | |||
Turnout | 30,997 | 77.1 | |||
Nationalist hold | Swing | +0.1 | |||
Party | Candidate | Votes | % | ±% | |
---|---|---|---|---|---|
Nationalist | Stanley Bruce | 12,968 | 48.0 | -13.2 | |
Labor | Frederick Riley | 7,926 | 29.3 | -9.5 | |
Victorian Farmers | William Burrage | 6,126 | 22.7 | +22.7 | |
Total formal votes | 27,020 | 94.0 | |||
Informal votes | 1,713 | 6.0 | |||
Turnout | 28,733 | 70.1 | |||
Two-party-preferred result | |||||
Nationalist | Stanley Bruce | 17,693 | 65.5 | +4.3 | |
Labor | Frederick Riley | 9,327 | 34.5 | -4.3 | |
Nationalist hold | Swing | +4.3 | |||
Party | Candidate | Votes | % | ±% | |
---|---|---|---|---|---|
Nationalist | George Wise | 14,367 | 55.2 | -17.5 | |
Victorian Farmers | Erland Erlandson | 11,675 | 44.8 | +44.8 | |
Total formal votes | 26,042 | 98.7 | |||
Informal votes | 344 | 1.3 | |||
Turnout | 26,386 | 73.5 | |||
Nationalist hold | Swing | -17.5 | |||
Party | Candidate | Votes | % | ±% | |
---|---|---|---|---|---|
Victorian Farmers | Edmund Jowett | 13,736 | 58.2 | +58.2 | |
Labor | Mark Lazarus | 9,855 | 41.8 | -1.2 | |
Total formal votes | 23,591 | 98.6 | |||
Informal votes | 343 | 1.4 | |||
Turnout | 23,934 | 78.2 | |||
Victorian Farmers gain from Nationalist | Swing | +1.2 | |||
Party | Candidate | Votes | % | ±% | |
---|---|---|---|---|---|
Nationalist | James Boyd | 17,293 | 40.8 | -29.8 | |
Ind. Nationalist | Frederick Francis | 12,382 | 29.2 | +29.2 | |
Labor | Norman Grant | 9,582 | 22.6 | -6.8 | |
Ind. Nationalist | Edwin Purbrick | 3,097 | 7.3 | +7.3 | |
Total formal votes | 42,354 | 95.8 | |||
Informal votes | 1,864 | 4.2 | |||
Turnout | 44,218 | 74.7 | |||
Two-party-preferred result | |||||
Independent | Frederick Francis | 22,396 | 52.9 | +52.9 | |
Nationalist | James Boyd | 19,958 | 47.1 | -23.2 | |
Independent gain from Nationalist | Swing | +23.2 | |||
Party | Candidate | Votes | % | ±% | |
---|---|---|---|---|---|
Labor | Joseph Hanigan | 8,668 | 36.4 | −7.4 | |
Victorian Farmers | Robert Cook | 7,673 | 32.2 | +32.2 | |
Nationalist | John Leckie | 7,492 | 31.4 | −24.8 | |
Total formal votes | 23,833 | 96.4 | |||
Informal votes | 889 | 3.6 | |||
Turnout | 24,722 | 78.0 | |||
Two-party-preferred result | |||||
Victorian Farmers | Robert Cook | 14,922 | 62.6 | +62.6 | |
Labor | Joseph Hanigan | 8,911 | 37.4 | −6.4 | |
Victorian Farmers gain from Nationalist | Swing | +6.4 | |||
Party | Candidate | Votes | % | ±% | |
---|---|---|---|---|---|
Nationalist | Sir Robert Best | 22,732 | 62.5 | −37.5 | |
Ind. Nationalist | Stephen Thompson | 7,025 | 19.3 | +19.3 | |
Labor | Mary Grant | 6,589 | 18.1 | +18.1 | |
Total formal votes | 36,346 | 96.5 | |||
Informal votes | 1,331 | 3.5 | |||
Turnout | 37,677 | 76.6 | |||
Two-party-preferred result | |||||
Nationalist | Sir Robert Best | 64.3 | −35.7 | ||
Ind. Nationalist | Stephen Thompson | 35.7 | +35.7 | ||
Nationalist hold | Swing | −35.7 | |||
Party | Candidate | Votes | % | ±% | |
---|---|---|---|---|---|
Labor | James Fenton | 20,165 | 52.1 | -0.1 | |
Nationalist | Arthur Thompson | 18,509 | 47.9 | +0.1 | |
Total formal votes | 38,674 | 98.8 | |||
Informal votes | 467 | 1.2 | |||
Turnout | 39,141 | 78.2 | |||
Labor hold | Swing | -0.1 | |||
Party | Candidate | Votes | % | ±% | |
---|---|---|---|---|---|
Labor | William Maloney | 15,179 | 65.6 | +5.3 | |
Nationalist | Ernest Nicholls | 7,949 | 34.4 | -5.3 | |
Total formal votes | 23,128 | 98.1 | |||
Informal votes | 458 | 1.9 | |||
Turnout | 23,586 | 71.5 | |||
Labor hold | Swing | +5.3 | |||
Party | Candidate | Votes | % | ±% | |
---|---|---|---|---|---|
Labor | James Mathews | unopposed | |||
Labor hold | Swing | ||||
Party | Candidate | Votes | % | ±% | |
---|---|---|---|---|---|
Nationalist | Arthur Rodgers | 14,806 | 54.1 | -0.7 | |
Labor | John Collins | 12,577 | 45.9 | +0.7 | |
Total formal votes | 27,383 | 99.1 | |||
Informal votes | 261 | 0.9 | |||
Turnout | 27,644 | 79.3 | |||
Nationalist hold | Swing | -0.7 | |||
Party | Candidate | Votes | % | ±% | |
---|---|---|---|---|---|
Victorian Farmers | Percy Stewart | 15,963 | 59.5 | +59.5 | |
Nationalist | Sydney Sampson | 10,875 | 40.5 | -59.5 | |
Total formal votes | 26,838 | 98.3 | |||
Informal votes | 476 | 1.7 | |||
Turnout | 27,314 | 73.0 | |||
Victorian Farmers gain from Nationalist | Swing | +59.5 | |||
Party | Candidate | Votes | % | ±% | |
---|---|---|---|---|---|
Labor | Frank Tudor | 19,843 | 70.3 | -1.0 | |
Nationalist | Andrew Davidson | 8,398 | 29.7 | +1.0 | |
Total formal votes | 28,241 | 98.7 | |||
Informal votes | 372 | 1.3 | |||
Turnout | 28,613 | 73.2 | |||
Labor hold | Swing | -1.0 | |||
Party | Candidate | Votes | % | ±% | |
---|---|---|---|---|---|
Nationalist | Donald Cameron | 17,804 | 49.2 | −0.8 | |
Labor | William Finlayson | 17,576 | 48.6 | −1.4 | |
Independent | Sine Boland | 773 | 2.1 | +2.1 | |
Total formal votes | 36,153 | 94.7 | |||
Informal votes | 2,035 | 5.3 | |||
Turnout | 38,188 | 85.5 | |||
Two-party-preferred result | |||||
Nationalist | Donald Cameron | 18,436 | 51.0 | +1.0 | |
Labor | William Finlayson | 17,717 | 49.0 | −1.0 | |
Nationalist gain from Labor | Swing | +1.0 | |||
Party | Candidate | Votes | % | ±% | |
---|---|---|---|---|---|
Labor | William Higgs | 15,134 | 52.8 | +0.5 | |
Nationalist | Alexander Cameron | 13,521 | 47.2 | −0.5 | |
Total formal votes | 28,655 | 98.0 | |||
Informal votes | 577 | 2.0 | |||
Turnout | 29,232 | 87.5 | |||
Labor hold | Swing | +0.5 | |||
Party | Candidate | Votes | % | ±% | |
---|---|---|---|---|---|
Nationalist | Littleton Groom | 17,974 | 57.7 | +1.6 | |
Labor | Phil Alke | 13,180 | 42.3 | -1.6 | |
Total formal votes | 31,154 | 98.2 | |||
Informal votes | 569 | 1.8 | |||
Turnout | 31,723 | 87.1 | |||
Nationalist hold | Swing | +1.6 | |||
Party | Candidate | Votes | % | ±% | |
---|---|---|---|---|---|
Nationalist | Fred Bamford | 17,470 | 51.0 | -0.3 | |
Labor | Eugene McKenna | 15,872 | 46.3 | -2.4 | |
Independent | Henry Madden | 493 | 1.4 | +1.4 | |
Independent | Terence Haren | 443 | 1.3 | +1.3 | |
Total formal votes | 34,278 | 90.5 | |||
Informal votes | 3,583 | 9.5 | |||
Turnout | 37,861 | 87.3 | |||
Two-party-preferred result | |||||
Nationalist | Fred Bamford | 52.4 | +1.1 | ||
Labor | Eugene McKenna | 47.6 | -1.1 | ||
Nationalist hold | Swing | +1.1 | |||
Party | Candidate | Votes | % | ±% | |
---|---|---|---|---|---|
Labor | Charles McDonald | 13,360 | 61.7 | -1.1 | |
Nationalist | James Suter | 8,283 | 38.3 | +1.1 | |
Total formal votes | 21,643 | 96.8 | |||
Informal votes | 704 | 3.2 | |||
Turnout | 22,347 | 76.4 | |||
Labor hold | Swing | -1.1 | |||
Party | Candidate | Votes | % | ±% | |
---|---|---|---|---|---|
Nationalist | George Mackay | 25,473 | 63.3 | +0.6 | |
Labor | Joseph Johnston | 14,762 | 36.7 | -0.6 | |
Total formal votes | 40,235 | 97.8 | |||
Informal votes | 912 | 2.2 | |||
Turnout | 41,147 | 84.3 | |||
Nationalist hold | Swing | +0.6 | |||
Party | Candidate | Votes | % | ±% | |
---|---|---|---|---|---|
Labor | Jim Page | 12,127 | 52.7 | -2.1 | |
Primary Producers | James Hunter | 10,885 | 47.3 | +47.3 | |
Total formal votes | 23,012 | 97.6 | |||
Informal votes | 563 | 2.4 | |||
Turnout | 23,575 | 77.1 | |||
Labor hold | Swing | -2.1 | |||
Party | Candidate | Votes | % | ±% | |
---|---|---|---|---|---|
Nationalist | Arnold Wienholt | 17,834 | 55.2 | +5.1 | |
Labor | William Heffernan | 14,491 | 44.8 | -5.1 | |
Total formal votes | 32,325 | 98.3 | |||
Informal votes | 572 | 1.7 | |||
Turnout | 32,897 | 84.8 | |||
Nationalist hold | Swing | +5.1 | |||
Party | Candidate | Votes | % | ±% | |
---|---|---|---|---|---|
Nationalist | James Bayley | 22,576 | 53.8 | +1.0 | |
Labor | James Sharpe | 19,401 | 46.2 | -1.0 | |
Total formal votes | 41,977 | 98.2 | |||
Informal votes | 791 | 1.8 | |||
Turnout | 42,768 | 87.4 | |||
Nationalist hold | Swing | +1.0 | |||
Party | Candidate | Votes | % | ±% | |
---|---|---|---|---|---|
Nationalist | Edward Corser | 16,272 | 54.3 | +1.4 | |
Labor | Frederick Martyn | 13,685 | 45.7 | -1.4 | |
Total formal votes | 29,957 | 98.2 | |||
Informal votes | 534 | 1.8 | |||
Turnout | 30,491 | 87.2 | |||
Nationalist hold | Swing | +1.4 | |||
Party | Candidate | Votes | % | ±% | |
---|---|---|---|---|---|
Nationalist | Reginald Blundell | 10,523 | 50.8 | +50.8 | |
Labor | George Edwin Yates | 10,184 | 49.2 | −50.8 | |
Total formal votes | 20,707 | 96.3 | |||
Informal votes | 785 | 3.7 | |||
Turnout | 21,492 | 62.3 | |||
Nationalist gain from Labor | Swing | +50.8 | |||
Party | Candidate | Votes | % | ±% | |
---|---|---|---|---|---|
Labor | Moses Gabb | 9,468 | 50.7 | +1.5 | |
Nationalist | Paddy Glynn | 9,217 | 49.3 | −1.5 | |
Total formal votes | 18,685 | 96.8 | |||
Informal votes | 615 | 3.2 | |||
Turnout | 19,300 | 64.5 | |||
Labor gain from Nationalist | Swing | +1.5 | |||
Party | Candidate | Votes | % | ±% | |
---|---|---|---|---|---|
Nationalist | John Livingston | 13,233 | 60.0 | −3.9 | |
Labor | Albert Davies | 7,023 | 31.8 | −4.3 | |
Independent | Alexander Williams | 1,813 | 8.2 | +8.2 | |
Total formal votes | 22,069 | 90.8 | |||
Informal votes | 2,238 | 9.2 | |||
Turnout | 24,307 | 62.3 | |||
Two-party-preferred result | |||||
Nationalist | John Livingston | 64.1 | +0.2 | ||
Labor | Albert Davies | 35.9 | −0.2 | ||
Nationalist hold | Swing | +0.2 | |||
Party | Candidate | Votes | % | ±% | |
---|---|---|---|---|---|
Nationalist | William Story | 18,501 | 63.5 | −1.0 | |
Labor | Stanley Whitford | 8,872 | 30.4 | −5.1 | |
Independent | George Illingworth | 1,779 | 6.1 | +6.1 | |
Total formal votes | 29,152 | 92.6 | |||
Informal votes | 2,341 | 7.4 | |||
Turnout | 31,493 | 67.3 | |||
Two-party-preferred result | |||||
Nationalist | William Story | 66.6 | +2.1 | ||
Labor | Stanley Whitford | 33.4 | −2.1 | ||
Nationalist hold | Swing | +2.1 | |||
Party | Candidate | Votes | % | ±% | |
---|---|---|---|---|---|
Nationalist | Alexander Poynton | 11,642 | 51.8 | -5.9 | |
Labor | Charles Gray | 10,843 | 48.2 | +5.9 | |
Total formal votes | 22,485 | 97.3 | |||
Informal votes | 616 | 2.7 | |||
Turnout | 23,101 | 68.3 | |||
Nationalist hold | Swing | -5.9 | |||
Party | Candidate | Votes | % | ±% | |
---|---|---|---|---|---|
Labor | Norman Makin | 17,195 | 51.4 | +7.2 | |
Nationalist | William Archibald | 16,279 | 48.6 | -7.2 | |
Total formal votes | 33,474 | 97.4 | |||
Informal votes | 906 | 2.6 | |||
Turnout | 34,380 | 69.1 | |||
Labor gain from Nationalist | Swing | +7.2 | |||
Party | Candidate | Votes | % | ±% | |
---|---|---|---|---|---|
Nationalist | Richard Foster | 10,872 | 49.7 | -6.5 | |
Labor | Edward Stokes | 8,067 | 36.9 | -6.9 | |
Farmers and Settlers | Herbert Tuck | 2,946 | 13.5 | +13.5 | |
Total formal votes | 21,885 | 91.1 | |||
Informal votes | 2,133 | 8.9 | |||
Turnout | 24,018 | 69.8 | |||
Two-party-preferred result | |||||
Nationalist | Richard Foster | 12,780 | 58.4 | +2.2 | |
Labor | Edward Stokes | 9,105 | 41.6 | -2.2 | |
Nationalist hold | Swing | +2.2 | |||
Party | Candidate | Votes | % | ±% | |
---|---|---|---|---|---|
Nationalist | Henry Gregory | 10,440 | 64.6 | −6.8 | |
Labor | Thomas Lowry | 5,720 | 35.4 | +6.8 | |
Total formal votes | 16,160 | 97.6 | |||
Informal votes | 405 | 2.4 | |||
Turnout | 16,565 | 55.9 | |||
Nationalist hold | Swing | −6.8 | |||
Party | Candidate | Votes | % | ±% | |
---|---|---|---|---|---|
Nationalist | Reginald Burchell | 15,988 | 60.8 | -8.1 | |
Labor | Andrew Clementson | 10,294 | 39.2 | +8.1 | |
Total formal votes | 26,282 | 97.6 | |||
Informal votes | 660 | 2.4 | |||
Turnout | 26,942 | 62.0 | |||
Nationalist hold | Swing | -8.1 | |||
Party | Candidate | Votes | % | ±% | |
---|---|---|---|---|---|
Labor | Hugh Mahon | 9,220 | 52.1 | +3.4 | |
Nationalist | Edward Heitmann | 8,480 | 47.9 | -3.4 | |
Total formal votes | 17,700 | 98.7 | |||
Informal votes | 237 | 1.3 | |||
Turnout | 17,937 | 79.3 | |||
Labor gain from Nationalist | Swing | +3.4 | |||
Party | Candidate | Votes | % | ±% | |
---|---|---|---|---|---|
Nationalist | James Fowler | 7,721 | 38.4 | -7.7 | |
Labor | John Curtin | 6,877 | 34.2 | +3.7 | |
Nationalist | Lionel Carter | 4,699 | 23.4 | +23.4 | |
Ind. Free Trade | Gerald Hartrey | 811 | 4.0 | +4.0 | |
Total formal votes | 20,108 | 93.4 | |||
Informal votes | 1,419 | 6.6 | |||
Turnout | 21,527 | 58.4 | |||
Two-party-preferred result | |||||
Nationalist | James Fowler | 12,275 | 61.0 | -8.5 | |
Labor | John Curtin | 7,833 | 39.0 | +8.5 | |
Nationalist hold | Swing | -8.5 | |||
Party | Candidate | Votes | % | ±% | |
---|---|---|---|---|---|
Labor | Edwin Corboy | 7,444 | 39.1 | +39.1 | |
Farmers and Settlers | John Prowse | 7,313 | 38.5 | +38.5 | |
Nationalist | William Hedges | 4,260 | 22.4 | -77.6 | |
Total formal votes | 19,017 | 93.9 | |||
Informal votes | 1,246 | 6.1 | |||
Turnout | 20,263 | 65.4 | |||
Two-party-preferred result | |||||
Farmers and Settlers | John Prowse | 11,039 | 58.0 | +58.0 | |
Labor | Edwin Corboy | 7,978 | 42.0 | +42.0 | |
Farmers and Settlers gain from Labor | Swing | +58.0 | |||
Party | Candidate | Votes | % | ±% | |
---|---|---|---|---|---|
Labor | Alfred Higgins | 4,292 | 35.3 | −4.8 | |
Nationalist | Syd Jackson | 3,127 | 25.7 | −13.2 | |
Nationalist | Stephen Margetts | 2,553 | 21.0 | +21.0 | |
Ind. Nationalist | Jens Jensen | 1,689 | 13.9 | +13.9 | |
Independent | Timothy Earley | 328 | 2.7 | +2.7 | |
Independent | Luke Bryant | 167 | 1.4 | +1.4 | |
Total formal votes | 12,156 | 91.3 | |||
Informal votes | 1,155 | 8.7 | |||
Turnout | 13,311 | 53.7 | |||
Two-party-preferred result | |||||
Nationalist | Syd Jackson | 6,779 | 55.8 | −4.1 | |
Labor | Alfred Higgins | 5,377 | 44.2 | +4.1 | |
Nationalist hold | Swing | −4.1 | |||
Party | Candidate | Votes | % | ±% | |
---|---|---|---|---|---|
Nationalist | George Bell | 6,630 | 54.0 | -4.8 | |
Labor | Joseph Lyons | 5,645 | 46.0 | +4.8 | |
Total formal votes | 12,275 | 97.8 | |||
Informal votes | 274 | 2.2 | |||
Turnout | 12,549 | 67.2 | |||
Nationalist hold | Swing | -4.8 | |||
Party | Candidate | Votes | % | ±% | |
---|---|---|---|---|---|
Nationalist | William Laird Smith | 9,505 | 53.9 | -2.4 | |
Labor | King O'Malley | 8,141 | 46.1 | +2.4 | |
Total formal votes | 17,646 | 98.3 | |||
Informal votes | 298 | 1.7 | |||
Turnout | 17,944 | 66.6 | |||
Nationalist hold | Swing | -2.4 | |||
Party | Candidate | Votes | % | ±% | |
---|---|---|---|---|---|
Nationalist | William McWilliams | 7,291 | 62.1 | -37.9 | |
Nationalist | Louis Shoobridge | 4,451 | 37.9 | +37.9 | |
Total formal votes | 11,742 | 93.1 | |||
Informal votes | 866 | 6.9 | |||
Turnout | 12,608 | 53.1 | |||
Nationalist hold | Swing | -37.9 | |||
Party | Candidate | Votes | % | ±% | |
---|---|---|---|---|---|
Nationalist | Llewellyn Atkinson | 4,015 | 46.7 | +12.8 | |
Nationalist | Henry McFie | 2,368 | 27.6 | +27.6 | |
Country | Norman Cameron | 2,210 | 25.7 | +25.7 | |
Total formal votes | 8,593 | 93.4 | |||
Informal votes | 711 | 7.6 | |||
Turnout | 9,304 | 52.0 | |||
Two-party-preferred result | |||||
Nationalist | Llewellyn Atkinson | 5,169 | 60.2 | +4.0 | |
Nationalist | Henry McFie | 3,424 | 39.8 | +39.8 | |
Nationalist hold | Swing | +4.0 | |||
`
The Division of Ballarat is an Australian electoral division in the state of Victoria. The division was proclaimed in 1900, and was one of the original 65 divisions to be contested at the first federal election. It was named for the provincial city of the same name by Scottish squatter Archibald Yuille, who established the first settlement − his sheep run called Ballaarat − in 1837, with the name derived from a local Wathawurrung word for the area, balla arat, thought to mean "resting place".
The 1919 Australian referendum was held on 13 December 1919. It contained two referendum questions. The referendums were held in conjunction with the 1919 federal election.
The Douglas Credit Party was an Australian political party based on the Social Credit theory of monetary reform, first set out by Clifford Douglas. It gained its strongest result in Queensland in 1935, when it gained 7.02% of first preferences under the leadership of the psychiatrist Dr Julius Streeter. Streeter had returned to Australia in 1919 as a war hero after being a surgeon in the Battle of Ypres where he was injured by mustard gas.
The Division of Page is an Australian electoral division in the state of New South Wales.
The Progressive Party was an Australian political party, active in New South Wales state politics. The question of tariff policy which, had created and divided the Free Trade Party and Protectionist Party in New South Wales in the 1890s, became a federal issue at the time of federation. Deprived of their main ideological difference, the two parties were recreated as the Liberal Reform Party aligned with the federal Free Trade Party and the Progressive Party aligned with the federal Protectionist Party.
The 1949 Australian federal elections was held on Saturday December 10, All 121 seats in the House of Representatives and 42 of the 60 seats in the Senate were up for election. The incumbent Labor Party, led by Prime Minister Ben Chifley, was defeated by the opposition Liberal–Country coalition under Robert Menzies in a landslide. Menzies became prime minister for a second time, his first period having ended in 1941. This election marked the end of the 8-year Curtin-Chifley Labor government that had been in power since 1941 and started the 23-year Liberal/Country Coalition government. This was the first time the Liberal party won government at the federal level.
The 1934 Australian federal election was held in Australia on 15 September 1934. All 74 seats in the House of Representatives, and 18 of the 36 seats in the Senate were up for election. The incumbent United Australia Party led by Prime Minister of Australia Joseph Lyons formed a minority government, with 33 out of 74 seats in the House.
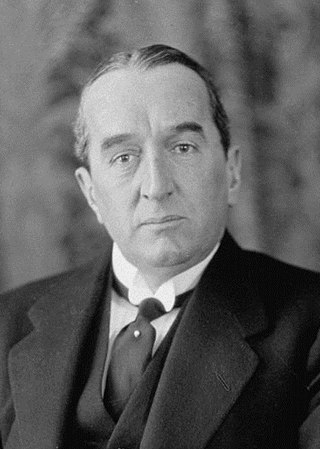
The 1928 Australian federal election was held in Australia on 17 November 1928. All 75 seats in the House of Representatives and 19 of the 36 seats in the Senate were up for election. The incumbent Nationalist–Country coalition, led by Prime Minister Stanley Bruce won a record fifth consecutive election defeating the opposition Labor Party led by James Scullin.
The 1925 Australian federal election was held in Australia on 14 November 1925. All 75 seats in the House of Representatives and 22 of the 36 seats in the Senate were up for election. The incumbent Nationalist–Country coalition, led by Prime Minister Stanley Bruce, defeated the opposition Labor Party led by Matthew Charlton in a landslide. This was the first time any party had won a fourth consecutive federal election.
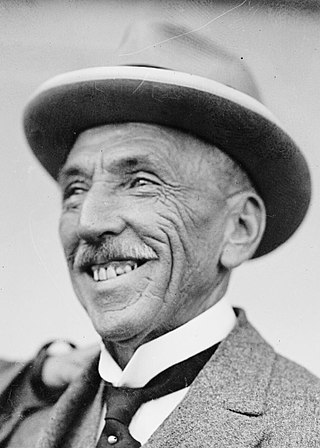
The 1919 Australian federal election was held on 13 December 1919 to elect members to the Parliament of Australia. All 75 seats in the House of Representatives and 19 of the 36 seats in the Senate were up for election. The incumbent Nationalist Party government won re-election, with Prime Minister Billy Hughes continuing in office.
The 1917 Australian federal election was held in Australia on 5 May 1917. All 75 seats in the House of Representatives and 18 of the 36 seats in the Senate were up for election. The incumbent Nationalist Party, led by Prime Minister Billy Hughes, defeated the opposition Labor Party led by Frank Tudor in a landslide.
This is a list of members of the Western Australian Legislative Assembly between the 1917 election and the 1921 election, together known as the 10th Parliament.
The Industrial Socialist Labor Party, Industrial Labor Party and the Independent Labor Party were short lived socialist political parties in Australia in 1919 and the early 1920s. The Industrial Socialist Labor Party was founded by radical socialist members of the industrial wing of the Australian Labor Party (ALP), at a time when the ALP's socialist ideology was a matter of intra-party dispute. It was closely aligned with the Industrial Workers of the World (IWW) and the One Big Union (OBE) movement.
This is a list of electoral results for the Division of Corangamite in Australian federal elections from the division's creation in 1901 until the present.
This is a list of electoral results for the Division of Flinders in Australian federal elections from the division's creation in 1901 until the present.
This is a list of members of the 21st Legislative Assembly of Queensland from 1918 to 1920, as elected at the 1918 state election held on 16 March 1918.
This is a list of electoral results for the Division of Kalgoorlie in Australian federal elections from the division's creation in 1901 until its abolition in 2010.
This is a list of electoral division results for the Australian 1917 federal election.