Results of the 1998 Australian federal election (House of Representatives)

Last updated

1998 Australian federal election
Flag of Australia (converted).svg
  1996 3 October 1998 (1998-10-03) [lower-alpha 1] 2001  

All 148 seats in the House of Representatives
75 seats were needed for a majority in the House
40 (of the 76) seats in the Senate
 First partySecond partyThird party
  John howard.jpg Kim Beazley crop.jpg Pauline Hanson (438351804) (cropped).jpg
Leader John Howard Kim Beazley Pauline Hanson
Party Liberal/National coalition Labor One Nation
Leader since 30 January 1995 (1995-01-30) 19 March 1996 (1996-03-19)
Leader's seat Bennelong (NSW) Brand (WA) Oxley (QLD)
Last election94 seats49 seats 1 seat
Seats won80670
Seat changeDecrease2.svg 14Increase2.svg 18Decrease2.svg 1
First preference  vote4,388,8094,454,306936,621
Percentage39.51%40.10%8.43%
SwingDecrease2.svg 7.73%Increase2.svg 1.34%Increase2.svg 8.43%
TPP 49.02%50.98%
TPP swingDecrease2.svg 4.61Increase2.svg 4.61

Prime Minister before election

John Howard
Liberal/National coalition

Subsequent Prime Minister

John Howard
Liberal/National coalition

The following tables show results for the Australian House of Representatives at the 1998 federal election held on 3 October 1998. [1] [2]

Contents

Australia

House of Reps (IRV) – 1998–2001 – Turnout 94.99% (CV) — Informal 3.78% [2]
1998 Australian House.svg
PartyVotes%SwingSeatsChange
  Labor 4,454,30640.10+1.3467Increase2.svg 18
   Liberal 3,764,70733.894.8064Decrease2.svg 11
  National 588,0885.292.9116Decrease2.svg 3
  Country Liberal 36,0140.320.030Decrease2.svg 1
Liberal/National Coalition 4,388,80939.51-7.7480Decrease2.svg 14
  One Nation 936,6218.43*
  Democrats 569,8755.131.63
  Greens [lower-alpha 2] 290,7092.620.30
  Independents [lower-alpha 3] 195,1801.760.511Decrease2.svg 4
Total11,109,063  148 
Two-party-preferred vote
  Liberal/National coalition 5,413,43149.024.6180Decrease2.svg 14
  Labor 5,630,40950.98+4.6167Increase2.svg 18
Invalid/blank votes436,1383.78
Turnout11,545,20195.0
Registered voters12,154,050
Source: Federal Elections 1998

States

New South Wales

1998 Australian federal election
(New South Wales)
Flag of New South Wales.svg
  1996 3 October 1998 2001  

All 50 New South Wales seats in the Australian House of Representatives
and 6 seats in the Australian Senate
 First partySecond party
  Kim Beazley crop.jpg John howard.jpg
Leader Kim Beazley John Howard
Party Labor Liberal/National coalition
Last election20 seats29
Seats won22 seats27 seats
Seat changeIncrease2.svg 2Decrease2.svg 2
Popular vote1,489,0211,424,671
Percentage40.1%38.4%
SwingIncrease2.svg 0.5Decrease2.svg 7.5
TPP 51.54%48.46%
TPP swingIncrease2.svg 4.11Decrease2.svg 4.11
Turnout 96.4% (CV) — Informal 3.6% [2]
PartyVotes%SwingSeatsChange
   Liberal 1,131,54530.49−2.9718Decrease2.svg 1
  National 293,1267.90−4.179Decrease2.svg 1
Liberal/National Coalition 1,424,67138.39−7.1427Decrease2.svg 2
  Labor 1,489,02140.12+0.5622Increase2.svg 2
  One Nation 332,5108.96+8.96
  Democrats 154,4964.16−2.38
  Greens 98,6472.66+0.14
  Independents 96,7192.61+0.201Steady2.svg
  Unity 57,6661.55+1.55
  Christian Democrats 38,0231.02+0.10
  No Aircraft Noise 5,2980.141Steady2.svg
  Democratic Socialist 3,2960.091.37
  Natural Law 3,0650.080.31
  Citizens Electoral Council 2,3320.06
  Progressive Labour 1,1310.03
  Australia First 1,0240.03
  Abolish Child Support 5440.01
  Socialist Equality 5310.01
  No GST 2400.01
  Republican 2270.01
Total3,711,14450
Two-party-preferred vote
  Liberal/National Coalition 1,766,64048.46−4.1127Decrease2.svg 2
  Labor 1,879,28151.54+4.1122Increase2.svg 2
Invalid/blank votes217,0245.4
Turnout3,866,08394.8
Registered voters4,076,081
Source: Federal Elections 1998

Victoria

1998 Australian federal election
(Victoria)
Flag of Victoria (Australia).svg
  1996 3 October 1998 2001  

All 37 Victorian seats in the Australian House of Representatives
and 6 seats in the Australian Senate
 First partySecond party
  Kim Beazley crop.jpg John howard.jpg
Leader Kim Beazley John Howard
Party Labor Liberal/National coalition
Last election1621 seats
Seats won19 seats18 seats
Seat changeIncrease2.svg 3Decrease2.svg 3
Popular vote1,261,2891,131,375
Percentage44.4%39.8%
SwingIncrease2.svg 1.5Decrease2.svg 4.8
TPP 53.53%46.47%
TPP swingIncrease2.svg 3.22Decrease2.svg 3.22
Turnout 95.6% (CV) — Informal 3.5% [2]
PartyVotes%SwingSeatsChange
   Liberal 1,053,99037.08-2.8216Decrease2.svg 3
  National 77,3852.72-1.902Steady2.svg
Liberal/National Coalition 1,131,37539.80-4.7218Decrease2.svg 3
  Labor 1,261,28944.371.4519Increase2.svg 3
  Democrats 171,0916.02-1.33
  One Nation 105,7983.723.72
  Greens 59,3832.090.19
  Independent 38,2321.34-0.29
  Unity 29,2651.031.03
  Shooters 12,6750.450.45
  Natural Law 9,6540.340.00
  Australia First 6,4550.230.00
  Progressive Labour 4,9910.180.00
  Reform 4,2200.150.00
  Christian Democrats 3,7930.130.00
  Citizens Electoral Council 2,9140.100.00
  Abolish Child Support 9450.030.00
  Democratic Socialist 4250.010.00
  Republican 1760.010.00
Total2,842,68137
Two-party-preferred vote
  Labor 1,521,56053.533.2219Increase2.svg 3
  Liberal/National Coalition 1,321,12146.47-3.2218Decrease2.svg 3
Invalid/blank votes103,5243.5
Turnout2,946,20595.6
Registered voters3,081,632
Source: Federal Elections 1998

Queensland

1998 Australian federal election
(Queensland)
Flag of Queensland.svg
  1996 3 October 1998 2001  

All 27 Queensland seats in the Australian House of Representatives
and 6 seats in the Australian Senate
 First partySecond party
  John howard.jpg Kim Beazley crop.jpg
Leader John Howard Kim Beazley
Party Liberal/National coalition Labor
Last election232 seats
Seats won19 seats8 seats
Seat changeDecrease2.svg 4Increase2.svg 6
Popular vote814,338719,743
Percentage40.9%36.1%
SwingDecrease2.svg 14.1Increase2.svg 2.9
TPP 53.05%46.95%
TPP swingDecrease2.svg 7.17Increase2.svg 7.17
Turnout 94.2% (CV) — Informal 3.2% [2]
PartyVotes %SwingSeatsChange
   Liberal 615,15330.86-8.4414Decrease2.svg 3
  National 199,1859.99-5.915Decrease2.svg 1
Liberal/National Coalition 814,33840.85-14.3519Decrease2.svg 4
  Labor 719,74336.112.918Increase2.svg 6
  One Nation 285,98314.3514.35
  Democrats 80,0034.01-2.69
  Greens 47,4402.38-2.42
  Independents [lower-alpha 3] 29,3881.471.47Decrease2.svg 1
  Christian Democrats 11,2430.560.56
  Citizens Electoral Council 1,5060.080.08
  Women's Party 1,4260.070.00
  Family Law Reform 1,1990.060.00
  Democratic Socialist 7780.040.00
  Abolish Child Support 1700.010.00
  Australia First 1580.010.00
Total1,993,37527Increase2.svg 1
Two-party-preferred vote
  Labor 935,86746.957.178Increase2.svg 6
  Liberal/National Coalition 1,057,50853.05-7.1719Decrease2.svg 4
Invalid/blank votes68,6593.2
Turnout2,062,03494.2
Registered voters2,188,024
Source: Federal Elections 1998

Western Australia

1998 Australian federal election
(Western Australia)
Flag of Western Australia.svg
  1996 3 October 1998 2001  

All 14 Western Australian seats in the Australian House of Representatives
and 6 seats in the Australian Senate
 First partySecond party
  John howard.jpg Kim Beazley crop.jpg
Leader John Howard Kim Beazley
Party Liberal/National coalition Labor
Last election83 seats
Seats won7 seats7 seats
Seat changeDecrease2.svg 1Increase2.svg 4
Popular vote411,432377,545
Percentage39.5%36.2%
SwingDecrease2.svg 5.9Increase2.svg 1.5
TPP 50.54%49.46%
TPP swingDecrease2.svg 5.46Increase2.svg 5.46
Turnout 94.7% (CV) — Informal 4.2% [2]
PartyVotes %SwingSeatsChange
   Liberal 397,83638.15-5.877Decrease2.svg 1
  National 13,5961.30-0.03Steady2.svg
Liberal/National Coalition 411,43239.46-5.907Decrease2.svg 1
  Labor 377,54536.211.487Increase2.svg 4
  One Nation 96,7089.279.27
  Greens 52,6745.05-0.26
  Australian Democrats 41,3643.97-1.61
  Independents 31,9803.07-5.71Decrease2.svg 3
  Australia First 18,8281.811.81
  Christian Democrats 8,3360.800.80
  Citizens Electoral Council 1,5410.150.15
  Natural Law 9510.09-0.16
  Democratic Socialist 6820.070.07
  Abolish Child Support 4130.040.04
  Unity 3210.030.03
Total1,042,77514
Two-party-preferred vote
  Liberal/National Coalition 527,04250.54-5.467Decrease2.svg 1
  Labor 515,73349.465.467Increase2.svg 4
Invalid/blank votes45,5094.18+1.02
Turnout1,088,28494.66
Registered voters1,149,619
Source: Federal Elections 1998

South Australia

1998 Australian federal election
(South Australia)
Flag of South Australia.svg
  1996 3 October 1998 2001  

All 37 South Australian seats in the Australian House of Representatives
and 6 seats in the Australian Senate
 First partySecond party
  John howard.jpg Kim Beazley crop.jpg
Leader John Howard Kim Beazley
Party Liberal/National coalition Labor
Last election102 seats
Seats won9 seats3 seats
Seat changeDecrease2.svg 1Increase2.svg 1
Popular vote394,178319,267
Percentage42.6%34.5%
SwingDecrease2.svg 7.4Decrease2.svg 0.4
TPP 53.11%46.89%
TPP swingDecrease2.svg 4.15Increase2.svg 4.15
Turnout 95.6% (CV) — Informal 3.5% [2]
PartyVotes%SwingSeatsChange
   Liberal 389,38242.05-7.949Decrease2.svg 1
  National 4,7960.520.52Steady2.svg
Liberal/National Coalition 394,17842.57-7.429Decrease2.svg 1
  Labor 319,26734.48-0.353Increase2.svg 1
  Democrats 93,90510.14-0.06
  One Nation 90,7739.800.00
  Independent 13,3271.440.39
  Greens 4,5760.49-2.46
  Natural Law 3,5260.38-0.11
  Christian Democrats 3,5210.380.00
  Australia First 1,6040.170.00
  Communist 8010.090.00
  Independent EFF 5130.060.00
Total925,99112
Two-party-preferred vote
  Liberal/National Coalition 491,80253.11-4.159Decrease2.svg 1
  Labor 434,18946.894.153Increase2.svg 1
Invalid/blank votes44,0744.540.46
Turnout970,06596.91
Registered voters1,001,006
Source: Federal Elections 1998

Tasmania

1998 Australian federal election
(Tasmania)
Flag of Tasmania.svg
  1996 3 October 1998 2001  

All 5 Tasmanian seats in the Australian House of Representatives
and 6 seats in the Australian Senate
 First partySecond party
  Kim Beazley crop.jpg John howard.jpg
Leader Kim Beazley John Howard
Party Labor Liberal/National coalition
Last election32 seats
Seats won5 seats0 seats
Seat changeIncrease2.svg 2Decrease2.svg 2
Popular vote150,384117,377
Percentage48.9%38.2%
SwingIncrease2.svg 4.6Decrease2.svg 6.3
TPP 57.32%42.68%
TPP swingIncrease2.svg 5.74Decrease2.svg 5.74
Turnout 95.6% (CV) — Informal 3.5% [2]
PartyVotes%SwingSeatsChange
  Labor 150,38448.914.605Increase2.svg 2
  Liberal 117,37738.17-6.29Decrease2.svg 2
  Greens 17,0915.56-0.78
  Democrats 10,0243.26-0.83
  One Nation 7,5532.460.00
  Tasmania First 4,5511.480.00
Total307,4775
Two-party-preferred vote
  Labor 176,24157.325.745Increase2.svg 2
  Liberal 131,23642.68-5.740Decrease2.svg 2
Invalid/blank votes9,8193.090.74
Turnout317,29696.12
Registered voters330,121
Source: Federal Elections 1998

|abc

Territories

Australian Capital Territory

1998 Australian federal election
(Australian Capital Territory)
Flag of the Australian Capital Territory.svg
  1996 3 October 1998 2001  

Both Australian Capital Territory seats in the Australian House of Representatives
and both seats in the Australian Senate
 First partySecond party
  Kim Beazley crop.jpg John howard.jpg
Leader Kim Beazley John Howard
Party Labor Coalition
Last election3 seats0 seats
Seats won2 seats0 seats
Seat changeDecrease2.svg 1Steady2.svg
Popular vote98,58859,424
Percentage50.64%30.52%
SwingIncrease2.svg 2.73Decrease2.svg 10.40
TPP 62.4%37.6%
TPP swingIncrease2.svg 7.0Decrease2.svg 7.0

Turnout 95.7% (CV) — Informal 2.9% [2]
PartyVotes%SwingSeatsChange
  Labor 98,58850.64+2.732Decrease2.svg 1
  Liberal 59,42430.52–10.40Steady2.svg
  Democrats 14,3947.39
  One Nation 9,8955.08
  Greens 8,1454.18–4.52
  Democratic Socialist 2,6411.36
  Natural Law 5390.28–0.13
  Independents 1,0570.54–1.52
Total194,6832Decrease2.svg 1
Two-party-preferred vote
  Labor 121,55262.4+7.02Decrease2.svg 1
  Liberal 73,13137.6–7.00Steady2.svg
Invalid/blank votes5,7432.87+0.05
Turnout200,42695.65
Registered voters209,536
Source: Federal Elections 1998

Northern Territory

1998 Australian federal election
(Northern Territory)
Flag of the Northern Territory.svg
  1996 3 October 1998 2001  

The one Northern Territory seat in the Australian House of Representatives
and both seats in the Australian Senate
 First partySecond party
  Kim Beazley crop.jpg John howard.jpg
Leader Kim Beazley John Howard
Party Labor Coalition
Last election0 seats1 seats
Seats won1 seats0 seats
Seat changeIncrease2.svg 1Decrease2.svg 1
Popular vote38,46936,014
Percentage42.30%39.60%
SwingDecrease2.svg 1.20Decrease2.svg 5.44
TPP 50.6%49.4%
TPP swingIncrease2.svg 0.9Decrease2.svg 0.9
1998 Australian federal election: Northern Territory [3]
PartyCandidateVotes%±%
Labor Warren Snowdon 38,46942.30-1.20
Country Liberal Nick Dondas 36,01439.60-5.44
One Nation Peter Schirmer7,4018.14+8.14
Democrats Craig Seiler4,6585.12+5.12
Greens Ilana Eldridge2,7533.03-3.23
Independent Barry Nattrass1,0181.12+1.12
Democratic Socialist Natalie Zirngast6240.69+0.69
Total formal votes90,93795.84-0.77
Informal votes3,9514.16+0.77
Turnout 94,88890.33+1.23
Two-party-preferred result
Labor Warren Snowdon 45,98650.57+0.94
Country Liberal Nick Dondas 44,95149.43-0.94
Labor gain from Country Liberal Swing +0.94

See also

Notes

  1. The election in the seat of Newcastle was deferred to 21 November 1998.
  2. Australian Greens includes Greens Western Australia.
  3. 1 2 Pauline Hanson has been counted as an independent for the 1996 election. She had been disendorsed as the Liberal candidate and ran as an independent, but she remained a Liberal on the ballot paper.
  4. Christian Democrats includes CTA Child Protection Party.

Related Research Articles

<span class="mw-page-title-main">1998 Australian federal election</span> Election for the 39th Parliament of Australia

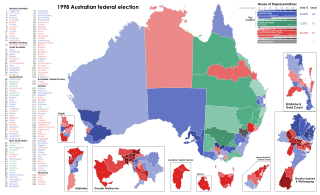
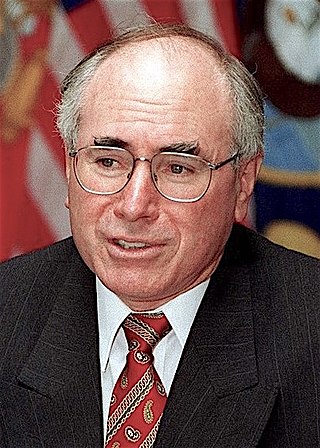
The 1998 Australian federal election was held to determine the members of the 39th Parliament of Australia. It was held on 3 October 1998. All 148 seats of the House of Representatives and 40 seats of the 76-seat Senate were up for election. The incumbent centre-right Liberal/National Coalition government led by Prime Minister John Howard of the Liberal Party and coalition partner Tim Fischer of the National Party defeated the centre-left Australian Labor Party opposition led by Opposition Leader Kim Beazley, despite losing the nationwide popular and two-party preferred vote.

This is a list of electoral results for the Division of Bennelong in Australian federal elections from the electorate's creation in 1949 until the present.

This is a list of electoral results for the Division of Bradfield in Australian federal elections from the electorate's creation in 1949 until the present.

This is a list of electoral results for the Division of Calare in Australian federal elections from the division's creation in 1906 until the present.

This is a list of electoral results for the Division of Cunningham in Australian federal elections from the division's creation in 1949 until the present.

This is a list of electoral results for the Division of North Sydney in Australian federal elections from the electorate's creation in 1901 until the present.

This is a list of electoral results for the Division of McMillan in Australian federal elections from the division's creation in 1949 until its abolition in 2019.

This is a list of electoral results for the Division of Canberra in Australian federal elections from the division's creation in 1974 until the present.

The following tables show state-by-state results in the Australian House of Representatives at the 2010 federal election, Labor 72, Coalition 72, Nationals (WA) 1, Australian Greens 1, with 4 independents.

<span class="mw-page-title-main">1996 Australian Senate election</span> Australian federal election results

The following tables show state-by-state results in the Australian Senate at the 1996 federal election. Senators total 35 coalition, 29 Labor, two Green, two non-coalition National, seven Democrats, and one Independent. Senator terms are six years, and took their seats from 1 July 1996, except the territories who took their seats immediately.

<span class="mw-page-title-main">1987 Australian Senate election</span> Australian federal election results

The following tables show state-by-state results in the Australian Senate at the 1987 federal election. This election was a Double dissolution, which means that all 12 senators from each state were up for election. Senators total 29 coalition, 32 Labor, one Jo Vallentine Peace Group, four non-coalition National, seven Democrats, one Nuclear Disarmament and one Independent. Territory Senators served until the next federal election. State Senator terms were nominally three or six years, backdated from 1 July 1987. The Senate used the order-elected method to allocate three- and six-year seats, despite provisions for the AEC to conduct a special recount.

<span class="mw-page-title-main">Results of the 1998 Australian federal election in Queensland</span> Results of the 1998 Australian Election in Queensland

This is a list of electoral division results for the 1998 Australian federal election in the state of Queensland.

<span class="mw-page-title-main">Results of the 1990 Australian federal election in Victoria</span>

This is a list of electoral division results for the Australian 1990 federal election in the state of Victoria.

<span class="mw-page-title-main">Results of the 1996 Australian federal election in Queensland</span>

This is a list of electoral division results for the Australian 1996 federal election in the state of Queensland.

<span class="mw-page-title-main">Results of the 1998 Australian federal election in South Australia</span> This page intentionally has no description.

This is a list of electoral division results for the Australian 1998 federal election in the state of South Australia.

This is a list of electoral division results for the Australian 1996 federal election for the Australian Capital Territory  and the Northern Territory.

This is a list of electoral division results for the Australian 1998 federal election for the Australian Capital Territory  and the Northern Territory.

<span class="mw-page-title-main">Results of the 1996 Australian federal election (House of Representatives)</span>

The following tables show results for the Australian House of Representatives at the 1996 federal election held on 2 March 1996.

<span class="mw-page-title-main">Results of the 1993 Australian federal election (House of Representatives)</span>

The following tables show results for the Australian House of Representatives at the 1993 federal election held on 13 March 1993.

<span class="mw-page-title-main">Results of the 1990 Australian federal election (House of Representatives)</span>

The following tables show results for the Australian House of Representatives at the 1990 federal election held on 24 March 1990.

References

  1. Bennett, S; Newman, G; Kopras, A (16 February 1999). "Federal Elections 1998" (PDF). Research Paper 9 1998-99. Parliamentary Research Service. ISSN   1328-7478 . Retrieved 20 June 2022.
  2. 1 2 3 4 5 6 7 8 9 "1998 House of Representatives". Psephos Adam Carr's Election Archive. Retrieved 10 June 2022.
  3. "1998 House of Representatives: Northern Territory". Psephos Adam Carr's Election Archive. Retrieved 22 June 2022.