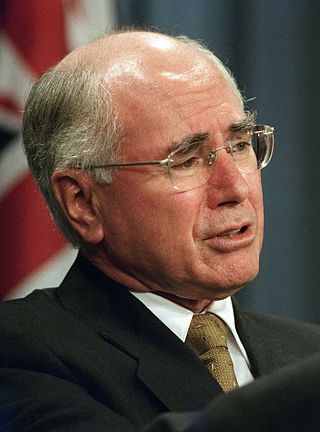
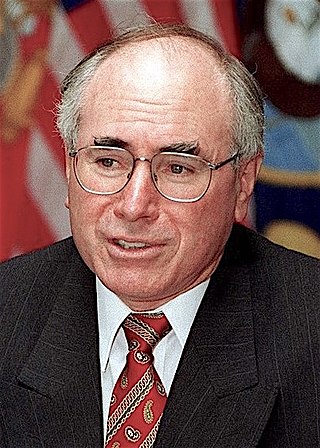
Results of the 2001 Australian federal election in New South Wales

Last updated

2001 Australian federal election
(New South Wales)
Flag of New South Wales.svg
  1998 10 November 2001 2004  

All 50 New South Wales seats in the Australian House of Representatives
and 6 seats in the Australian Senate
 First partySecond party
  Howard John BANNER.jpg Kim Beazley crop.jpg
Leader John Howard Kim Beazley
Party Liberal/National coalition Labor
Last election27 seats22 seats
Seats won28 seats20 seats
Seat changeIncrease2.svg 1Decrease2.svg 2
Popular vote1,621,5801,380,822
Percentage42.80%36.45%
SwingIncrease2.svg 4.41Decrease2.svg 3.67
TPP 52.14%47.86%
TPP swingIncrease2.svg 3.68Decrease2.svg 3.68

This is a list of electoral division results for the Australian 2001 federal election in the state of New South Wales. [1] [2] [3] [4]

Contents

Overall results

Turnout 99.60% (CV) — Informal 3.40% [1]
PartyVotes%SwingSeatsChange
   Liberal 1,272,20833.583.0921Increase2.svg 3
  National 349,3729.221.327Decrease2.svg 2
Liberal/National Coalition 1,621,58042.804.4128Increase2.svg 1
  Labor 1,380,82236.45–3.6720Decrease2.svg 2
  One Nation 180,8124.77–4.19
  Greens 180,0794.752.09
  Democrats 160,7064.240.08
  Independent 148,0423.913.022Increase2.svg 1
  Christian Democrats 46,0591.220.19
  Unity 24,6530.65–0.90
  Against Further Immigration 12,0330.32
  Save the ADI Site 6,0290.16
  Citizens Electoral Council 5,7460.15
  No GST 4,8580.13
  Progressive Labour 4,4670.12
  Lower Excise Fuel 3,0980.08
  HEMP 2,1930.06
  Non-Custodial Parents 0,7690.02
  Fishing Party 0,7200.02
Total3,788,45950
Two-party-preferred vote
  Liberal/National Coalition 1,811,01952.14+3.6828Increase2.svg 1
  Labor 1,662,19048.46–3.6820Decrease2.svg 2
Invalid/blank votes217,0245.42+1.41
Turnout4,005,48395.27
Registered voters4,204,383
Source: AEC Tally Room

Results by division

Banks

This section is an excerpt from Electoral results for the Division of Banks § 2001
2001 Australian federal election: Banks [3]
PartyCandidateVotes%±%
Labor Daryl Melham 32,59244.25−0.34
Liberal Marcus Watzlaff26,35835.79+1.79
One Nation Lynn Abrahams4,6496.31−4.46
Against Further Immigration Ken O'Leary2,5223.42+3.42
Democrats Stephen Cole2,3503.19−1.06
Greens David Wilcox2,0662.81+1.32
Christian Democrats Sam Baissari1,9682.67+0.72
Unity Lynne Murphy7310.99−2.15
Independent Nazim Hannoun4180.57+0.57
Total formal votes73,65493.18−2.89
Informal votes5,3936.82+2.89
Turnout 79,04795.48
Two-party-preferred result
Labor Daryl Melham 38,95252.88−4.37
Liberal Marcus Watzlaff34,70247.12+4.37
Labor hold Swing −4.37

Barton

This section is an excerpt from Electoral results for the Division of Barton § 2001
2001 Australian federal election: Barton
PartyCandidateVotes%±%
Labor Robert McClelland 35,87147.99−1.71
Liberal Jan Brennan28,19837.73+2.76
Democrats Michele Adair3,3284.45+1.74
One Nation David Rydstrand2,7253.65−3.18
Greens Chris Harris 2,1682.90+1.35
Unity John Lau1,3751.84−2.40
Christian Democrats David Barker1,0811.45+1.43
Total formal votes74,74693.41−2.30
Informal votes5,2776.59+2.30
Turnout 80,02394.89
Two-party-preferred result
Labor Robert McClelland 41,87356.02−3.77
Liberal Jan Brennan32,87343.98+3.77
Labor hold Swing −3.77

Bennelong

This section is an excerpt from Electoral results for the Division of Bennelong § 2001
2001 Australian federal election: Bennelong [3]
PartyCandidateVotes%±%
Liberal John Howard 41,25553.07+4.30
Labor Nicole Campbell24,05330.94−1.42
Democrats Peter Goldfinch4,4155.68+0.98
Greens Jimmy Shaw3,1334.03+1.05
One Nation Robert Webeck2,1262.73−1.56
Independent May Law1,4741.90+1.90
No GST Bruce Harkness5350.69+0.47
Independent John Dawson4580.59+0.38
Save the ADI Site Noel Plumb2050.26+0.26
Non-Custodial Parents Peter Marsh840.11+0.11
Total formal votes77,73894.58+0.02
Informal votes4,4575.42−0.02
Turnout 82,19594.84
Two-party-preferred result
Liberal John Howard 44,86157.70+2.47
Labor Nicole Campbell32,87742.30−2.47
Liberal hold Swing +2.47

Berowra

This section is an excerpt from Electoral results for the Division of Berowra § 2001
2001 Australian federal election: Berowra
PartyCandidateVotes%±%
Liberal Philip Ruddock 45,57558.57+4.10
Labor Richard Slater17,74822.81−3.94
Democrats Philip Sparks5,0476.49−0.04
Greens Maureen Gale4,0295.18+1.98
Christian Democrats Owen Nannelli1,6322.10−0.25
One Nation Harry Ball1,5371.98−4.37
Unity Daniel Choi1,1241.44+1.11
No GST P J Gallagher1,1171.44+1.44
Total formal votes77,80995.64−1.28
Informal votes3,5444.36+1.28
Turnout 81,35395.18
Two-party-preferred result
Liberal Philip Ruddock 51,07865.65+2.28
Labor Richard Slater26,73134.35−2.28
Liberal hold Swing +2.28

Blaxland

This section is an excerpt from Electoral results for the Division of Blaxland § 2001
2001 Australian federal election: Blaxland [3]
PartyCandidateVotes%±%
Labor Michael Hatton 37,95654.13−6.40
Liberal Les Osmond18.17025.91+3.78
One Nation Bob Vinnicombe4,2486.06−0.94
Democrats Colin McDermott3,4614.94+2.53
Greens Sonya McKay1,8392.62+1.07
Christian Democrats Janne Peterson1,5352.19−0.03
Unity Dario Hawat1,4932.13−1.35
Independent Peter Sayegh9751.39+1.39
Independent Munther Anny4430.63+0.63
Total formal votes70,12090.22−4.26
Informal votes7,6059.78+4.26
Turnout 77,72594.49
Two-party-preferred result
Labor Michael Hatton 45,72565.21−6.50
Liberal Les Osmond24,39534.79+6.50
Labor hold Swing −6.50

Bradfield

This section is an excerpt from Electoral results for the Division of Bradfield § 2001
2001 Australian federal election: Bradfield [3]
PartyCandidateVotes%±%
Liberal Brendan Nelson 52,62864.60+2.00
Labor Kathie Blunt15,48919.01−1.01
Greens David Bell5,4516.69+3.56
Democrats Peter Byrne5,4436.68−0.99
One Nation John Webeck1,2471.53−2.05
Christian Democrats Witold Wiszniewski1,2041.48−0.04
Total formal votes81,46296.24−0.81
Informal votes3,1793.76+0.81
Turnout 84,64194.46
Two-party-preferred result
Liberal Brendan Nelson 57,96971.16−0.13
Labor Kathie Blunt23,49328.84+0.13
Liberal hold Swing −0.13

Calare

This section is an excerpt from Electoral results for the Division of Calare § 2001
2001 Australian federal election: Calare [3] [5]
PartyCandidateVotes%±%
Independent Peter Andren 40,78651.40+15.12
Labor Kath Knowles16,31420.56−4.00
National Dave Shearing16,28920.53+8.58
One Nation Terry Nixon3,2494.09−6.95
Greens Ian Watts1,2171.53+0.43
Democrats Don Marshall1,1911.50+0.51
Citizens Electoral Council David Simpson3110.39+0.17
Total formal votes79,35796.72+0.24
Informal votes2,6903.28−0.24
Turnout 82,04796.99
Notional two-party-preferred count
National Dave Shearing41,05551.73−2.74
Labor Kath Knowles38,30248.27+2.74
Two-candidate-preferred result
Independent Peter Andren 59,54875.04+2.73
National Dave Shearing19,80924.96+24.96
Independent hold Swing +2.73

Charlton

This section is an excerpt from Electoral results for the Division of Charlton § 2001
2001 Australian federal election: Charlton
PartyCandidateVotes%±%
Labor Kelly Hoare 35,07946.06−2.53
Liberal Lindsay Paterson25,37133.31+5.07
One Nation Bob Johnson5,8847.73−4.28
Democrats Joshua Bell3,8655.07+0.44
Greens David Blyth3,7654.94+1.63
Christian Democrats Jim Kendall1,8592.44−0.62
Unity John Thorpe3390.45+0.45
Total formal votes76,16295.43−1.58
Informal votes3,6514.57+1.58
Turnout 79,81396.04
Two-party-preferred result
Labor Kelly Hoare 43,15156.66−5.54
Liberal Lindsay Paterson33,01143.34+5.54
Labor hold Swing −5.54

Chifley

This section is an excerpt from Electoral results for the Division of Chifley § 2001
2001 Australian federal election: Chifley
PartyCandidateVotes%±%
Labor Roger Price 40,20356.30−3.48
Liberal Costa Asarloglou18,22525.52+6.53
One Nation Joe Damjanovic4,4426.22−4.07
Save the ADI Site Barbie Bates2,3473.29+3.29
Christian Democrats Joseph Wyness1,7842.50+0.19
Democrats S J Clack1,3651.91−2.63
Against Further Immigration Lindsey Butler1,2621.77+1.77
Greens David Cunningham1,2201.71+0.25
Independent Wayne Hyland5650.79+0.79
Total formal votes71,41390.80−3.14
Informal votes7,2329.20+3.14
Turnout 78,64594.93
Two-party-preferred result
Labor Roger Price 46,62865.29−5.98
Liberal Costa Asarloglou24,78534.71+5.98
Labor hold Swing −5.98

Cook

This section is an excerpt from Electoral results for the Division of Cook § 2001
2001 Australian federal election: Cook
PartyCandidateVotes%±%
Liberal Bruce Baird 41,95956.22+6.14
Labor Peri Young19,76826.49−4.60
One Nation Andy Frew4,4535.97−2.36
Democrats Alison Bailey2,8153.77−0.50
Greens Cathy Peters-Power2,6553.56+1.38
Christian Democrats Malcolm Smith1,2561.68+0.43
Against Further Immigration Peter James8521.14+1.14
Independent Patricia Poulos4530.61+0.61
Independent Graeme Strang4230.57+0.57
Total formal votes74,63495.35−0.62
Informal votes3,6404.65+0.62
Turnout 78,27496.06
Two-party-preferred result
Liberal Bruce Baird 47,76864.00+4.63
Labor Peri Young26,86636.00−4.63
Liberal hold Swing +4.63

Cowper

This section is an excerpt from Electoral results for the Division of Cowper § 2001
2001 Australian federal election: Cowper
PartyCandidateVotes%±%
Labor Jenny Bonfield23,61532.31−1.90
National Luke Hartsuyker 21,84629.89−11.87
Liberal Philip Neuss11,66315.95+15.95
One Nation Allan Stokes5,1647.06−7.18
Greens Jillian Cranny4,0335.52+1.48
Democrats Michael Fenton1,9782.71−0.71
Lower Excise Fuel John Maguire1,9042.60+2.60
Christian Democrats Bruce Korn1,4722.01+1.79
Independent John Willey9731.33+1.33
Independent Paul van Bladel4520.62+0.62
Total formal votes73,10095.89−1.34
Informal votes3,1314.11+1.34
Turnout 76,23196.05
Two-party-preferred result
National Luke Hartsuyker 40,00654.73−0.98
Labor Jenny Bonfield33,09445.27+0.98
National hold Swing −0.98

Cunningham

This section is an excerpt from Electoral results for the Division of Cunningham § 2001
2001 Australian federal election: Cunningham [3]
PartyCandidateVotes%±%
Labor Stephen Martin 32,72244.19−8.13
Liberal Jeremy Fields20,76028.04+2.97
Democrats Michael Newman5,3077.17+1.44
Greens Carol Berry4,9146.64+2.22
Independent Trevor Mott4,2355.72+5.72
One Nation John Curtis3,4254.63−3.11
Christian Democrats Paul Skinner1,8412.49+0.17
No GST J Edwin Pink8401.13+1.13
Total formal votes74,04495.16−1.39
Informal votes3,7634.84+1.39
Turnout 77,80795.81
Two-party-preferred result
Labor Stephen Martin 44,90460.65−7.12
Liberal Jeremy Fields29,14039.35+7.12
Labor hold Swing −7.12

Dobell

This section is an excerpt from Electoral results for the Division of Dobell § 2001
2001 Australian federal election: Dobell
PartyCandidateVotes%±%
Liberal Ken Ticehurst 32,76143.93+5.51
Labor Michael Lee 31,82442.68-1.94
One Nation Ron Falconer3,2234.32-5.05
Democrats Carolyn Hastie3,1424.21+0.79
Greens Samantha Ker2,2002.95+0.80
Christian Democrats Luke Hennig1,4201.90-0.12
Total formal votes74,57095.74-1.22
Informal votes3,3184.26+1.22
Turnout 77,88895.61
Two-party-preferred result
Liberal Ken Ticehurst 37,56550.38+1.91
Labor Michael Lee 37,00549.62-1.91
Liberal gain from Labor Swing +1.91

Eden-Monaro

This section is an excerpt from Electoral results for the Division of Eden-Monaro § 2001
2001 Australian federal election: Eden-Monaro
PartyCandidateVotes%±%
Liberal Gary Nairn 32,24741.08-2.16
Labor Steve Whan 28,84236.74-2.32
Independent Peter Cochran 6,4368.20+8.20
Greens Rosemary Beaumont3,9114.98+1.80
One Nation Barry Bridges2,8213.59-5.97
Democrats Linda Chapman2,5843.29-1.32
Christian Democrats Frank Phillips1,0321.31+1.31
Independent Steve Urquhart3190.41+0.41
Independent Matthew Swift2110.27+0.27
Non-Custodial Parents Peter Vlug940.12+0.12
Total formal votes78,49795.58-1.21
Informal votes3,6284.42+1.21
Turnout 82,12596.18
Two-party-preferred result
Liberal Gary Nairn 40,57951.69+1.07
Labor Steve Whan 37,91848.31-1.07
Liberal hold Swing +1.07

Farrer

This section is an excerpt from Electoral results for the Division of Farrer § 2001
2001 Australian federal election: Farrer [3]
PartyCandidateVotes%±%
Liberal Sussan Ley 28,44937.66+33.30
National Bill Bott17,64123.36-24.73
Labor Frank Millen15,83020.96-3.79
One Nation Max Wilkinson4,7956.35-7.61
Greens Chris Sobey2,5833.42+3.23
Democrats Brett Paterson1,9592.59-1.42
Independent Sue Taylor1,2541.66+1.66
Independent Stuart Watson1,0681.41+1.41
Keith Kreutzberger6960.92+0.92
Independent Tom Weyrich4850.64+0.64
Independent Andrew Gibson4160.55+0.55
Independent David Corbett3560.47+0.47
Total formal votes75,53293.61-2.37
Informal votes5,1566.39+2.37
Turnout 80,68896.04
Two-party-preferred result
Liberal Sussan Ley 37,86950.14+50.14
National Bill Bott37,66349.86-14.76
Liberal gain from National Swing +50.14

Fowler

This section is an excerpt from Electoral results for the Division of Fowler § 2001
2001 Australian federal election: Fowler
PartyCandidateVotes%±%
Labor Julia Irwin 40,90460.70-1.61
Liberal Glenn Watson12,15418.04+1.83
Unity Steve Chung3,4765.16-5.81
One Nation Oscar Rosso2,3573.50-3.70
Citizens Electoral Council Hal Johnson2,1663.21+3.21
Greens Lee Grant1,6542.45+2.35
No GST Robin Gaskell1,3952.07+2.07
Democrats David Mendelssohn1,3201.96-1.22
Christian Democrats Manny Poularas1,1101.65+1.65
Against Further Immigration Max Brazenall8531.27+1.27
Total formal votes67,38987.29-6.92
Informal votes9,81612.71+6.92
Turnout 77,20593.74
Two-party-preferred result
Labor Julia Irwin 48,17471.50-4.49
Liberal Glenn Watson19,21528.50+4.49
Labor hold Swing -4.49

Gilmore

This section is an excerpt from Electoral results for the Division of Gilmore § 2001
2001 Australian federal election: Gilmore
PartyCandidateVotes%±%
Liberal Joanna Gash 43,08956.11+10.97
Labor Peter Knott 20,01126.06-9.78
One Nation Geoff Crocker4,4545.80-5.24
Greens Jane Bange4,2185.49+2.78
Democrats Michael Hayes3,3234.33+1.04
Christian Democrats Steve Ryan1,2531.63-0.36
Unity Paul McLeod3390.44+0.44
Citizens Electoral Council Jean McClung1130.15+0.15
Total formal votes76,80095.66-2.05
Informal votes3,4854.34+2.05
Turnout 80,28596.49
Two-party-preferred result
Liberal Joanna Gash 49,63464.63+10.08
Labor Peter Knott 27,16635.37-10.08
Liberal hold Swing +10.08

Grayndler

This section is an excerpt from Electoral results for the Division of Grayndler § 2001
2001 Australian federal election: Grayndler [3]
PartyCandidateVotes%±%
Labor Anthony Albanese 36,37949.15-6.56
Liberal Brett Kenworthy16,97122.93+2.16
Greens Sylvia Hale 9,66613.06+8.42
Democrats Matthew Baird6,7509.12+3.34
One Nation Kane O'Connor1,4852.01-1.06
Unity Guang Hua Wan1,0091.36-3.14
Sue Johnson9541.29+1.29
Christian Democrats Chris Herden8051.09+0.35
Total formal votes74,01993.44-1.45
Informal votes5,1936.56+1.45
Turnout 79,21292.52
Two-party-preferred result
Labor Anthony Albanese 52,77071.29-1.03
Liberal Brett Kenworthy21,24928.71+1.03
Labor hold Swing -1.03

Greenway

This section is an excerpt from Electoral results for the Division of Greenway § 2001
2001 Australian federal election: Greenway
PartyCandidateVotes%±%
Labor Frank Mossfield 32,38042.67-3.34
Liberal Rick Holder28,03836.94+5.68
Christian Democrats Bob Bawden4,2725.63+1.43
One Nation Tony Pettitt4,1555.47-4.48
Democrats Joseph Francis2,8183.71-0.83
Greens Tony Vlatko2,0022.64+0.77
Against Further Immigration Ted Sherwood1,6082.12+2.12
Independent Amarjit Singh Tanda6200.82+0.82
Total formal votes75,89393.21-1.36
Informal votes5,5306.79+1.36
Turnout 81,42395.18
Two-party-preferred result
Labor Frank Mossfield 40,31053.11-6.44
Liberal Rick Holder35,58346.89+6.44
Labor hold Swing -6.44

Gwydir

This section is an excerpt from Electoral results for the Division of Gwydir § 2001
2001 Australian federal election: Gwydir
PartyCandidateVotes%±%
National John Anderson 40,43752.63+11.15
Labor Anne Murnain17,40222.65-5.71
One Nation Colin Rogers7,71610.04-9.10
Independent Bruce Haigh 4,6376.04+6.04
Greens Neil Strachan1,3241.72+1.52
Independent Bevan O'Regan1,2891.68+1.68
Democrats Ken Graham1,2421.62-0.83
Citizens Electoral Council Richard Witten1,1971.56+1.48
Lower Excise Fuel Harry Weber1,1941.55+1.55
Independent Gary Edwards3890.51-0.32
Total formal votes76,82795.52-0.51
Informal votes3,6034.48+0.51
Turnout 80,43095.54
Two-party-preferred result
National John Anderson 49,84464.88+2.88
Labor Anne Murnain26,98335.12-2.88
National hold Swing +2.88

Hughes

This section is an excerpt from Electoral results for the Division of Hughes § 2001
2001 Australian federal election: Hughes
PartyCandidateVotes%±%
Liberal Danna Vale 42,39353.61+5.86
Labor Christine Hawkins24,70631.24-2.12
One Nation Susan Oz3,8854.91-3.64
Greens Simon Heemstra3,6044.56+1.92
Democrats Bruce van de Weg2,8113.55-0.21
Christian Democrats William Ryan1,6762.12+2.10
Total formal votes79,07595.95-0.26
Informal votes3,3414.05+0.26
Turnout 82,41696.51
Two-party-preferred result
Liberal Danna Vale 47,77360.41+4.05
Labor Christine Hawkins31,30239.59-4.05
Liberal hold Swing +4.05

Hume

This section is an excerpt from Electoral results for the Division of Hume § 2001
2001 Australian federal election: Hume
PartyCandidateVotes%±%
Liberal Alby Schultz 41,89952.99+7.45
Labor Jan Merriman23,38929.58−2.74
One Nation Charlie Prell6,5898.33−2.29
Democrats James Roxburgh3,7624.76+0.82
Greens Kevin Watchirs3,4354.34+1.38
Total formal votes79,07496.45+0.11
Informal votes2,9083.55−0.11
Turnout 81,98296.15
Two-party-preferred result
Liberal Alby Schultz 47,27859.79+2.46
Labor Jan Merriman31,79640.21−2.46
Liberal hold Swing +2.46

Hunter

This section is an excerpt from Electoral results for the Division of Hunter § 2001
2001 Australian federal election: Hunter
PartyCandidateVotes%±%
Labor Joel Fitzgibbon 41,12352.32-2.94
National Rob Macaulay21,61327.50+21.95
One Nation Bill Fox8,10010.31+0.43
Greens Larry O'Brien3,5534.52+2.30
Democrats Rod Bennison3,0713.91+1.16
Citizens Electoral Council Ann Lawler1,1371.45+0.91
Total formal votes78,59796.58-0.20
Informal votes2,7803.42+0.20
Turnout 81,37796.76
Two-party-preferred result
Labor Joel Fitzgibbon 47,83860.86-3.83
National Rob Macaulay30,75939.14+39.14
Labor hold Swing -3.83

Kingsford Smith

This section is an excerpt from Electoral results for the Division of Kingsford Smith § 2001
2001 Australian federal election: Kingsford Smith [3]
PartyCandidateVotes%±%
Labor Laurie Brereton 36,42847.69-3.70
Liberal Bruce Notley-Smith 26,16934.26+3.27
Greens Arthur Hurwitz5,5517.27+3.65
Democrats Peter Zakrzewski3,9745.20+1.19
One Nation Jill Brown3,7104.86-0.81
Marina Carman5580.73+0.73
Total formal votes76,39093.86-0.96
Informal votes4,9966.14+0.96
Turnout 81,38694.60
Two-party-preferred result
Labor Laurie Brereton 44,99558.90-4.05
Liberal Bruce Notley-Smith 31,39541.10+4.05
Labor hold Swing -4.05

Lindsay

This section is an excerpt from Electoral results for the Division of Lindsay § 2001
2001 Australian federal election: Lindsay
PartyCandidateVotes%±%
Liberal Jackie Kelly 34,33946.93+4.47
Labor David Bradbury 25,32034.60-3.48
One Nation Bill Nixon3,7685.15-5.06
Save the ADI Site Geoff Brown2,3913.27+3.27
Christian Democrats John Phillips1,9302.64+1.28
Greens Lesley Edwards1,8192.49+0.49
Democrats Geraldine Waters1,5842.16-0.78
Independent Anthony David Courtney7270.99+0.99
No GST Jean M Eykamp5340.73+0.73
Independent Steve Lindsay-Henderson4000.55+0.55
Independent Graham Mitchell2360.32+0.32
Non-Custodial Parents Stephen Walker1220.17+0.17
Total formal votes73,17093.86-0.71
Informal votes4,7856.14+0.71
Turnout 77,95596.57
Two-party-preferred result
Liberal Jackie Kelly 40,59055.47+2.44
Labor David Bradbury 32,58044.53-2.44
Liberal hold Swing +2.44

Lowe

This section is an excerpt from Electoral results for the Division of Lowe § 2001
2001 Australian federal election: Lowe [3]
PartyCandidateVotes%±%
Labor John Murphy 33,50844.77+8.64
Liberal David Doust31,40041.96+8.72
Democrats Anna Garrett3,3594.49+2.09
Greens Mersina Soulos3,1454.20+2.42
Unity Ernest Wong 1,7002.27-1.76
One Nation Harry Krumins1,4631.95-1.73
Max Lane2670.36+0.36
Total formal votes74,84294.20-1.26
Informal votes4,6065.80+1.26
Turnout 79,44895.38
Two-party-preferred result
Labor John Murphy 40,27153.81-0.89
Liberal David Doust34,57146.19+0.89
Labor hold Swing -0.89

Lyne

This section is an excerpt from Electoral results for the Division of Lyne § 2001
2001 Australian federal election: Lyne [3]
PartyCandidateVotes%±%
National Mark Vaile 42,69953.30+3.61
Labor Pat Stevens23,40529.22−0.01
One Nation Lynn Stanfield8,17810.21−2.97
Greens Siobhan Isherwood2,3802.97+0.75
Democrats Philip Jirman2,2372.79+0.08
Independent Dane William Sara9631.20+1.20
Citizens Electoral Council Graeme Muldoon2480.31+0.07
Total formal votes80,10996.10−0.27
Informal votes3,2473.90+0.27
Turnout 83,35696.78
Two-party-preferred result
National Mark Vaile 49,05761.24+1.11
Labor Pat Stevens31,05238.76−1.11
National hold Swing +1.11

Macarthur

This section is an excerpt from Electoral results for the Division of Macarthur § 2001
2001 Australian federal election: Macarthur [3]
PartyCandidateVotes%±%
Liberal Pat Farmer 36,34850.79+10.67
Labor Meg Oates25,67535.88-4.91
One Nation Len Watkins3,7595.25-5.75
Greens Geraldine Hunt2,1833.05+0.23
Democrats Jasmine Lantry1,5552.17-1.97
Christian Democrats Elwyn Sheppard1,0521.47+1.47
Independent Gregory John Knowles7571.06+1.06
Non-Custodial Parents Eric Sanders2360.33+0.33
Total formal votes71,56594.07-2.05
Informal votes4,5085.93+2.05
Turnout 76,07395.52
Two-party-preferred result
Liberal Pat Farmer 40,76756.96+8.65
Labor Meg Oates30,79843.04-8.65
Liberal notional  gain from Labor Swing +8.65

Mackellar

This section is an excerpt from Electoral results for the Division of Mackellar § 2001
2001 Australian federal election: Mackellar [3]
PartyCandidateVotes%±%
Liberal Bronwyn Bishop 44,85457.64+2.51
Labor Ben Carpentier14,70818.90+0.11
Democrats Vicki Dimond7,3659.46+0.01
Greens Andrea Pape6,2778.07+4.75
One Nation Peter Cuthbertson2,1822.80-4.18
Independent George May1,2651.63+1.63
Against Further Immigration Tom Moody1,1711.50+1.50
Total formal votes77,82295.34-1.14
Informal votes3,8014.66+1.14
Turnout 81,62394.67
Two-party-preferred result
Liberal Bronwyn Bishop 52,03966.87-0.26
Labor Ben Carpentier25,78333.13+0.26
Liberal hold Swing -0.26

Macquarie

This section is an excerpt from Electoral results for the Division of Macquarie § 2001
2001 Australian federal election: Macquarie
PartyCandidateVotes%±%
Liberal Kerry Bartlett 40,22551.00+7.37
Labor Adam Searle 21,16026.83-7.27
Greens Leigh Williams6,6448.42+5.05
Democrats Les Majoros4,3045.46-0.98
One Nation Wayne Buckley3,8934.94-5.29
Christian Democrats Brian Grigg1,5591.98+1.91
Save the ADI Site Robert Warren1,0861.38+1.38
Total formal votes78,86196.15-0.89
Informal votes3,1603.85+0.89
Turnout 82,03195.30
Two-party-preferred result
Liberal Kerry Bartlett 46,27358.67+2.90
Labor Adam Searle 32,59841.33-2.90
Liberal hold Swing +2.90

Mitchell

This section is an excerpt from Electoral results for the Division of Mitchell § 2001
2001 Australian federal election: Mitchell [3]
PartyCandidateVotes%±%
Liberal Alan Cadman 49,99563.26+3.35
Labor John McShane16,98721.49-0.47
Democrats David Baggs3,7694.77-0.26
Greens Cindy Taylor2,4703.13+0.87
One Nation Dale Eder2,1832.76-3.58
Christian Democrats Ken Gregory1,6812.13+0.53
Against Further Immigration David Mudgee1,2351.56+1.56
Independent Stephen Burke7120.90+0.90
Total formal votes79,03295.50-1.05
Informal votes3,7254.50+1.05
Turnout 82,75795.81
Two-party-preferred result
Liberal Alan Cadman 56,36671.32+1.85
Labor John McShane22,66628.68-1.85
Liberal hold Swing +1.85

New England

This section is an excerpt from Electoral results for the Division of New England § 2001
2001 Australian federal election: New England [4]
PartyCandidateVotes%±%
Independent Tony Windsor 35,99245.04+45.04
National Stuart St. Clair 31,07938.90+6.40
Labor Annette McCarthy7,9479.95-13.58
One Nation Kayleen Bounds2,2022.76-11.78
Greens Michelle Reiner1,8072.26+0.34
Democrats Chris Reardon8761.10-1.10
Total formal votes79,90398.03+1.68
Informal votes1,6081.97-1.68
Turnout 81,51196.98
Notional two-party-preferred count
National Stuart St. Clair 51,01763.85+0.2
Labor Annette McCarthy28,88636.15−0.2
Two-candidate-preferred result
Independent Tony Windsor 46,58058.30+58.30
National Stuart St. Clair 33,32341.70-21.23
Independent gain from National Swing +58.30

Newcastle

This section is an excerpt from Electoral results for the Division of Newcastle2001
2001 Australian federal election: Newcastle [3]
PartyCandidateVotes%±%
Labor Sharon Grierson 32,79040.95-8.12
Liberal David M Williams24,31230.37+27.56
Greens John Sutton6,0227.52-0.95
One Nation Barrie Lawn4,7535.94-9.52
Democrats Mary Kavanagh4,6015.75-2.31
Progressive Labour Harry Williams4,0935.11+3.59
Independent Harry Criticos1,8992.37-1.29
Christian Democrats Elaine Battersby1,2381.55-1.14
Erin Killion-DelCastillo3540.44+0.44
Total formal votes80,05295.20-0.12
Informal votes4,0374.80+0.12
Turnout 84,08994.61
Two-party-preferred result
Labor Sharon Grierson 45,55556.91-10.42
Liberal David M Williams34,49743.09+43.09
Labor hold Swing -10.42

North Sydney

This section is an excerpt from Electoral results for the Division of North Sydney § 2001
2001 Australian federal election: North Sydney [3]
PartyCandidateVotes%±%
Liberal Joe Hockey 44,99556.96+1.80
Labor Fran Teirney19,32524.47-1.31
Democrats Bryan McGuire6,5288.26+1.13
Greens Mike Steel6,0537.66+3.81
Christian Democrats Colin Ward1,2271.55+0.81
Unity Brian Lam8611.09-2.92
Total formal votes78,98995.98-0.70
Informal votes3,3104.02+0.70
Turnout 82,29993.11
Two-party-preferred result
Liberal Joe Hockey 49,93463.21+0.55
Labor Fran Teirney29,05536.79-0.55
Liberal hold Swing +0.55

Page

This section is an excerpt from Electoral results for the Division of Page § 2001
2001 Australian federal election: Page
PartyCandidateVotes%±%
National Ian Causley 31,20441.85-0.46
Labor Terry Flanagan21,61829.00-6.38
Independent Tom Cooper5,4827.35+7.35
Greens John Corkill5,3657.20+2.53
One Nation Marie Mathew4,0395.42-5.32
Democrats Allan Jeffreys2,0122.70-0.17
Christian Democrats Arthur James Felsch1,3441.80+0.54
HEMP Judy Canales1,2741.71+1.71
Independent Kathryn Pollard-O'Hara1,2401.66+1.66
Independent Doug Behn6360.85-0.95
Edda Lampis2310.31+0.31
Citizens Electoral Council Angela Griffiths1100.15+0.15
Total formal votes74,55594.68-2.73
Informal votes4,1895.32+2.73
Turnout 78,74496.36
Two-party-preferred result
National Ian Causley 39,34252.77-0.59
Labor Terry Flanagan35,21347.23+0.59
National hold Swing -0.59

Parkes

This section is an excerpt from Electoral results for the Division of Parkes § 2001
2001 Australian federal election: Parkes
PartyCandidateVotes%±%
National John Cobb 39,13351.10+21.85
Labor Joe Knagge25,42933.21-0.64
One Nation Bob Redfern7,96910.41-2.20
Democrats Geoff Ward2,1112.76+1.07
Greens Samantha Dunlop1,9362.53+2.49
Total formal votes76,57896.50-0.42
Informal votes2,7813.50+0.42
Turnout 79,35996.08
Two-party-preferred result
National John Cobb 44,98258.74+2.36
Labor Joe Knagge31,59641.26-2.36
National hold Swing +2.36

Parramatta

This section is an excerpt from Electoral results for the Division of Parramatta § 2001
2001 Australian federal election: Parramatta [3]
PartyCandidateVotes%±%
Liberal Ross Cameron 35,35645.94+5.59
Labor David Borger 31,86741.41-0.34
Democrats Anthony Clark2,6223.41+0.50
Greens Felicity George2,3803.09+1.35
One Nation John Satchwell2,2792.96-3.38
Christian Democrats Dee Jonsson1,1771.53-0.05
Unity Somchai Tongsumrith1,1311.47-2.73
Non-Custodial Parents Will Watson1480.19+0.19
Total formal votes76,96093.79-1.03
Informal votes5,0986.21+1.03
Turnout 82,05894.47
Two-party-preferred result
Liberal Ross Cameron 39,36751.15+3.64
Labor David Borger 37,59348.85-3.64
Liberal notional  gain from Labor Swing +3.64

Paterson

This section is an excerpt from Electoral results for the Division of Paterson § 2001
2001 Australian federal election: Paterson [3]
PartyCandidateVotes%±%
Labor Bob Horne 31,43040.75+0.16
Liberal Bob Baldwin 30,78139.91+7.17
National Ian Shaw5,5447.19-2.47
One Nation Paul Cary4,2335.49-3.84
Greens Aina Ranke2,0952.72+0.87
Democrats Sharon Davies1,9792.57+0.44
Fishing Party Paul Hennelly7200.93+0.93
Citizens Electoral Council Tony King3390.44-0.36
Total formal votes77,12196.39-0.20
Informal votes2,8903.61+0.20
Turnout 80,01197.27
Two-party-preferred result
Liberal Bob Baldwin 39,65851.42+0.16
Labor Bob Horne 37,46348.58-0.16
Liberal notional  hold Swing +0.16

Prospect

This section is an excerpt from Electoral results for the Division of Prospect § 2001
2001 Australian federal election: Prospect
PartyCandidateVotes%±%
Labor Janice Crosio 41,59655.36-1.23
Liberal Gareth Perkins20,77627.65+1.98
Greens Rebecca Filipczyk3,4394.58+3.07
One Nation John Hutchinson3,3804.50-3.19
Christian Democrats Lewis Haroon1,9272.56+2.31
Democrats Thomas Peacock1,7232.29-2.60
Against Further Immigration Garry Oates1,2741.70+1.70
Unity Kek Tai1,0271.37-1.43
Total formal votes75,14291.05-2.64
Informal votes7,3888.95+2.64
Turnout 82,53095.60
Two-party-preferred result
Labor Janice Crosio 47,19762.81-3.96
Liberal Gareth Perkins27,94537.19+3.96
Labor hold Swing -3.96

Reid

This section is an excerpt from Electoral results for the Division of Reid § 2001
2001 Australian federal election: Reid
PartyCandidateVotes%±%
Labor Laurie Ferguson 36,47457.09-0.96
Liberal Irfan Yusuf 14,36422.48+1.18
One Nation Shane O'Connor3,4765.44-1.20
Unity Habib Chamas3,0564.78-0.82
Democrats Adrian Archer2,1833.42+0.40
Greens Steve Maxwell1,9203.01+1.28
Christian Democrats Uwe Ledermann1,5022.35-0.90
Lisa Macdonald9161.43+1.43
Total formal votes63,89188.92-4.02
Informal votes7,96411.08+4.02
Turnout 71,85593.51
Two-party-preferred result
Labor Laurie Ferguson 42,72666.87-5.30
Liberal Irfan Yusuf 21,16533.13+5.30
Labor hold Swing -5.30

Richmond

This section is an excerpt from Electoral results for the Division of Richmond § 2001
2001 Australian federal election: Richmond
PartyCandidateVotes%±%
National Larry Anthony 32,51644.76+5.50
Labor Jenny McAllister 24,70234.00-4.65
Greens Jan Barham 7,31010.06+4.36
One Nation Dell Rolfe3,0164.15-6.09
Democrats Casey Balk2,0852.87-0.03
Independent Julie Nathan9421.30+1.30
HEMP Dean Jefferys9191.26+1.26
One Nation John Penhaligon6680.92+0.92
Independent Rob Simpson2490.34+0.34
Independent Nicolas Faulkner1610.22+0.22
Non-Custodial Parents Alexander Peniazev850.12+0.12
Total formal votes72,65394.65-2.65
Informal votes4,1065.35+2.65
Turnout 76,75995.00
Two-party-preferred result
National Larry Anthony 37,54551.68+0.85
Labor Jenny McAllister 35,10848.32-0.85
National hold Swing +0.85

Riverina

This section is an excerpt from Electoral results for the Division of Riverina § 2001
2001 Australian federal election: Riverina
PartyCandidateVotes%±%
National Kay Hull 49,37161.45+29.25
Labor Andrew Albiston19,28524.00-3.38
One Nation Neil Turner4,4965.60-5.89
Democrats Rex Graham2,0312.53+0.24
Greens Catherine Moore1,9542.43+2.22
Independent Dennis Richter1,8392.29+2.29
Christian Democrats Russell Dancey1,3711.71+1.71
Total formal votes80,34795.84-1.00
Informal votes3,4884.16+1.00
Turnout 83,83596.48
Two-party-preferred result
National Kay Hull 56,13869.88+5.22
Labor Andrew Albiston24,20930.12-5.22
National hold Swing +5.22

Robertson

This section is an excerpt from Electoral results for the Division of Robertson § 2001
2001 Australian federal election: Robertson
PartyCandidateVotes%±%
Liberal Jim Lloyd 38,44850.80+6.90
Labor Trish Moran25,78934.08-5.77
Democrats Harry Boyle2,7363.62-0.78
Greens Stephen Lacey2,5123.32+1.19
One Nation Errol Baker2,3333.08-6.16
Christian Democrats Christine Hennig1,0921.44+1.44
Independent Kevin Wills7440.98+0.98
Independent Kaijin Kenisciehad6570.87+0.87
Independent James Laing-Peach5250.69+0.69
Progressive Labour Barry Phillips3740.49+0.49
Independent Alasdair Munn3480.46+0.46
Citizens Electoral Council Ken Martin1250.17+0.17
Total formal votes75,68393.89-3.20
Informal votes4,9286.11+3.20
Turnout 80,61196.25
Two-party-preferred result
Liberal Jim Lloyd 43,12156.98+4.97
Labor Trish Moran32,56243.02-4.97
Liberal hold Swing +4.97

Shortland

This section is an excerpt from Electoral results for the Division of Shortland § 2001
2001 Australian federal election: Shortland [3]
PartyCandidateVotes%±%
Labor Jill Hall 39,13949.70-2.24
Liberal Brian Perrem27,30234.67+6.33
One Nation Iris Candlish3,6864.68-5.63
Greens Joan Lambert3,2424.12+0.60
Democrats Steven Adams2,4843.15-0.25
Independent Peter Craig2,3122.94+2.94
Independent Ron Gardnir5900.75+0.75
Total formal votes78,75595.44-1.60
Informal votes3,7654.56+1.60
Turnout 82,52096.19
Two-party-preferred result
Labor Jill Hall 46,29058.78-3.45
Liberal Brian Perrem32,46541.22+3.45
Labor hold Swing -3.45

Sydney

This section is an excerpt from Electoral results for the Division of Sydney § 2001
2001 Australian federal election: Sydney
PartyCandidateVotes%±%
Labor Tanya Plibersek 32,96244.33-8.58
Liberal Jeff Pettett22,38030.10+4.28
Greens Jamie Parker 10,92414.69+8.32
Democrats Sydney Hickman8,09310.88+4.01
Total formal votes74,35995.76+0.08
Informal votes3,2924.24-0.08
Turnout 77,65191.07
Two-party-preferred result
Labor Tanya Plibersek 48,36365.04-4.72
Liberal Jeff Pettett25,99634.96+4.72
Labor hold Swing -4.72

Throsby

This section is an excerpt from Electoral results for the Division of Throwsby § 2001
2001 Australian federal election: Throsby
PartyCandidateVotes%±%
Labor Jennie George 41,96354.90-6.32
Liberal Alan Akhurst19,28025.22+7.84
Democrats Madeleine Roberts5,7437.51+3.72
One Nation Ivan Prsa4,9696.50-4.83
Greens Elsa Story3,4444.51+1.45
Margaret Perrott1,0431.36+1.36
Total formal votes76,44294.81-1.29
Informal votes4,1835.19+1.29
Turnout 80,62596.06
Two-party-preferred result
Labor Jennie George 49,76765.10-7.32
Liberal Alan Akhurst26,67534.90+7.32
Labor hold Swing -7.32

Warringah

This section is an excerpt from Electoral results for the Division of Warringah § 2001
2001 Australian federal election: Warringah [3] [1]
PartyCandidateVotes%±%
Liberal Tony Abbott 39,81651.45−3.43
Independent Peter Macdonald 21,49027.77+27.77
Labor Julie Heraghty9,35212.08−15.56
Greens Keelah Lam2,8593.69−0.40
Democrats Nina Burridge2,0922.70−3.35
One Nation David Kelly1,3471.74−3.83
No GST Christine Ferguson4370.56+0.37
Total formal votes77,39396.72−0.11
Informal votes2,6273.28+0.11
Turnout 80,02094.16
Two-party-preferred result
Liberal Tony Abbott 50,14162.66
Labor Julie Heraghty29,95937.34
Two-candidate-preferred result
Liberal Tony Abbott 43,08555.67−7.31
Independent Peter Macdonald 34,30844.33+44.33
Liberal hold Swing −7.31

Watson

This section is an excerpt from Electoral results for the Division of Watson § 2001
2001 Australian federal election: Watson
PartyCandidateVotes%±%
Labor Leo McLeay 39,51656.15-1.07
Liberal Arnold Plooy19,79128.12+1.73
Unity Ken Nam3,3494.76-0.51
Democrats Kristin Griffiths2,7883.96+0.80
Greens Dominic Fitzsimmons2,4463.48+2.00
One Nation Michelle Farrell2,1653.08-1.54
Ronald Poulsen3220.46+0.46
Total formal votes70,37792.48-2.41
Informal votes5,7267.52+2.41
Turnout 76,10393.23
Two-party-preferred result
Labor Leo McLeay 47,37467.31-0.31
Liberal Arnold Plooy23,00332.69+0.31
Labor hold Swing -0.31

Wentworth

This section is an excerpt from Electoral results for the Division of Wentworth § 2001
2001 Australian federal election: Wentworth
PartyCandidateVotes%±%
Liberal Peter King 39,29852.08+1.99
Labor Carolyn Neilson22,27729.52-3.49
Greens Alison Lyssa7,3719.77+4.88
Democrats Margaret Collings4,6396.15+0.11
One Nation Aub Golden1,2331.63-1.00
Unity Alan Jacobs6420.85+0.85
Total formal votes75,46095.15-1.20
Informal votes3,8454.85+1.20
Turnout 79,30592.29
Two-party-preferred result
Liberal Peter King 43,66057.86+0.49
Labor Carolyn Neilson31,80042.14-0.49
Liberal hold Swing +0.49

Werriwa

This section is an excerpt from Electoral results for the Division of Werriwa § 2001
2001 Australian federal election: Werriwa
PartyCandidateVotes%±%
Labor Mark Latham 35,98050.33−1.15
Liberal Paul Masina23,81633.32+4.24
One Nation P. Kotarski3,3724.72−6.16
Greens Roger Barsony1,8912.65+0.87
Democrats Glenda Blanch1,8862.64−0.79
Christian Democrats Greg Tan1,7592.46+2.46
Unity John Uri1,5272.14−0.04
Against Further Immigration Janey Woodger1,2561.76+1.76
Total formal votes71,48791.49−3.32
Informal votes6,6518.51+3.32
Turnout 78,13894.47
Two-party-preferred result
Labor Mark Latham 41,81058.49−4.13
Liberal Paul Masina29,67741.51+4.13
Labor hold Swing −4.13

See also

Related Research Articles

<span class="mw-page-title-main">Divisions of the Australian House of Representatives</span> Federal electorates in Australia

In Australia, electoral districts for the Australian House of Representatives are called divisions or more commonly referred to as electorates or seats. There are currently 151 single-member electorates for the Australian House of Representatives.

<span class="mw-page-title-main">Division of Chifley</span> Australian federal electoral division

The Division of Chifley is an Australian electoral division in the state of New South Wales.

This is a list of electoral division results for the Australian 1954 federal election.

This is a list of electoral division results for the Australian 1946 federal election.

This is a list of electoral division results for the Australian 1949 federal election.

This is a list of electoral division results for the Australian 1951 federal election.

This is a list of electoral division results for the Australian 1955 federal election.

This is a list of electoral division results for the Australian 1958 federal election.

This is a list of electoral division results for the Australian 1961 federal election.

This is a list of electoral division results for the Australian 1966 federal election.

This is a list of electoral division results for the Australian 1969 federal election.

This is a list of electoral division results for the Australian 1983 federal election.

<span class="mw-page-title-main">Results of the 2007 Australian federal election in New South Wales</span>

This is a list of electoral division results in the Australian 2007 federal election for the state of New South Wales.

<span class="mw-page-title-main">Results of the 2004 Australian federal election in New South Wales</span>

This is a list of electoral division results in the Australian 2004 federal election for the state of New South Wales.

<span class="mw-page-title-main">Results of the 1984 Australian federal election in New South Wales</span>

This is a list of electoral division results for the Australian 1984 federal election in the state of New South Wales.

<span class="mw-page-title-main">Results of the 1987 Australian federal election in New South Wales</span>

This is a list of electoral division results for the Australian 1987 federal election in the state of New South Wales.

<span class="mw-page-title-main">Results of the 1990 Australian federal election in New South Wales</span>

This is a list of electoral division results for the Australian 1990 federal election in the state of New South Wales.

<span class="mw-page-title-main">Results of the 1993 Australian federal election in New South Wales</span>

This is a list of electoral division results for the Australian 1993 federal election in the state of New South Wales.

<span class="mw-page-title-main">Results of the 1996 Australian federal election in New South Wales</span>

This is a list of electoral division results for the Australian 1996 federal election in the state of New South Wales.

<span class="mw-page-title-main">Results of the 1998 Australian federal election in New South Wales</span>

This is a list of electoral division results for the Australian 1998 federal election in the state of New South Wales.

References

  1. 1 2 3 "2001 First preference votes for New South Wales". Australian Electoral Commission. Retrieved 8 June 2022.
  2. "2001 New South Wales division results". Australian Electoral Commission. Retrieved 8 June 2022.
  3. 1 2 3 4 5 6 7 8 9 10 11 12 13 14 15 16 17 18 19 20 21 "2001 House of Representatives: New South Wales". Psephos Adam Carr's Election Archive. Retrieved 8 June 2022.
  4. 1 2 Bennett, Scott; Kopras, Andrew; Newman, Gerrard (2005). "Commonwealth Election 2001" (PDF). Research Paper 11 2001–02. Parliamentary Library. ISSN   1328-7478.
  5. "2001 Two Party Preferred Statistics V1_9.XLS". 2001 federal election statistics. Australian Electoral Commission. Retrieved 13 June 2022.