Results of the 2004 Australian federal election in New South Wales

Last updated

2004 Australian federal election
(New South Wales)
Flag of New South Wales.svg
 20019 October 2004 2007  

All 50 New South Wales seats in the Australian House of Representatives
and 6 seats in the Australian Senate
 First partySecond party
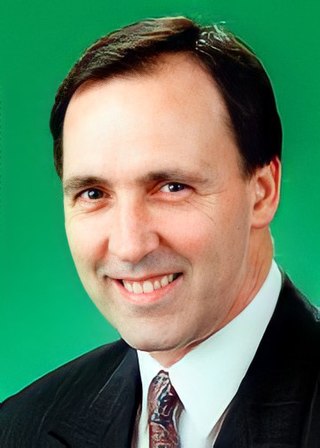
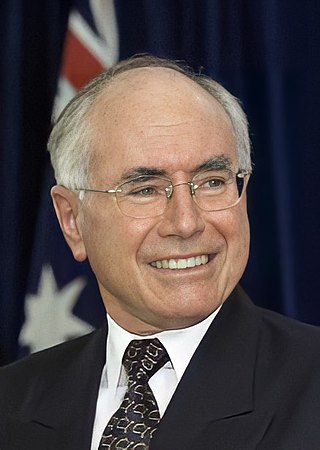
  Howard John BANNER.jpg Mark Latham 1.jpg
Leader John Howard Mark Latham
Party Liberal/National coalition Labor
Last election28 seats20 seats
Seats won27 seats21 seats
Seat changeDecrease2.svg 1Increase2.svg 1
Popular vote1,745,1811,412,418
Percentage45.34%36.70%
SwingIncrease2.svg 2.55Increase2.svg 0.25
TPP 51.93%48.07%
TPP swingIncrease2.svg 0.27Decrease2.svg 0.27

This is a list of electoral division results in the Australian 2004 federal election for the state of New South Wales. [1] [2] [3]

Contents

Overall

Turnout 94.70% (CV) — Informal 6.12% [1]
PartyVotes %SwingSeatsChange
  Liberal 1,391,51136.16+2.5821Steady2.svg
  National 353,6709.19–0.036Decrease2.svg 1
  Labor 1,412,41836.70+0.2521Increase2.svg 1
  Greens 311,3698.093.340Steady2.svg
  One Nation 53,8811.40-3.370Steady2.svg
  Christian Democrats 47,1321.220.000Steady2.svg
  Democrats 41,0721.07-3.170Steady2.svg
  Family First 29,6210.770.770Steady2.svg
  Citizens Electoral Council 11,5000.300.150Steady2.svg
  Liberals for Forests 8,1650.210.210Steady2.svg
  No GST 7,2290.190.060Steady2.svg
  Socialist Alliance 4,4150.110.110Steady2.svg
  Progressive Labour 3,7750.10-0.020Steady2.svg
  Outdoor Recreation 3,5050.090.090Steady2.svg
  Save the ADI Site 3,4900.09-0.070Steady2.svg
  Ex-Service, Service and Veterans 3,1080.080.080Steady2.svg
  New Country 2,8240.070.070Steady2.svg
  Fishing Party 2,5160.070.050Steady2.svg
  Lower Excise Fuel and Beer 2,0070.05-0.030Steady2.svg
  Non-Custodial Parents 1,1320.030.010Steady2.svg
  Nuclear Disarmament 0,3410.010.010Steady2.svg
  Independents 154,0134.00-0.060Steady2.svg
Total4,099,50150
Two-party-preferred vote
  Liberal/National Coalition 1,998,69951.93+0.2727Decrease2.svg 1
  Labor 1,849,99548.07–0.2721Increase2.svg 1
Invalid/blank votes250,8076.12+0.25
Registered voters/turnout4,329,11594.70
Source: AEC Tally Room
Four seats changed hands in NSW during this election, with the Liberal Party experiencing a primary vote of 36.2%, one of its strongest tally’s since the 1975 poll and at the expense of the Labor Party. The opposition lost ground in the outer suburbs of Sydney, areas which it once considered to be very strong for its vote. The Nationals' vote remained steady but the Greens' vote increased by 3.3%, the party’s second best result in the state. [4]

New South Wales

Banks

This section is an excerpt from Electoral results for the Division of Banks § 2004
2004 Australian federal election: Banks [5]
PartyCandidateVotes%±%
Labor Daryl Melham 32,73644.61+0.36
Liberal Roger Gray30,92742.15+6.36
Greens Stephen Makin3,4334.68+1.87
Christian Democrats Janne Peterson2,6543.62+0.95
One Nation Harry Stavrinos2,3023.14−3.17
Democrats Mark Clyburn6750.92−2.27
Family First Greg Briscoe-Hough6550.89+0.89
Total formal votes73,38292.65−0.52
Informal votes5,8187.35+0.52
Turnout 79,20095.09−0.01
Two-party-preferred result
Labor Daryl Melham 37,46851.06−1.83
Liberal Roger Gray35,91448.94+1.83
Labor hold Swing −1.83

Barton

This section is an excerpt from Electoral results for the Division of Barton § 2004
2004 Australian federal election: Barton
PartyCandidateVotes%±%
Labor Robert McClelland 36,90949.66+1.67
Liberal Bruce Morrow29,31939.44+1.71
Greens Angelo Mourikis5,1696.95+4.05
Democrats Eoin Coghlan1,6482.22−2.23
One Nation Neil Baird1,2841.73−1.92
Total formal votes74,32993.04−0.37
Informal votes5,5636.96+0.37
Turnout 79,89294.44+0.02
Two-party-preferred result
Labor Robert McClelland 42,77257.54+1.52
Liberal Bruce Morrow31,55742.46−1.52
Labor hold Swing +1.52

Bennelong

This section is an excerpt from Electoral results for the Division of Bennelong § 2004
2004 Australian federal election: Bennelong [5]
PartyCandidateVotes%±%
Liberal John Howard 38,32649.89−3.18
Labor Nicole Campbell21,81928.40−2.54
Greens Andrew Wilkie 12,57316.37+12.34
Christian Democrats Ray Levick1,8242.37+2.37
Democrats Peter Goldfinch9671.26−4.42
Independent Gary Hannah8541.11+1.11
Independent Troy Rollo4510.59+0.59
Total formal votes76,81494.16−0.42
Informal votes4,7625.84+0.42
Turnout 81,57694.61+0.02
Two-party-preferred result
Liberal John Howard 41,73554.33−3.38
Labor Nicole Campbell35,07945.67+3.38
Liberal hold Swing −3.38

Berowra

This section is an excerpt from Electoral results for the Division of Berowra § 2004
2004 Australian federal election: Berowra
PartyCandidateVotes%±%
Liberal Philip Ruddock 43,67456.14−2.43
Labor Michael Colnan20,35126.16+3.35
Greens Erland Merlin Howden7,4659.60+4.42
Christian Democrats Bruce Coleman2,4113.10+1.00
Democrats Margaret van de Weg1,4571.87−4.62
Family First Lance Clark8831.14+1.14
Independent Matthew Benson8601.11+1.11
Independent Ross Blade6940.89+0.89
Total formal votes77,79594.41−1.23
Informal votes4,6065.59+1.23
Turnout 82,40194.63−0.22
Two-party-preferred result
Liberal Philip Ruddock 48,35862.16−3.49
Labor Michael Colnan29,43737.84+3.49
Liberal hold Swing −3.49

Blaxland

This section is an excerpt from Electoral results for the Division of Blaxland § 2004
2004 Australian federal election: Blaxland [5]
PartyCandidateVotes%±%
Labor Michael Hatton 37,11753.79−0.34
Liberal Mark Majewski21,40731.02+5.11
One Nation Bob Vinnicombe3,3004.78−1.28
Greens Marlene Marquez-Obeid3,2054.64+2.02
Christian Democrats Matthew Squires2,3783.45+1.26
Democrats Martine Eve-Macleod8751.27−3.67
Socialist Alliance Raul Bassi4930.71+0.71
CEC Terry Boath2300.33+0.33
Total formal votes69,00589.30−0.92
Informal votes8,27110.70+0.92
Turnout 77,27693.73−0.17
Two-party-preferred result
Labor Michael Hatton 43,38362.87−2.34
Liberal Mark Majewski25,62237.13+2.34
Labor hold Swing −2.34

Bradfield

This section is an excerpt from Electoral results for the Division of Bradfield § 2004
2004 Australian federal election: Bradfield [5]
PartyCandidateVotes%±%
Liberal Brendan Nelson 51,35663.58−1.02
Labor Neil Neelam16,73520.72+1.71
Greens Robert H Goodwill9,24911.45+4.76
Democrats Jeannette Tsoulos1,9712.44−4.24
Family First Sarah Montgomery1,4591.81+1.81
Total formal votes80,77095.65−0.59
Informal votes3,6754.35+0.59
Turnout 84,44593.81−0.41
Two-party-preferred result
Liberal Brendan Nelson 55,33668.51−2.65
Labor Neil Neelam25,43431.49+2.65
Liberal hold Swing −2.65

Calare

This section is an excerpt from Electoral results for the Division of Calare § 2004
2004 Australian federal election: Calare
PartyCandidateVotes%±%
Independent Peter Andren 40,85150.23−1.17
Labor Robyn Adams13,43916.52−4.04
Liberal Paul Blanch13,08716.09+16.09
National Robert Griffith10,48212.89−7.64
Greens Stephen Nugent1,8682.30+0.77
Family First Melanie Woods9591.18+1.18
CEC Heidi van Schaik6480.80+0.41
Total formal votes81,33496.47−0.25
Informal votes2,9803.53+0.25
Turnout 84,31495.67−0.51
Two-party-preferred result
Liberal Paul Blanch41,56251.1-0.63
Labor Robyn Adams39,77248.9+0.63
Two-candidate-preferred result
Independent Peter Andren 57,93971.24−3.80
Liberal Paul Blanch23,39528.76+28.76
Independent hold Swing −3.80

Charlton

This section is an excerpt from Electoral results for the Division of Charlton § 2004
2004 Australian federal election: Charlton
PartyCandidateVotes%±%
Labor Kelly Hoare 35,76545.95−0.11
Liberal Kurt Darcey27,48035.31+2.00
Greens Suzanne Pritchard6,9648.95+4.01
Family First Paul Scarfe3,3174.26+4.26
One Nation Bob Johnson2,4163.10−4.63
Democrats Ben Roffey1,5131.94−3.13
CEC David Stow3800.49+0.49
Total formal votes77,83595.04−0.38
Informal votes4,0594.96+0.38
Turnout 81,89495.73+0.10
Two-party-preferred result
Labor Kelly Hoare 45,08457.92+1.26
Liberal Kurt Darcey32,75142.08−1.26
Labor hold Swing +1.26

Chifley

This section is an excerpt from Electoral results for the Division of Chifley § 2004
2004 Australian federal election: Chifley
PartyCandidateVotes%±%
Labor Roger Price 39,83655.65−0.65
Liberal Costa Asarloglou20,81429.08+3.56
Greens Debbie Robertson4,3266.04+4.33
Christian Democrats Dave Vincent2,6533.71+1.21
One Nation Terry Cooksley1,5792.21−4.01
Family First Robert Heathcote1,2111.69+1.69
Independent Wayne Hyland8501.19+0.40
Graham Rand3150.44+0.44
Total formal votes71,58489.90−0.90
Informal votes8,04310.10+0.90
Turnout 79,62794.31+0.10
Two-party-preferred result
Labor Roger Price 45,08462.98−2.31
Liberal Costa Asarloglou26,50037.02+2.31
Labor hold Swing −2.31

Cook

This section is an excerpt from Electoral results for the Division of Cook § 2004
2004 Australian federal election: Cook
PartyCandidateVotes%±%
Liberal Bruce Baird 43,16158.03+1.81
Labor Mark Buttigieg 20,59327.69+1.20
Greens Corey Birtles5,1446.92+3.36
Christian Democrats Beth Smith1,7352.33+0.65
One Nation Andy Frew1,5822.13−3.84
No GST Peter Phillips1,0351.39+1.39
Democrats David Mendelssohn6610.89−2.88
Independent Graeme Strang4660.63+0.06
Total formal votes74,37794.47−0.88
Informal votes4,3505.53+0.88
Turnout 78,72795.22−0.06
Two-party-preferred result
Liberal Bruce Baird 47,47063.82−0.18
Labor Mark Buttigieg 26,90736.18+0.18
Liberal hold Swing −0.18

Cowper

This section is an excerpt from Electoral results for the Division of Cowper § 2004
2004 Australian federal election: Cowper
PartyCandidateVotes%±%
National Luke Hartsuyker 38,99850.20+20.31
Labor Allan Williams24,87332.02−0.29
Greens John Carty7,2399.32+3.80
One Nation Allan Stokes3,0983.99−3.07
Lower Excise Fuel Norm Mann2,0072.58−0.02
Democrats Trevor Kapeen1,4681.89−0.82
Total formal votes77,68395.96+0.07
Informal votes3,2734.04−0.07
Turnout 80,95695.19−0.12
Two-party-preferred result
National Luke Hartsuyker 43,85356.45+1.72
Labor Allan Williams33,83043.55−1.72
National hold Swing +1.72

Cunningham

This section is an excerpt from Electoral results for the Division of Cunningham § 2004
2004 Australian federal election: Cunningham [5]
PartyCandidateVotes%±%
Labor Sharon Bird 29,04139.64−4.55
Liberal John Larter21,11528.82+0.78
Greens Michael Organ 14,74720.13+13.49
Christian Democrats Jeff Dakers2,5473.48+0.99
Independent David Moulds1,7962.45+2.45
Progressive Labour James Stewart Keene1,7742.42+2.42
Democrats Tony Evans6860.94−6.23
Liberals for Forests Christopher Scrogie5090.69+0.69
Independent Paul Wilcock3750.51+0.51
Non-Custodial Parents John Flanagan3550.48+0.48
Socialist Alliance Chris Williams3100.42+0.42
Total formal votes73,25593.55−1.61
Informal votes5,0486.45+1.61
Turnout 78,30395.67+0.25
Two-party-preferred result
Labor Sharon Bird 45,02661.46+0.81
Liberal John Larter28,22938.54−0.81
Labor gain from Greens Swing N/A

Dobell

This section is an excerpt from Electoral results for the Division of Dobell § 2004
2004 Australian federal election: Dobell
PartyCandidateVotes%±%
Liberal Ken Ticehurst 37,34749.53+5.60
Labor David Mehan 27,41736.36-6.32
Greens Scott Rickard3,7825.02+2.07
Family First Naomi Paton1,6562.20+2.20
Liberals for Forests Frank Sanzari1,4871.97+1.97
One Nation Andrew Webber1,1631.54-2.78
Democrats Carolyn Hastie6470.86-3.35
Independent Paul Unger4750.63+0.63
Outdoor Recreation Siou Hong Chia4450.59+0.59
Independent Les Wallace4300.57+0.57
Independent James Laing-Peach4170.55+0.55
CEC Steven Hughes1320.18+0.18
Total formal votes75,39892.59-3.15
Informal votes6,0377.41+3.15
Turnout 81,43595.07+0.09
Two-party-preferred result
Liberal Ken Ticehurst 42,15155.90+5.52
Labor David Mehan 33,24744.10-5.52
Liberal hold Swing +5.52

Eden-Monaro

This section is an excerpt from Electoral results for the Division of Eden-Monaro § 2004
2004 Australian federal election: Eden-Monaro
PartyCandidateVotes%±%
Liberal Gary Nairn 40,78348.48+7.40
Labor Kel Watt32,59238.74+2.00
Greens Cecily Dignan6,2567.44+2.46
One Nation Don Tarlinton1,5411.83-1.76
Christian Democrats Ursula Bennett1,1701.39+0.08
Outdoor Recreation Tim Quilty 1,0631.26+1.26
Democrats Nazia Ahmed7250.86-2.43
Total formal votes84,13095.43-0.15
Informal votes4,0324.57+0.15
Turnout 88,16295.28-0.42
Two-party-preferred result
Liberal Gary Nairn 43,86752.14+0.45
Labor Kel Watt40,26347.86-0.45
Liberal hold Swing +0.45

Farrer

This section is an excerpt from Electoral results for the Division of Farrer § 2004
2004 Australian federal election: Farrer [5]
PartyCandidateVotes%±%
Liberal Sussan Ley 48,30463.48+25.82
Labor Nico Mathews17,35422.81+1.85
Greens Bruce Rowston2,7323.59+0.17
Independent John Burbidge1,9562.57+2.57
One Nation Ray Jones1,6182.13-4.22
Family First Jennifer Weller1,3951.83+1.83
Christian Democrats Ian Paul Burn1,2751.68+1.68
Independent Matt Morgan6820.90+0.90
Democrats Frank Kovacs4630.61-1.98
CEC Chris Lahy3180.42+0.42
Total formal votes76,09793.30-0.31
Informal votes5,4646.70+0.31
Turnout 81,56195.16-0.42
Two-party-preferred result
Liberal Sussan Ley 53,12969.82+19.68
Labor Nico Mathews22,96830.18+30.18
Liberal hold Swing +19.68

Fowler

This section is an excerpt from Electoral results for the Division of Fowler § 2004
2004 Australian federal election: Fowler
PartyCandidateVotes%±%
Labor Julia Irwin 44,14162.78+2.08
Liberal Philip Powrie18,25325.96+7.92
Greens Pauline Tyrrell5,1647.34+4.89
Independent Jose Nunez1,5942.27+2.27
CEC Hal Johnson1,1621.65-1.56
Total formal votes70,31490.89+3.64
Informal votes7,0489.11-3.64
Turnout 77,36293.34-0.01
Two-party-preferred result
Labor Julia Irwin 50,17471.36-0.13
Liberal Philip Powrie20,14028.64+0.13
Labor hold Swing -0.13

Gilmore

This section is an excerpt from Electoral results for the Division of Gilmore § 2004
2004 Australian federal election: Gilmore
PartyCandidateVotes%±%
Liberal Joanna Gash 43,72354.58-1.53
Labor Megan Pikett24,83531.00+4.95
Greens Ben van der Wijngaart6,2347.78+2.29
Christian Democrats Paul Green 3,3814.22+2.59
One Nation Col Harding1,7622.20-3.60
CEC Jean McClung1760.22+0.07
Total formal votes80,11195.77+0.11
Informal votes3,5424.23-0.11
Turnout 83,65395.47-0.21
Two-party-preferred result
Liberal Joanna Gash 48,13060.08-4.55
Labor Megan Pikett31,98139.92+4.55
Liberal hold Swing -4.55

Grayndler

This section is an excerpt from Electoral results for the Division of Grayndler § 2004
2004 Australian federal election: Grayndler [5]
PartyCandidateVotes%±%
Labor Anthony Albanese 38,63451.18+2.03
Liberal Stephanie Kokkolis18,34724.31+1.38
Greens Philip Myers15,91421.08+8.02
Democrats Jen Harrison1,5792.09-7.03
Socialist Alliance Sue Johnson10101.34+1.34
Total formal votes75,48494.58+1.14
Informal votes4,3225.42-1.14
Turnout 79,80692.94+0.99
Two-party-preferred result
Labor Anthony Albanese 54,79872.60+1.31
Liberal Stephanie Kokkolis20,68627.40-1.31
Labor hold Swing +1.31

Greenway

This section is an excerpt from Electoral results for the Division of Greenway § 2004
2004 Australian federal election: Greenway
PartyCandidateVotes%±%
Liberal Louise Markus 33,35343.96+7.02
Labor Ed Husic 30,38940.05-2.61
Greens Astrid O'Neill2,7303.60+0.96
Christian Democrats Greg Tan2,1422.82-2.81
Save the ADI Site Jean Lopez1,3621.79+1.79
One Nation Tony Pettitt1,0401.37-4.10
Liberals for Forests Julie-Anne Houlton8951.18+1.18
Fishing Party Joe Chidiac8811.16+1.16
Family First John Dorhauer8771.16+1.16
Outdoor Recreation Grant Bayley7721.02+1.02
Democrats David King6720.89-2.82
Independent F Ivor4200.55+0.55
Independent Amarjit Tanda2670.35-0.47
CEC Goran Reves790.10+0.10
Total formal votes75,87988.17-5.04
Informal votes10,18311.83+5.04
Turnout 86,06295.31+0.50
Two-party-preferred result
Liberal Louise Markus 38,38150.58+3.69
Labor Ed Husic 37,49849.42-3.69
Liberal gain from Labor Swing +3.69

Gwydir

This section is an excerpt from Electoral results for the Division of Gwydir § 2004
2004 Australian federal election: Gwydir
PartyCandidateVotes%±%
National John Anderson 46,95161.95+9.32
Labor Glenn Sims17,39622.95+0.30
Independent Bruce Haigh 3,7975.01-1.03
One Nation Colin Rogers3,4414.54-5.50
Greens Michael Anderson3,3994.48+2.76
CEC Richard Stringer8081.07-0.49
Total formal votes75,79296.40+0.93
Informal votes2,8303.60-0.93
Turnout 78,62295.15+0.03
Two-party-preferred result
National John Anderson 51,83568.39+3.51
Labor Glenn Sims23,95731.61-3.51
National hold Swing +3.51

Hughes

This section is an excerpt from Electoral results for the Division of Hughes § 2004
2004 Australian federal election: Hughes
PartyCandidateVotes%±%
Liberal Danna Vale 43,72655.28+1.67
Labor Greg Holland24,73931.28+0.04
Greens Lorraine Dixon5,3726.79+2.23
Christian Democrats John Vanderjagt2,5893.27+1.15
Veterans Bob Davis1,5041.90+1.90
Democrats Rob Bunt1,1621.47-2.08
Total formal votes79,09194.93-0.99
Informal votes4,2205.07+0.99
Turnout 83,31295.45-0.69
Two-party-preferred result
Liberal Danna Vale 48,27961.04+0.63
Labor Greg Holland30,81338.96-0.63
Liberal hold Swing +0.63

Hume

This section is an excerpt from Electoral results for the Division of Hume § 2004
2004 Australian federal election: Hume
PartyCandidateVotes%±%
Liberal Alby Schultz 46,65257.63+4.64
Labor Graeme Shannon22,86228.24−1.34
Greens David Robert Horton5,2646.50+2.16
Christian Democrats Geoff Peet2,8803.56+3.56
Independent Peter Martin1,0231.26+1.26
Independent Arthur Schofield1,0111.25+1.25
Democrats Giuseppe Minissale7130.88−3.88
CEC Lindsay Cosgrove5410.67+0.67
Total formal votes80,94694.55−1.90
Informal votes4,6695.45+1.90
Turnout 85,61595.57−0.16
Two-party-preferred result
Liberal Alby Schultz 51,90864.13+4.34
Labor Graeme Shannon29,03835.87−4.34
Liberal hold Swing +4.34

Hunter

This section is an excerpt from Electoral results for the Division of Hunter § 2004
2004 Australian federal election: Hunter
PartyCandidateVotes%±%
Labor Joel Fitzgibbon 43,21653.60+1.28
National Beth Black21,62126.81-0.69
Greens Kerry Suwald5,1956.44+1.92
Independent Bill Fox2,6183.25+3.25
CEC Ann Lawler2,5903.21+1.76
One Nation Neil Scholes2,5433.15-7.16
Christian Democrats Adrian Melbourne1,6732.07+2.07
Family First Michael Woods1,1761.46+1.46
Total formal votes80,63294.70-1.88
Informal votes4,5125.30+1.88
Turnout 85,14495.67-0.46
Two-party-preferred result
Labor Joel Fitzgibbon 51,40163.75+2.89
National Beth Black29,23136.25-2.89
Labor hold Swing +2.89

Kingsford Smith

This section is an excerpt from Electoral results for the Division of Kingsford Smith § 2004
2004 Australian federal election: Kingsford Smith [5]
PartyCandidateVotes%±%
Labor Peter Garrett 36,56549.60+1.91
Liberal Nicholas Prassas26,63936.14+1.88
Greens Hannah Robert5,4307.37+0.10
Independent Charles Matthews2,5053.40+3.40
One Nation Anna Winter7791.06-3.80
Democrats Nicole Tillotson7471.01-4.19
No GST Reg Gilroy5630.76+0.76
Socialist Alliance Maureen Frances2730.37+0.37
James Cogan2140.29+0.29
Total formal votes73,71591.57-2.29
Informal votes6,7908.43+2.29
Turnout 80,50593.74-0.19
Two-party-preferred result
Labor Peter Garrett 43,49859.01+0.11
Liberal Nicholas Prassas30,21740.99-0.11
Labor hold Swing +0.11

Lindsay

This section is an excerpt from Electoral results for the Division of Lindsay § 2004
2004 Australian federal election: Lindsay
PartyCandidateVotes%±%
Liberal Jackie Kelly 35,11948.07+1.14
Labor David Bradbury 27,11737.12+2.52
Greens Gabrielle Worrall2,5473.49+1.00
Christian Democrats John Phillips2,0262.77+0.13
Save the ADI Site Barbie Bates1,9532.67-0.60
One Nation Louise Kedwell1,3671.87-3.28
No GST Garth Derrig1,1561.58+0.85
Family First Megan Watson1,0061.38+1.38
Democrats Geraldine Waters6150.84-1.32
CEC Bruce Anderson1480.20+0.20
Total formal votes73,05492.55-1.31
Informal votes5,8807.45+1.31
Turnout 78,93495.34-0.17
Two-party-preferred result
Liberal Jackie Kelly 40,36755.26-0.21
Labor David Bradbury 32,68744.74+0.21
Liberal hold Swing -0.21

Lowe

This section is an excerpt from Electoral results for the Division of Lowe § 2004
2004 Australian federal election: Lowe [5]
PartyCandidateVotes%±%
Labor John Murphy 32,77742.89-1.88
Liberal John Sidoti 32,65442.73+0.77
Greens Shireen Murphy7,0579.24+5.04
Christian Democrats Peter Rahme1,5191.99+1.99
Democrats Biannca Pace1,0131.33-3.16
Liberals for Forests Timothy Avery7170.94+0.94
One Nation John Mason6780.89-1.06
Total formal votes76,41593.45-0.75
Informal votes5,3546.55+0.75
Turnout 81,76994.31-0.60
Two-party-preferred result
Labor John Murphy 40,72753.30-0.51
Liberal John Sidoti 35,68846.70+0.51
Labor hold Swing -0.51

Lyne

This section is an excerpt from Electoral results for the Division of Lyne § 2004
2004 Australian federal election: Lyne [5]
PartyCandidateVotes%±%
National Mark Vaile 46,95856.31+3.01
Labor Greg Watters22,32526.77−2.45
Greens Jeremy Bradley3,9664.76+1.79
One Nation Joan Stanfield3,0463.65−6.56
New Country Robyn Murphy2,8243.39+3.39
Democrats Peter Wildblood1,4011.68−1.11
Independent Kerry Salt1,3271.59+1.59
Family First Simon Apostle1,1811.42+1.42
CEC Graeme Muldoon2250.27−0.04
Socialist Alliance Ron Bailey1410.17+0.17
Total formal votes83,39494.51−1.49
Informal votes4,7495.39+1.49
Turnout 88,14395.62−0.30
Two-party-preferred result
National Mark Vaile 52,56463.03+1.79
Labor Greg Watters30,83036.97−1.79
National hold Swing +1.79

Macarthur

This section is an excerpt from Electoral results for the Division of Macarthur § 2004
2004 Australian federal election: Macarthur [5]
PartyCandidateVotes%±%
Liberal Pat Farmer 40,46954.47+3.68
Labor Meg Oates24,58433.09-2.79
Greens Jennifer Hanson3,3244.47+1.42
Family First Mick Agius1,7352.34+2.34
Christian Democrats Ralph Dunkerley1,7302.33+0.86
One Nation Len Watkins1,2661.70-3.55
Democrats Lester Pearce6250.84-1.33
Independent Max Brazenall5580.75+0.75
Total formal votes74,29192.63-1.44
Informal votes5,9077.37+1.44
Turnout 80,19895.15+0.21
Two-party-preferred result
Liberal Pat Farmer 44,20959.51+2.55
Labor Meg Oates30,08240.49-2.55
Liberal hold Swing +2.55

Mackellar

This section is an excerpt from Electoral results for the Division of Mackellar § 2004
2004 Australian federal election: Mackellar [5]
PartyCandidateVotes%±%
Liberal Bronwyn Bishop 44,77857.26-0.38
Labor Chris Sharpe15,49219.81+0.91
Greens Christian Downie8,19310.48+2.41
Independent Robert Dunn6,0507.74+7.74
Family First Roz Trestrail1,3181.69+1.69
Independent Stephen Wells1,2311.57+1.57
Democrats Mario Nicotra1,1331.45-8.01
Total formal votes78,19595.24-0.10
Informal votes3,9054.76+0.10
Turnout 82,10094.16-0.20
Two-party-preferred result
Liberal Bronwyn Bishop 51,41565.75-1.12
Labor Chris Sharpe26,78034.25+1.12
Liberal hold Swing -1.12

Macquarie

This section is an excerpt from Electoral results for the Division of Macquarie § 2004
2004 Australian federal election: Macquarie
PartyCandidateVotes%±%
Liberal Kerry Bartlett 42,02153.27+2.27
Labor Mark Ptolemy21,89827.76+0.93
Greens Joel Macrae8,56110.85+2.43
Christian Democrats Brian Grigg1,8552.35+2.27
Independent Tim Williams1,7742.25+2.25
Family First Troy Geri1,0821.37+1.37
Democrats John Haydon9691.23-4.23
No GST Matthew Derrig6390.81+0.81
CEC Michael Segedin860.11+0.11
Total formal votes78,88594.72-1.43
Informal votes4,3945.28+1.43
Turnout 83,27995.16+0.18
Two-party-preferred result
Liberal Kerry Bartlett 46,48258.92+0.25
Labor Mark Ptolemy32,40341.08-0.25
Liberal hold Swing +0.25

Mitchell

This section is an excerpt from Electoral results for the Division of Mitchell § 2004
2004 Australian federal election: Mitchell [5]
PartyCandidateVotes%±%
Liberal Alan Cadman 54,58264.35+1.09
Labor Harmohan Walia17,67320.84-0.65
Greens Sheryl Jarecki5,2586.20+3.07
Christian Democrats Michael Horgan2,1612.55+0.42
Democrats Kamran Keshavarz Talebi1,4401.70-3.07
Family First Joy Montgomery1,1401.34+1.34
Independent Stephen Burke1,0481.24+0.34
One Nation Norman Byleveld1,0371.22-1.54
Independent Jordie Stuart Bodlay4760.56+0.56
Total formal votes84,81593.40-2.10
Informal votes5,9916.60+2.10
Turnout 90,80695.10-0.41
Two-party-preferred result
Liberal Alan Cadman 59,95070.68-0.64
Labor Harmohan Walia24,86529.32+0.64
Liberal hold Swing -0.64

New England

This section is an excerpt from Electoral results for the Division of New England § 2004
2004 Australian federal election: New England
PartyCandidateVotes%±%
Independent Tony Windsor 46,07257.27+12.23
National Trevor Khan 15,03118.69-20.21
Liberal Scot MacDonald 8,07010.03+10.03
Labor Greg Smith6,9888.69-1.26
Greens Bruce Taylor2,6793.33+1.07
One Nation Raymond Scholes1,1461.42-1.34
CEC Steve Lawler4550.57+0.57
Total formal votes80,44197.23-0.80
Informal votes2,2912.77+0.80
Turnout 82,73295.40-0.56
Two-party-preferred result
National Trevor Khan 50,84763.21-0.64
Labor Greg Smith29,59436.79+0.64
Two-candidate-preferred result
Independent Tony Windsor 57,11571.00+12.70
National Trevor Khan 23,32629.00-12.70
Independent hold Swing +12.70

Newcastle

This section is an excerpt from Electoral results for the Division of Newcastle2004
2004 Australian federal election: Newcastle
PartyCandidateVotes%±%
Labor Sharon Grierson 37,39245.98+5.03
Liberal Josephine Barfield28,90235.54+5.17
Greens Annie Rooke-Frizell9,70111.93+4.41
Democrats Eddie Smith2,0182.48-3.27
Progressive Labour Harry Williams2,0012.46-2.65
CEC Don Bower8131.00+1.00
Socialist Alliance Peter Robson4910.60+0.60
Total formal votes81,31895.01-0.19
Informal votes4,2714.99+0.19
Turnout 85,58994.72+0.45
Two-party-preferred result
Labor Sharon Grierson 48,77159.98+3.07
Liberal Josephine Barfield32,54740.02-3.07
Labor hold Swing +3.07

North Sydney

This section is an excerpt from Electoral results for the Division of North Sydney § 2004
2004 Australian federal election: North Sydney
PartyCandidateVotes%±%
Liberal Joe Hockey 45,10556.24-0.72
Labor Fran Teirney21,86427.26+2.79
Greens Ted Nixon9,89012.33+4.67
Independent Edwina Mary Cowdery1,8842.35+2.35
Democrats Jan de Voogd1,4561.82-6.44
Total formal votes80,19996.35+0.37
Informal votes3,0343.65-0.37
Turnout 83,23393.43+0.71
Two-party-preferred result
Liberal Joe Hockey 48,14560.03-3.19
Labor Fran Teirney32,05439.97+3.19
Liberal hold Swing -3.19

Page

This section is an excerpt from Electoral results for the Division of Page § 2004
2004 Australian federal election: Page
PartyCandidateVotes%±%
National Ian Causley 37,63748.48+6.63
Labor Kevin Bell25,70233.11+4.11
Greens Mark Jackson8,39910.82+3.62
Liberals for Forests Belinda Anderson2,1552.78+2.78
Outdoor Recreation Chris Mateer1,2251.58+1.58
Doug Behn1,2161.57+0.72
CEC Angela Griffiths8391.08+0.93
Socialist Alliance Tom Flanagan4600.59+0.59
Total formal votes77,63395.77+1.09
Informal votes3,4274.23-1.09
Turnout 81,06095.34-0.37
Two-party-preferred result
National Ian Causley 42,09954.23+1.46
Labor Kevin Bell35,53445.77-1.46
National hold Swing +1.46

Parkes

This section is an excerpt from Electoral results for the Division of Parkes § 2004
2004 Australian federal election: Parkes
PartyCandidateVotes%±%
National John Cobb 45,56960.49+9.39
Labor Joe Knagge23,56831.28-1.93
Independent Michael John Boland2,9043.85+3.85
Greens Terrance Loughlin2,5773.42+0.89
CEC Makere Rangihaeata7170.95+0.95
Total formal votes75,33596.05-0.45
Informal votes3,1013.95+0.45
Turnout 78,43695.69+0.12
Two-party-preferred result
National John Cobb 48,51264.40+5.66
Labor Joe Knagge26,82335.60-5.66
National hold Swing +5.66

Parramatta

This section is an excerpt from Electoral results for the Division of Parramatta § 2004
2004 Australian federal election: Parramatta [5]
PartyCandidateVotes%±%
Liberal Ross Cameron 33,07344.09-1.85
Labor Julie Owens 31,16641.55+0.14
Greens Doug Williamson3,9735.30+2.21
Christian Democrats Sam Baissari1,9482.60+1.07
Liberals for Forests Mark Antony Guest9851.31+1.31
One Nation John Satchwell8591.15-1.81
Democrats Rob McFarlane7981.06-2.35
Non-Custodial Parents Alex Peniazev7771.04+0.85
Family First Andrew Markwell6740.90+0.90
No GST Simon Saad5810.77+0.77
Save the ADI Site Margaret Bloor1750.23+0.23
Total formal votes75,00991.47-2.32
Informal votes6,9968.53+2.32
Turnout 82,00594.13+0.12
Two-party-preferred result
Labor Julie Owens 38,08350.77+1.92
Liberal Ross Cameron 36,92649.23-1.92
Labor gain from Liberal Swing +1.92

Paterson

This section is an excerpt from Electoral results for the Division of Paterson § 2004
2004 Australian federal election: Paterson [5]
PartyCandidateVotes%±%
Liberal Bob Baldwin 41,28951.99+12.08
Labor Giovanna Kozary28,63336.05-4.70
Greens Aina Ranke3,3034.16+1.44
One Nation Charlie Griffith1,4171.78-3.71
Veterans Bruce McKenzie9871.24+1.24
Fishing Party Paul Hennelly7780.98+0.05
CEC Tony King7270.92+0.48
Family First Larissa Robb6810.86+0.86
Independent Mike Tuffy6770.85+0.85
Democrats Brett Paterson5770.73-1.84
Independent Neil Smith3510.44+0.44
Total formal votes79,42093.87-2.52
Informal votes5,1836.13+2.52
Turnout 84,60396.08-0.57
Two-party-preferred result
Liberal Bob Baldwin 45,24456.97+5.55
Labor Giovanna Kozary34,17843.03-5.55
Liberal hold Swing +5.55

Prospect

This section is an excerpt from Electoral results for the Division of Prospect § 2004
2004 Australian federal election: Prospect
PartyCandidateVotes%±%
Labor Chris Bowen 37,80250.07-5.29
Liberal Robert Jacobucci28,82838.19+10.54
Greens Kelly Marks4,0095.31+0.73
Christian Democrats Manny Poularas2,2853.03+0.47
One Nation John Abromas1,4381.90-2.60
Democrats Lily Arthur1,1311.50-0.79
Total formal votes75,49390.76-0.25
Informal votes7,9069.24+0.25
Turnout 83,18395.03-0.26
Two-party-preferred result
Labor Chris Bowen 43,11957.12-5.69
Liberal Robert Jacobucci32,37442.88+5.69
Labor hold Swing -5.69

Reid

This section is an excerpt from Electoral results for the Division of Reid § 2004
2004 Australian federal election: Reid
PartyCandidateVotes%±%
Labor Laurie Ferguson 33,05251.37-5.72
Liberal Sarah McMahon19,79630.76+8.28
Greens Wafaa Salti3,3765.25+2.24
No GST Nicholas Khoury3,0844.79+4.79
Christian Democrats Kylie Laurence2,2963.57+1.22
One Nation Neville Williams1,2671.97-3.47
Democrats Tony Yoo8021.25-2.17
Socialist Alliance Lisa Macdonald6731.05+1.05
Total formal votes64,34688.29-0.63
Informal votes8,53711.71+0.63
Turnout 72,88392.95-0.33
Two-party-preferred result
Labor Laurie Ferguson 40,38862.77-4.10
Liberal Sarah McMahon23,95837.23+4.10
Labor hold Swing -4.10

Richmond

This section is an excerpt from Electoral results for the Division of Richmond § 2004
2004 Australian federal election: Richmond
PartyCandidateVotes%±%
National Larry Anthony 36,09545.79+1.04
Labor Justine Elliot 28,05935.60+1.60
Greens Susanna Flower9,75112.37+2.31
Family First Craig Lees1,6262.06+2.06
Liberals for Forests Fiona Tyler1,4171.80+1.80
Democrats Timothy Winton-Brown9131.16-1.71
Veterans Allan Watt6170.78+0.78
Nuclear Disarmament Dean Jefferys3410.43+0.43
Total formal votes78,81996.39+1.74
Informal votes2,9513.61-1.74
Turnout 81,77094.68+0.28
Two-party-preferred result
Labor Justine Elliot 39,56050.19+1.87
National Larry Anthony 39,25949.81-1.87
Labor gain from National Swing +1.74

Riverina

This section is an excerpt from Electoral results for the Division of Riverina § 2004
2004 Australian federal election: Riverina
PartyCandidateVotes%±%
National Kay Hull 54,32866.83+5.38
Labor Victoria Brooks20,08024.70+0.70
Greens Ray Goodlass3,4974.30+1.87
One Nation Neil Turner3,3894.17-1.43
Total formal votes81,29496.44+0.40
Informal votes3,1963.78-0.40
Turnout 84,49095.71-0.23
Two-party-preferred result
National Kay Hull 57,44070.66+0.79
Labor Victoria Brooks23,85429.34-0.79
National hold Swing +0.79

Robertson

This section is an excerpt from Electoral results for the Division of Robertson § 2004
2004 Australian federal election: Robertson
PartyCandidateVotes%±%
Liberal Jim Lloyd 41,81653.62+2.82
Labor Trish Moran27,10734.76+0.68
Greens Terry Jones6,2007.95+4.63
One Nation Don Parkes1,3441.72-1.36
Family First Carolyn Dorhauer1,3121.68+1.68
CEC Nicholas Tomlin2110.27+0.10
Total formal votes77,99095.61+1.72
Informal votes3,5814.39-1.72
Turnout 81,57195.38-0.17
Two-party-preferred result
Liberal Jim Lloyd 44,30856.81-0.17
Labor Trish Moran33,68243.19+0.17
Liberal hold Swing -0.17

Shortland

This section is an excerpt from Electoral results for the Division of Shortland § 2004
2004 Australian federal election: Shortland [5]
PartyCandidateVotes%±%
Labor Jill Hall 40,06949.91+0.21
Liberal Dell Tschanter28,74535.81+1.14
Greens Bob Phillips6,3337.89+3.77
One Nation Florence Roberts2,1132.63-2.05
Family First Brian Dixon1,8042.25+2.25
Democrats Peter Lee1,2111.51-1.64
Total formal votes80,27595.38-0.06
Informal votes3,8844.62+0.06
Turnout 84,15995.54-0.12
Two-party-preferred result
Labor Jill Hall 47,75459.49+0.71
Liberal Dell Tschanter32,52140.51-0.71
Labor hold Swing +0.71

Sydney

This section is an excerpt from Electoral results for the Division of Sydney § 2004
2004 Australian federal election: Sydney
PartyCandidateVotes%±%
Labor Tanya Plibersek 36,76644.68+0.35
Liberal Michael Shevers23,41928.46-1.64
Greens Jenny Leong 17,78421.61+6.92
Democrats Michelle Bleicher1,7012.07-8.81
Independent Jane Ward1,3461.64+1.64
Socialist Alliance Susan Price5640.69+0.69
Independent Michael Webb5530.67+0.67
CEC Adrian Ford1500.18+0.18
Total formal votes82,28394.71-1.05
Informal votes4,6005.29+1.05
Turnout 86,88391.61+1.37
Two-party-preferred result
Labor Tanya Plibersek 54,65666.42+1.38
Liberal Michael Shevers27,62733.58-1.38
Labor hold Swing +1.38

Throsby

This section is an excerpt from Electoral results for the Division of Throwsby § 2004
2004 Australian federal election: Throsby
PartyCandidateVotes%±%
Labor Jennie George 44,49556.26+1.36
Liberal Linda Nelson24,51931.00+5.78
Greens Trevor Jones7,99510.11+5.61
Democrats Madeleine Roberts2,0782.63-4.88
Total formal votes79,08794.47-0.34
Informal votes4,6295.53+0.34
Turnout 83,71695.87+0.36
Two-party-preferred result
Labor Jennie George 51,40765.00-0.10
Liberal Linda Nelson27,68035.00+0.10
Labor hold Swing -0.10

Warringah

This section is an excerpt from Electoral results for the Division of Warringah § 2004
2004 Australian federal election: Warringah [6]
PartyCandidateVotes%±%
Liberal Tony Abbott 40,79854.53+3.08
Labor Linda Beattie19,18125.64+13.56
Greens Ian Hehir8,83311.81+8.12
Independent Patricia Petersen 1,9142.56+2.56
One Nation David Kelly1,1421.53−0.21
Family First Phil McPherson1,0231.37+1.37
Fishing Party Edward Kelly6180.83+0.83
Independent Dian Maie Underwood5240.70+0.70
Independent Peter Thyer4710.63+0.63
Independent Neil Francey3120.42+0.42
Total formal votes74,81694.11−2.61
Informal votes4,6845.89+2.61
Turnout 79,50093.15−0.54
Two-party-preferred result
Liberal Tony Abbott 45,25060.48-2.18
Labor Linda Beattie29,56639.52+2.18
Liberal hold Swing −2.18

Watson

This section is an excerpt from Electoral results for the Division of Watson § 2004
2004 Australian federal election: Watson
PartyCandidateVotes%±%
Labor Tony Burke 39,04656.65+0.50
Liberal Keith Topolski21,72331.52+3.40
Greens Kali Reid4,6676.77+3.29
Family First Cat Cannone1,1501.67+1.67
One Nation John Coleman1,0931.59-1.49
Democrats Garry Dalrymple9141.33-2.63
Ron Poulsen3350.49+0.03
Total formal votes68,92890.90-1.58
Informal votes6,8989.10+1.58
Turnout 75,82692.68-0.17
Two-party-preferred result
Labor Tony Burke 44,89965.14-2.17
Liberal Keith Topolski24,02934.86+2.17
Labor hold Swing -2.17

Wentworth

This section is an excerpt from Electoral results for the Division of Wentworth § 2004
2004 Australian federal election: Wentworth
PartyCandidateVotes%±%
Liberal Malcolm Turnbull 30,77141.79-10.29
Labor David Patch19,39126.34-3.18
Independent Peter King 13,23617.98+17.98
Greens Mithra Cox8,21011.15+1.38
Democrats Lindy Morrison 6830.93-5.22
Independent Robert Vogler3390.46+0.46
Family First Leonie Hull3010.41+0.41
Fishing Party Victor Shen2390.32+0.32
Independent Pat Sheil2180.30+0.30
No GST Brian Buckley1710.23+0.23
CEC John Jamieson650.09+0.09
Total formal votes73,62493.82-1.33
Informal votes4,8536.18+1.33
Turnout 78,47792.34+0.61
Two-party-preferred result
Liberal Malcolm Turnbull 40,84755.48-2.38
Labor David Patch32,77744.52+2.38
Liberal hold Swing -2.38

Werriwa

This section is an excerpt from Electoral results for the Division of Werriwa § 2004
2004 Australian federal election: Werriwa
PartyCandidateVotes%±%
Labor Mark Latham 40,83752.64+2.31
Liberal Michael Medway27,24135.11+1.79
Independent Sam Bargshoon3,7794.87+4.87
Greens Ben Raue2,4323.13+0.48
One Nation Charles Doggett1,8312.36−2.36
Democrats Patrick Briscoe-Hough9651.24−1.40
Mike Head4970.64+0.64
Total formal votes77,58292.02+0.53
Informal votes6,7247.98−0.53
Turnout 84,30693.92−0.05
Two-party-preferred result
Labor Mark Latham 46,01259.31+0.82
Liberal Michael Medway31,57040.69−0.82
Labor hold Swing +0.82

See also

Related Research Articles

This is a list of electoral results for the Division of Banks in Australian federal elections from the division's creation in 1949 until the present.

This is a list of electoral results for the Division of Bennelong in Australian federal elections from the electorate's creation in 1949 until the present.

This is a list of electoral results for the Division of Bradfield in Australian federal elections from the electorate's creation in 1949 until the present.

This is a list of electoral results for the Division of Kingsford Smith in Australian federal elections from the division's creation in 1949 until the present.

This is a list of electoral results for the Division of Warringah in Australian federal elections from the division's creation in 1922 until the present.

This is a list of electoral division results for the Australian 1954 federal election.

This is a list of electoral division results for the Australian 1946 federal election.

This is a list of electoral division results for the Australian 1949 federal election.

This is a list of electoral division results for the Australian 1951 federal election.

This is a list of electoral division results for the Australian 1955 federal election.

This is a list of electoral division results for the Australian 1958 federal election.

This is a list of electoral division results for the Australian 1963 federal election.

This is a list of electoral division results for the Australian 1969 federal election.

This is a list of electoral division results for the Australian 1972 federal election.

This is a list of electoral division results for the Australian 1974 federal election.

This is a list of electoral division results for the Australian 1975 federal election.

This is a list of electoral division results for the Australian 1977 federal election.

This is a list of electoral division results for the Australian 1980 federal election.

This is a list of electoral division results for the Australian 1983 federal election.

Results of the 2007 Australian federal election in New South Wales

This is a list of electoral division results in the Australian 2007 federal election for the state of New South Wales.
References

  1. 1 2 "2004 First preference votes for New South Wales". Australian Electoral Commission. Retrieved 6 June 2022.
  2. "2004 New South Wales division results". Australian Electoral Commission. Retrieved 24 May 2022.
  3. "2004 House of Representatives". Psephos Adam Carr's Election Archive. Retrieved 3 June 2022.
  4. Bennett, Scott; Kopras, Andrew; Newman, Gerrard (2005). "Commonwealth Election 2004" (PDF).
  5. 1 2 3 4 5 6 7 8 9 10 11 12 13 14 15 16 "2004 House of Representatives: NSW". Psephos Adam Carr's Election Archive. Retrieved 3 June 2022.
  6. "2004 Warringah". Virtual Tally Room 2004. Australian Electoral Commission. Retrieved 20 August 2021.